-
-

MacroNet
-
MacroNet

Inspiration - MacroNet
The world is unpredictable, this is a truth we all live with. We can’t foresee the future, nor can we fully grasp how forthcoming events will impact us. The uncertainty of how certain potential scenarios might unfold creates anxiety for individuals and businesses alike. So, how can companies protect themselves and plan strategies to navigate the unknowns? How can financial institutions safeguard their customers and adjust policies for future uncertainty? How can individuals protect their financial interests against the uncertainty of tomorrow.
Entering this hackathon, we were driven by pushing the bounds of data analysis. Just how big could "big data" get? What if we could analyze not only millions, but millions of points of past events to predict the ripple effects of a hypothetical news event and understand how it could reshape the world? We set out to tackle this ambitious challenge. Our vision was to push the limits of data analysis and allow users to input their concerns, enabling them to visualize the far-reaching consequences of news and its impact on the world around them. Empowering individuals and businesses to their full future potential.
What it does
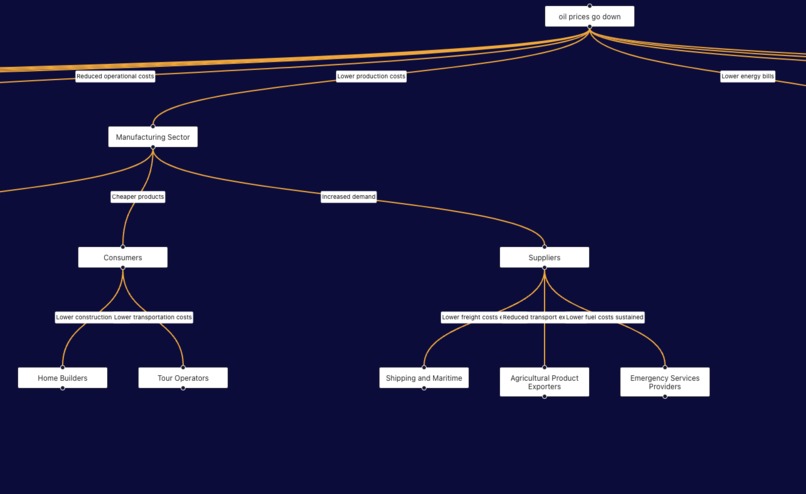
OracleNet is a powerful tool built on a graph that connects more than 3 million entities through causal relationships. Picture this: Russia increases oil production → causes → a decrease in oil prices → leading to → lower global shipping costs → which drives → higher productivity → ultimately resulting in → a global GDP boost.
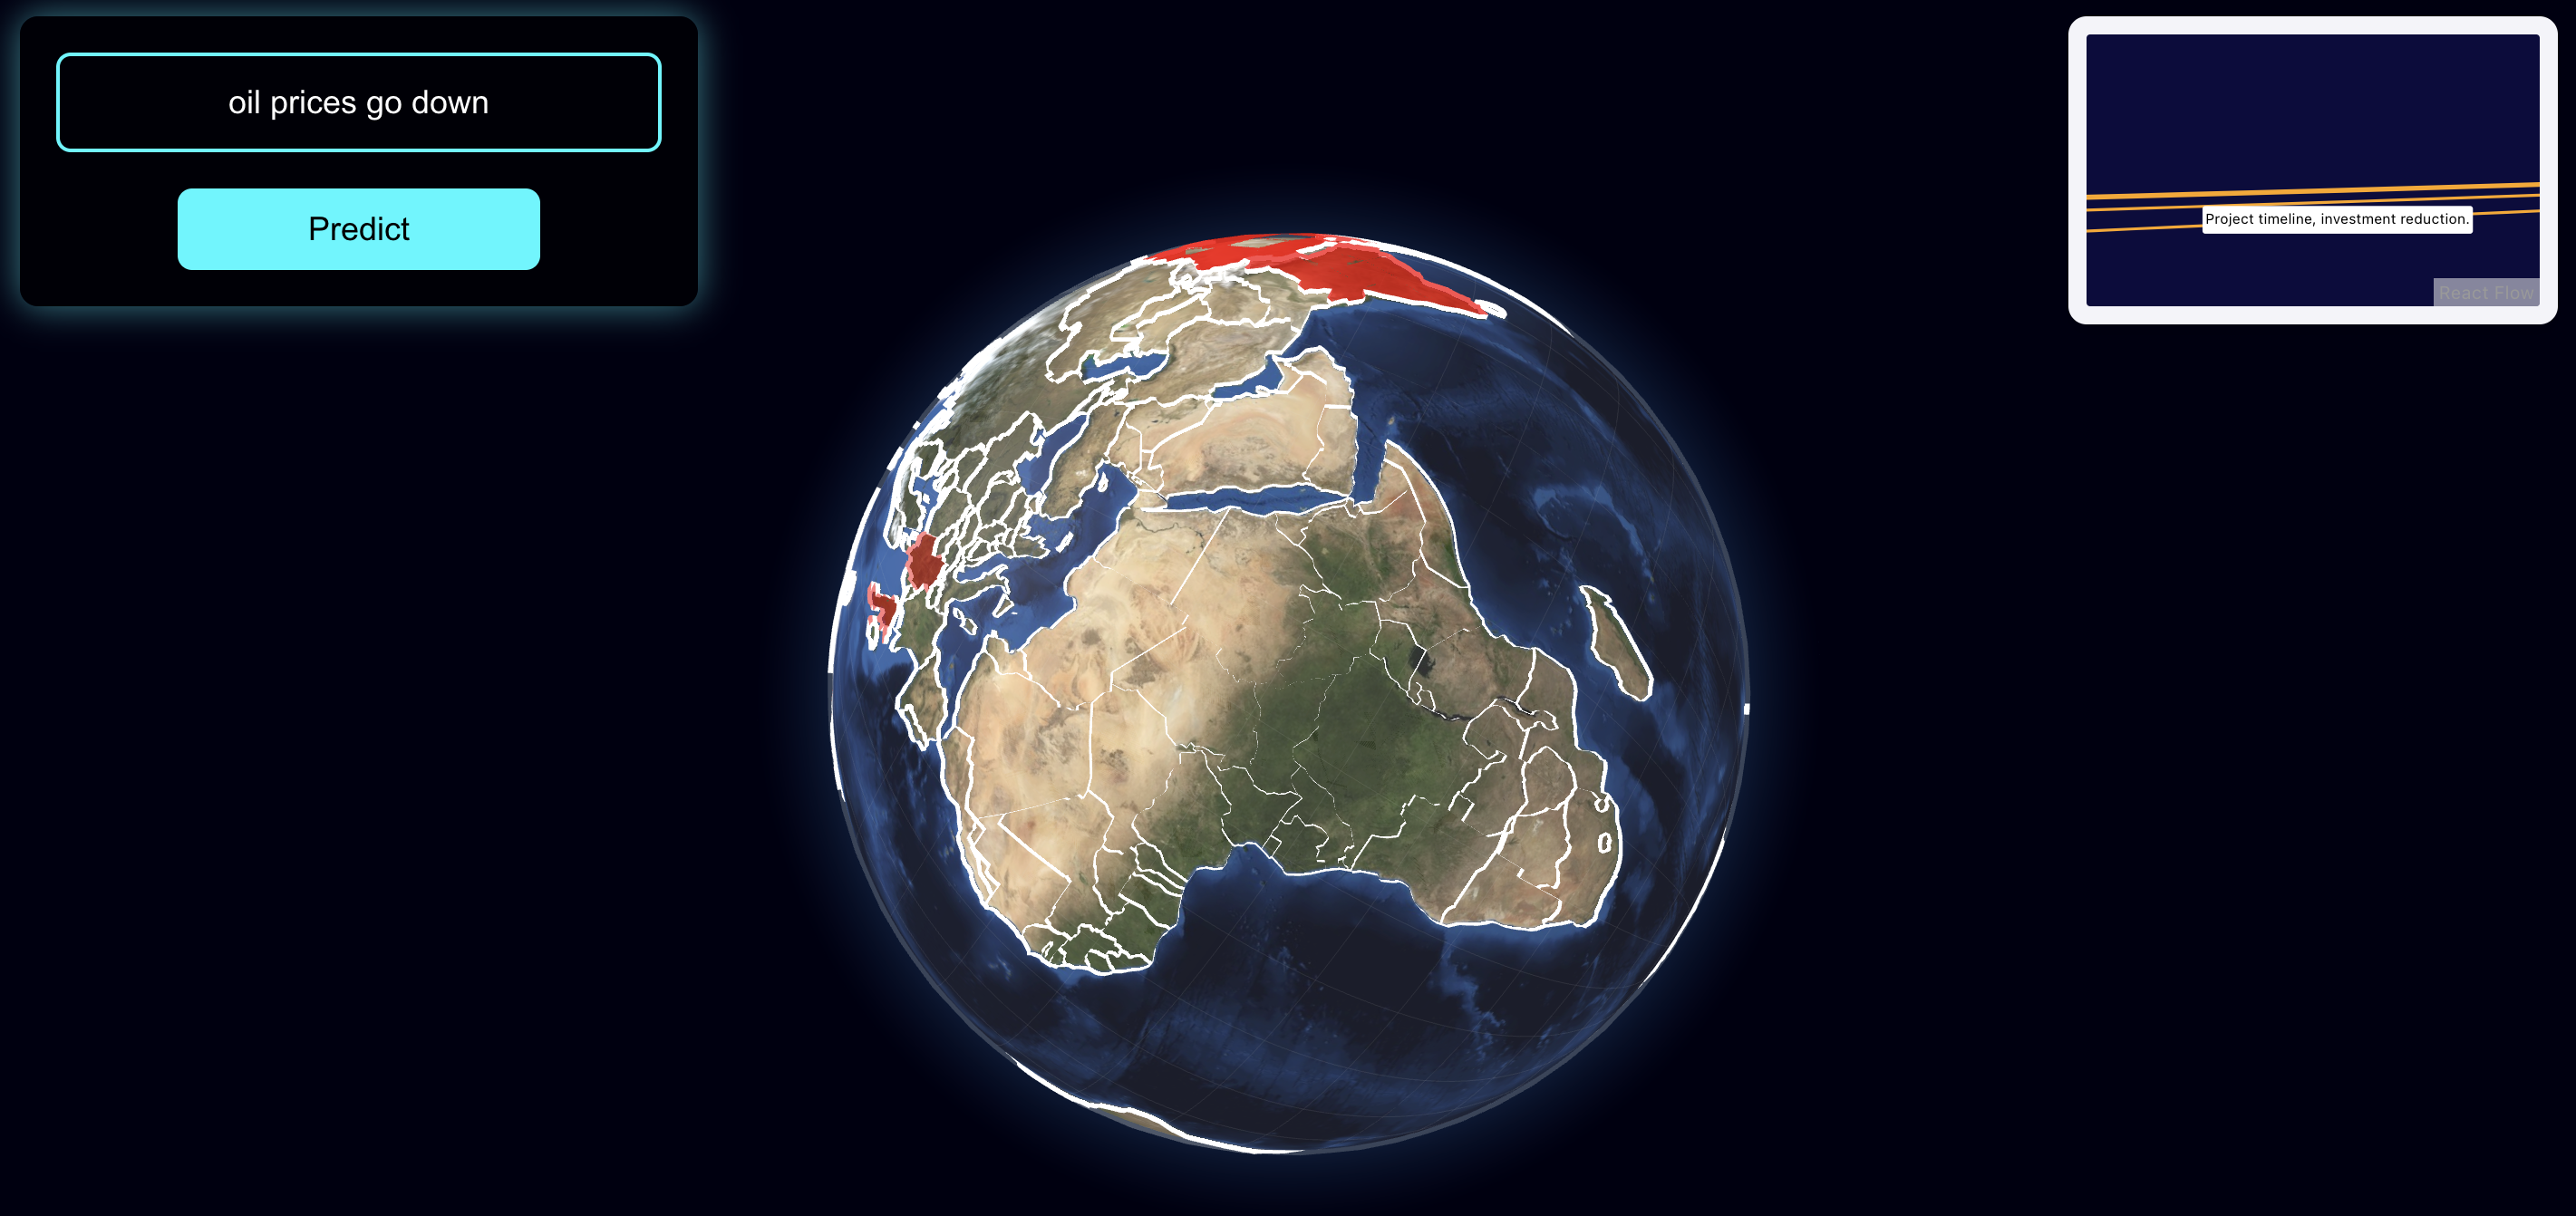
Each node in the graph is connected to multiple other nodes, creating a complex web of relationships. When a user inputs a hypothetical news event, OracleNet identifies the relevant target node. From there, it evaluates which connected nodes are most pertinent to the financial insights and impacts of that event. Using a breadth-first search (BFS) approach, and Graph Theory concepts: OracleNet traverses through the closest connected nodes, identifying the ripple effects across the network. The result is a detailed visualization showing the affected nodes, countries impacted globally, and an in-depth explanation of how the news event will influence the world.
How we built it
To train our model, we aimed to push the limits on how much data we could analyze. We sourced data from various global news databases and curated a dataset containing over 3 million nodes, each representing individual assets, financial events, or other market-related information. To process and map this vast dataset, we utilized PyTorch Geometric, which is optimized for large-scale graph data and training GNNs (Graph Neural Networks). The model utilizes residual connections, batch normalization, and global pooling to produce robust node embeddings before ultimately predicting a potential market crash (binary classification).
For training, we utilized the H100 GPU to accelerate the model’s learning, in addition to inference utilizing nvCOMP for data compression, taking full advantage of its processing power. The GNN model, which combines Graph Attention Networks (GAT) and Graph Convolutional Networks (GCN), was implemented to learn the intricate relationships between assets and events. We used the GAT component to prioritize relevant nodes based on attention weights, while GCN layers were used to propagate information across the graph.
Once the graph was created, we employed a graph traversal algorithm combined with a weighted loss function to identify the most relevant nodes for market predictions. This process helped us focus on the nodes with the highest influence on market crashes.
Additionally, we leveraged a large language model (LLM) to analyze the textual data associated with the nodes, extracting insights into financial trends and global market impacts. This allowed us to enhance the prediction power by integrating both numerical and textual information. Finally, the model’s outputs were visualized in an interactive dashboard, which provided a global view of the most relevant nodes, their relationships, and a summary of their impacts on the market.
Challenges We Ran Into
The scale of this project was far beyond anything we had attempted before. Our ambitious goals and desired outcomes initially seemed nearly impossible to achieve. As we progressed, the challenges became even more demanding. One of our biggest hurdles was handling the massive amount of data we wanted to process. We had to develop efficient parallel processing techniques to manage and analyze this data at scale. Another major challenge was determining how to prioritize information—each node in our graph was connected to hundreds of others, and we needed a way to decide which connections were most relevant for users. This required designing relevance scores and optimizing graph traversal strategies to extract meaningful insights. After spending countless hours refining these algorithms, we faced our next major challenge: implementing Graph Attention Networks (GAT) and Graph Convolutional Networks (GCN)—both of which we had limited prior experience with. Despite the difficulties, tackling these challenges head-on pushed us to learn and innovate, ultimately helping us build a system capable of handling the complexity of our data.
Why use a GNN you may ask? Financial markets are naturally represented as graphs—where nodes can be companies or assets, and edges can represent correlations, supply chains, or transactional relationships. Traditional models often treat these inputs as unstructured data, losing the rich relationship signals. By using a GNN, we leverage these connections to learn context-aware embeddings that better reflect market dynamics.
Accomplishments that we're proud of
We entered this hackathon with the goal of pushing the boundaries of what "big data" could truly be. Processing millions of nodes seemed like an unimaginable challenge, but through creative applications of GPUs and distributed parallel computing strategies, we were able to integrate vast amounts of data in a timely manner. The depth of learning we gained in the realms of graph theory and graph traversal algorithms is something no other experience could have provided.
We are incredibly proud of the tremendous growth and knowledge we achieved throughout this hackathon. Additionally, we take great pride in the creative visualization methods we developed and how seamlessly the frontend came together. The use of an interactive globe and clean node visualizations stands out as something we're particularly proud of. The advanced techniques we employed and our ability to implement them effectively are major accomplishments. We also worked extensively with Graph Attention Networks (GAT) and Graph Convolutional Networks (GCN), which further enhanced our understanding of cutting-edge graph-based learning.
What we learned
For all of us on the team, this was our first time working on a graph-related project. The complexity and scale of the graphs challenged us to dive deep into graph theory. We explored concepts like knowledge graphs, honed our skills in graph traversal algorithms, and developed several custom algorithms for efficient graph processing. Additionally, this was our first attempt at building a Graph Neural Network (GNN). Although we had prior experience implementing various other types of networks, this was a new and exciting frontier for us, and we learned a lot through the process.
What's next for OracleNet
OracleNet's strength lies in its ability to process vast amounts of data. Throughout our journey, we have successfully delivered impactful visualizations, crafted a cohesive narrative, and provided detailed financial insights. To further enhance the project, our next step is to continue expanding the dataset and improving the efficiency of our model. However, due to time constraints, we were unable to conduct extensive empirical testing of our model. Moving forward, we aim to fine-tune the model to improve the accuracy of its historical predictions. This will involve training the model on data up to a certain point, say 2020, and then introducing known events with their actual impacts. By incorporating these known outcomes, we can adjust the model to better predict future trends with greater precision.

Log in or sign up for Devpost to join the conversation.