-
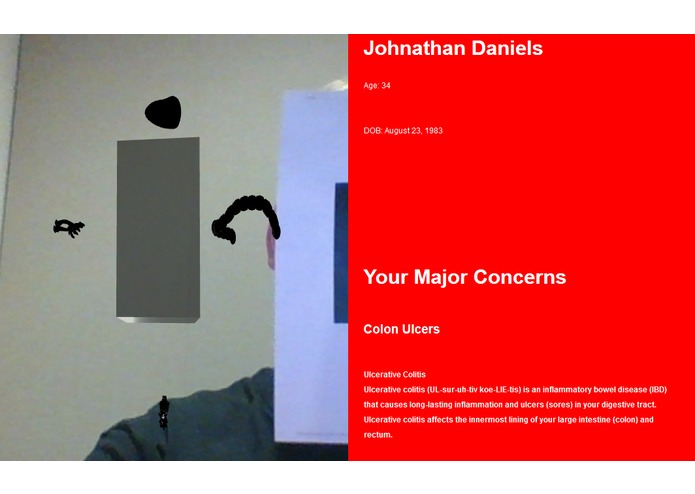
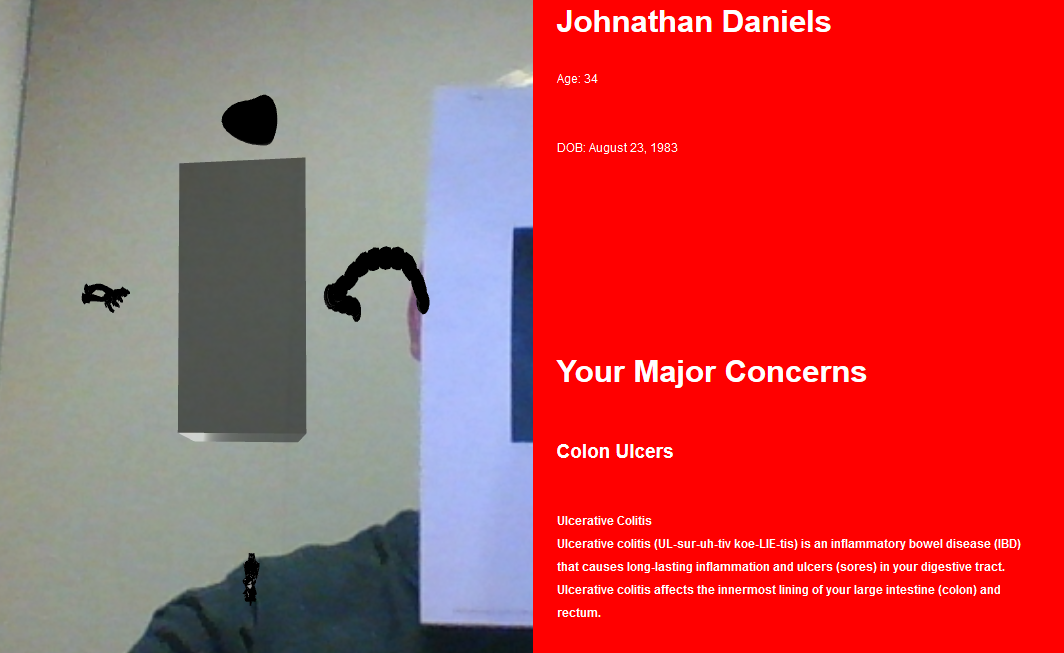
Screen Cap of the site in action.
-

Neccesary glyph to render

Inspiration
Data Visualization lends itself to a better understanding of the problems at hand. When presented with a database of genomic markers for genetic diseases and predispositions to problems, it made sense to create an AR experience that would elevate the patient's understanding of their condition.
What it does
Takes in data though a known disease database and then compares the data against your genome.
How I built it
The system as of the completion of this hackathon is in two pieces. The data visualization and the data analysis tool. Both function and perform their purpose and with a little bit of extra work, the two can be synthesized into a working visualization of people's genomes.
Challenges I ran into
AR.JS, being a new technology, lacked the documentation to allow for the rapid prototyping. As such lots of time was lost trying to find the needed dependencies to get it functioning.
Accomplishments that I'm proud of
I successfully implemented AR.JS and managed to compare a person's large genome database against the disease database in a short amount of time.
What's next for GnomeViz
Synthesizing both the data analysis and visualization into one who unit. Adding data base support to expand upon the disease checking algorithms.
Follow our repo for updates on the project!
Built With
- a-frame
- ar.js
- python
Log in or sign up for Devpost to join the conversation.