-
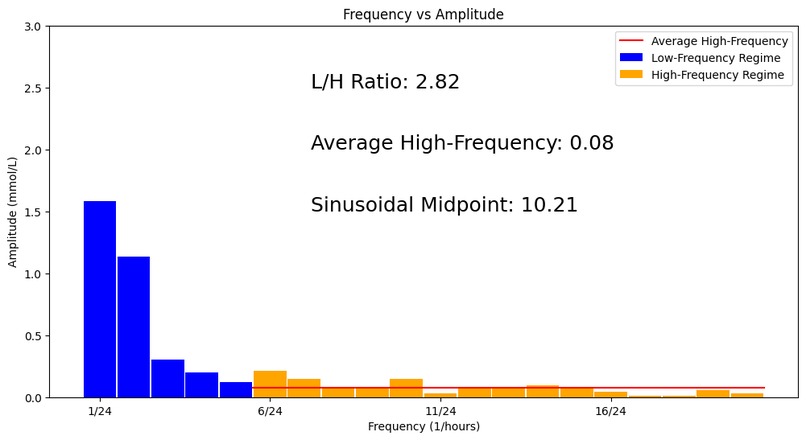
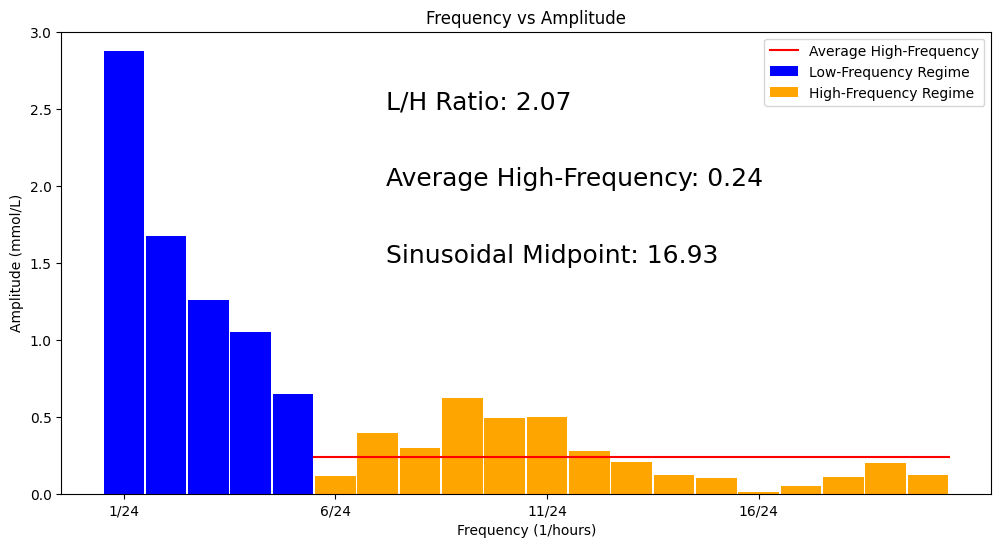
Frequency vs amplitude histogram for the month 2024-08
-

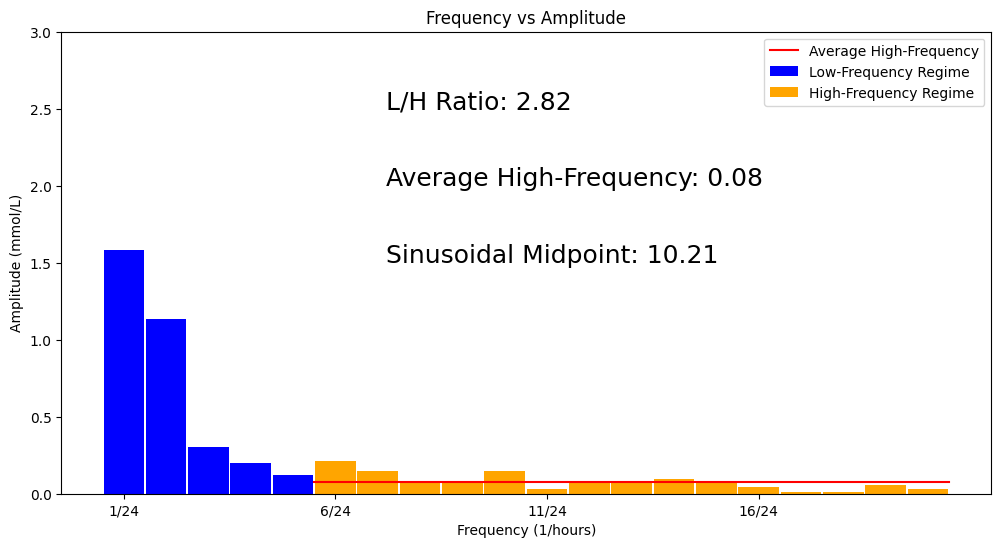
Frequency vs amplitude histogram for the month 2022-08
-

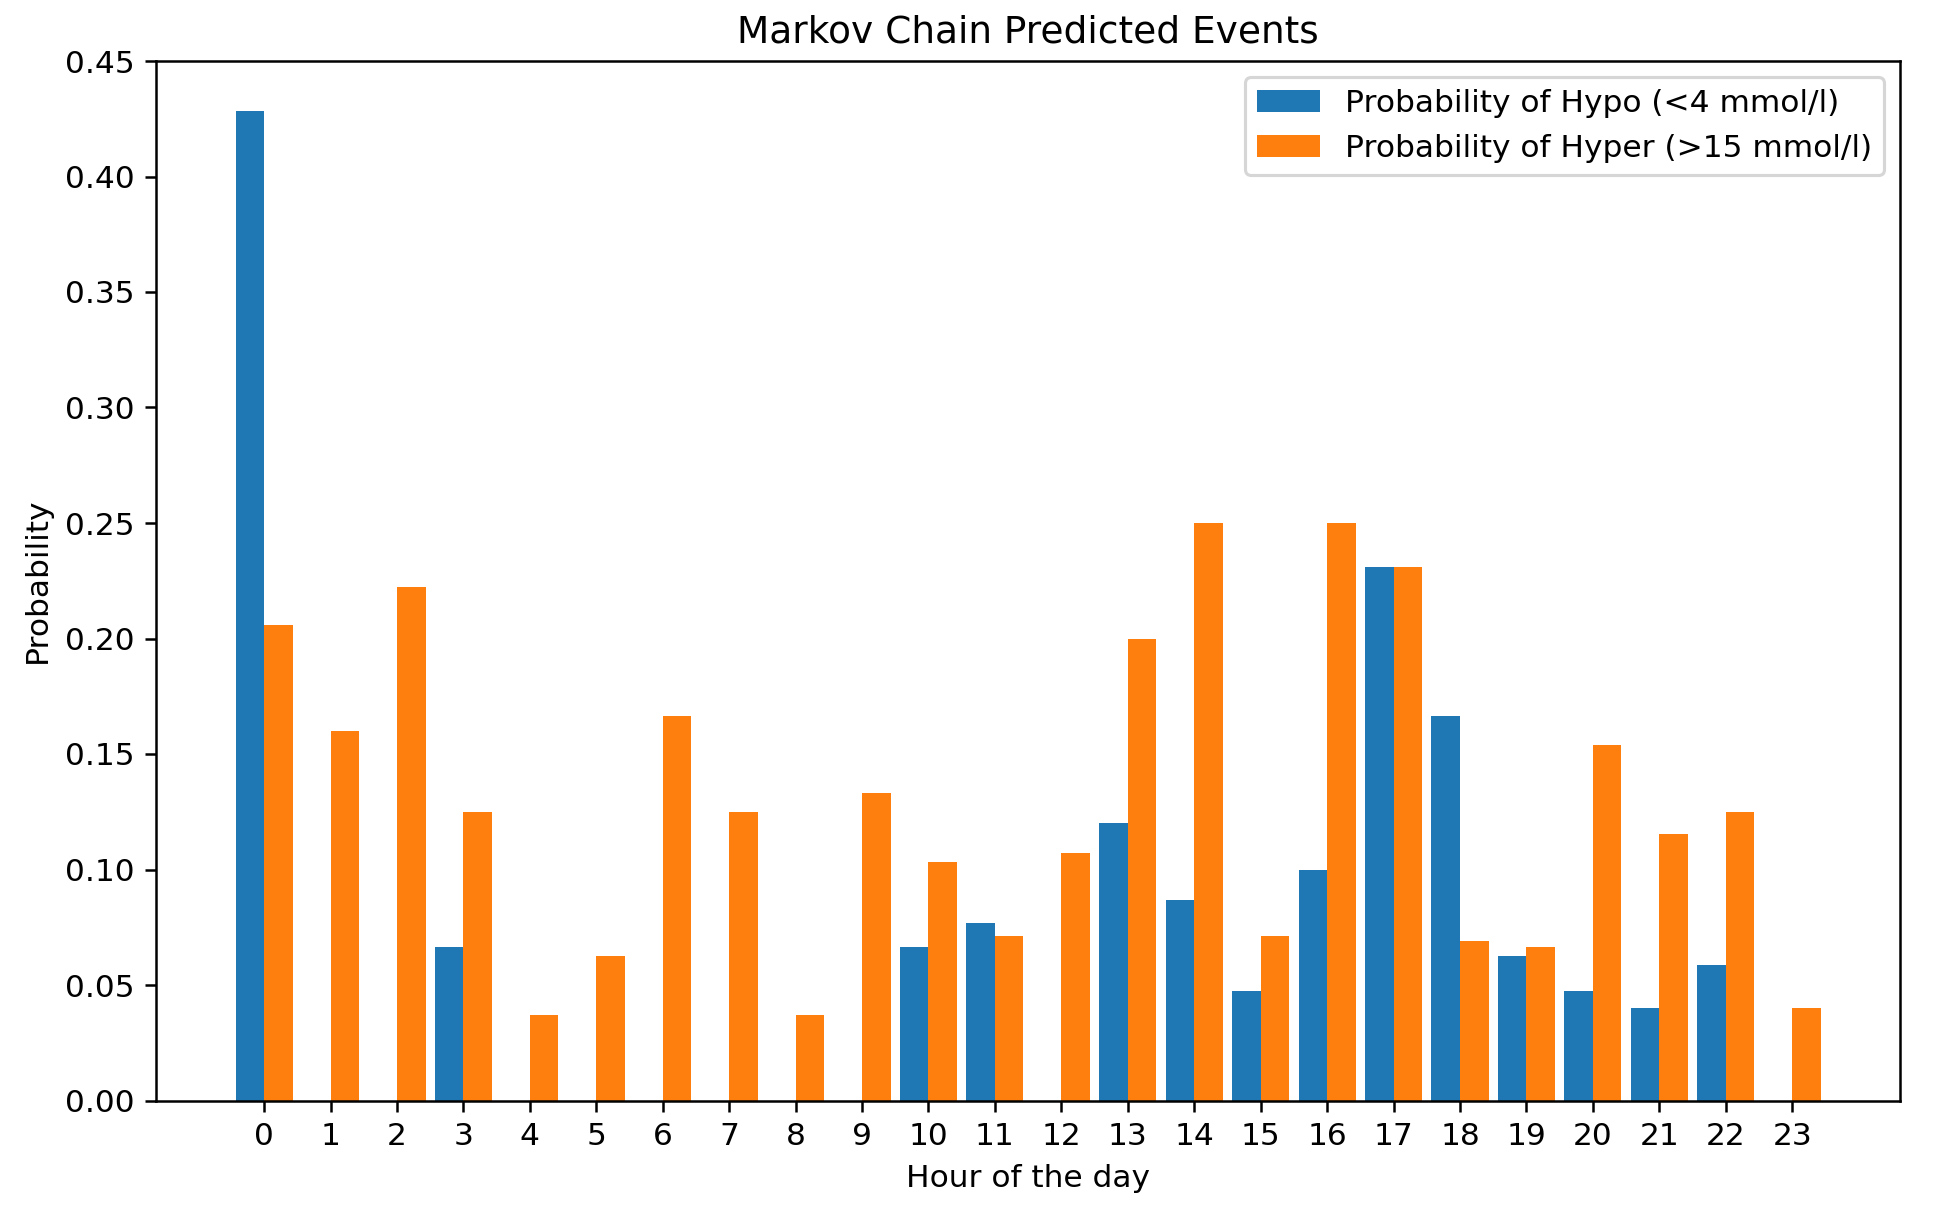
Markov chain histogram displaying probability of a hypo (blue) or hyper (orange) for different times of the day based on past trends
-
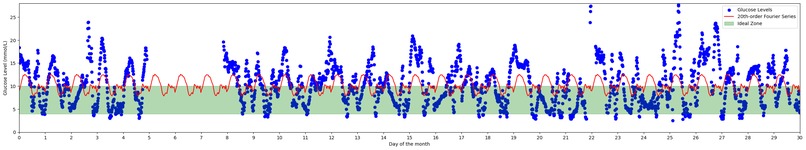
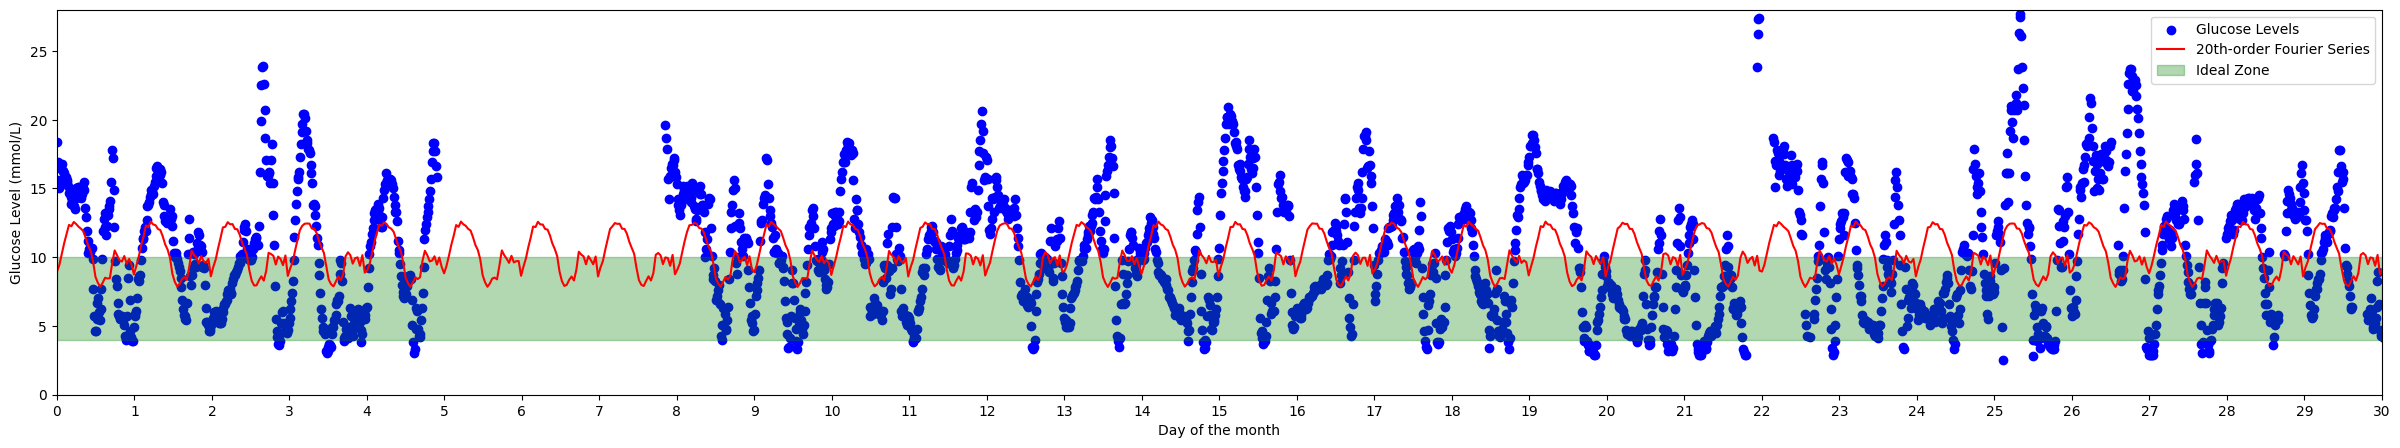
Overall plot displaying blood glucose levels over time for the month 2024-08
-
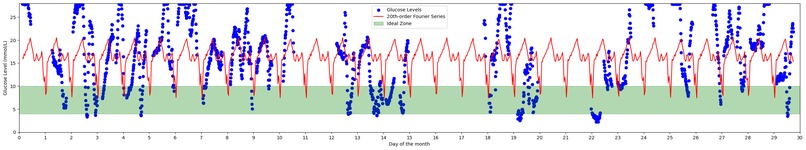
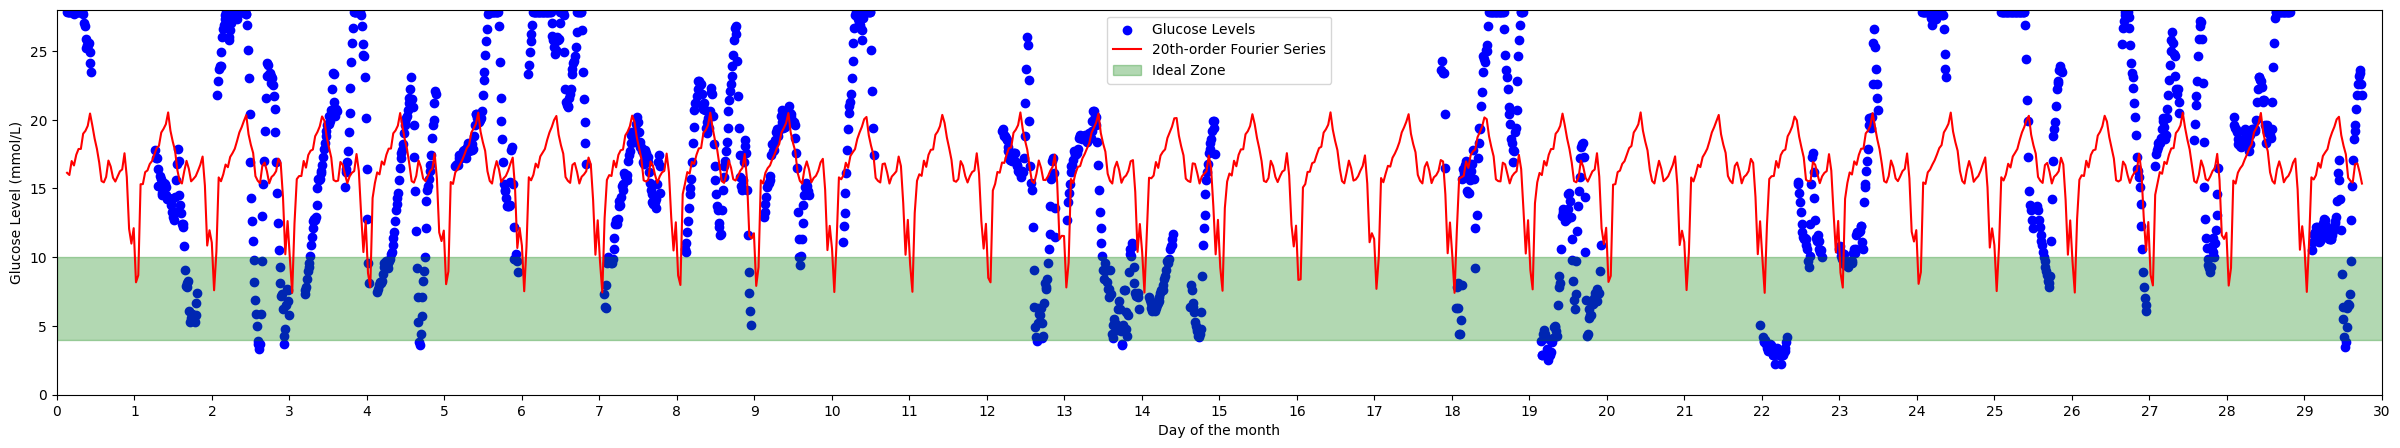
Overall plot displaying blood glucose levels over time for the month 2022-08
Inspiration
Many people, including one of our teammates, have type 1 diabetes and sometimes individuals can struggle understanding their blood glucose trends and knowing how to improve.
What it does
Our algorithm takes blood glucose data from a Libra sensor. Fitting a Fourier series to historic data using machine learning in order to extract specific frequencies in its trends corresponding to different types of flucuations throughout the day. This was then used to produce values that can be compared to quantify the effective control over the condition. Using Markov chains, a secondary predictive model was developed that can calculate the probabilities of extreme blood sugar events based on previous trends.
How we built it
We started by importing the .csv file and then converting it into a workable form with dates, time and blood glucose values. A Fourier series was then fitted to the data using a machine learning algorithm. This produced a periodic function that would model fluctuations of blood glucose as a sum of sinusoidal waves. The coefficients of these waves were extracted, and these values were then sorted into two data types: high frequency coefficients (produced as a result of sudden spikes in blood glucose) and low frequency coefficients (due to background levels and more general, long-term trends). From this, the code produces histograms providing the user with a L/H ratio (the higher the value, the better the blood glucose management as it is dominated by more stable terms). Other values were also calculated including the mean of both the high and low frequencies (Lower being better for control as it corresponds to low volatility). This was then plotted for two different months corresponding to one of poor management and one of relatively good management. Using a different Markov chain model, a histogram was also produced providing the user with predictions on when hypoglycaemia or hyperglycaemia may occur throughout the day based on previous events.
Challenges we ran into
Trying to get a Fourier series to work with a linear regression model, implementing machine learning models, data visualisation.
Accomplishments that we're proud of
We managed to produce graphs that show overall trends using real blood glucose data as well as histograms that can provide quantitative insights. We're proud that our project could form the basis of a larger endeavour to help diabetic individuals improve their health and improve society as a whole.
What we learned
We greatly improved our knowledge of Python machine learning, particularly the library scikit-learn.
What's next for GlucoGuide - An algorithmic approach to visualising diabetes
At the moment, our project is highly quantitative. The front-end needs development - for example, we could implement the algorithm in the form of an app.


Log in or sign up for Devpost to join the conversation.