Inspiration
We wanted to make global wellbeing data more approachable and intuitive. The OECD dataset is rich but overwhelming, so the goal was to create a simple, interactive way to compare countries, highlight strengths and weaknesses, and spark curiosity about what drives wellbeing worldwide.
What it does
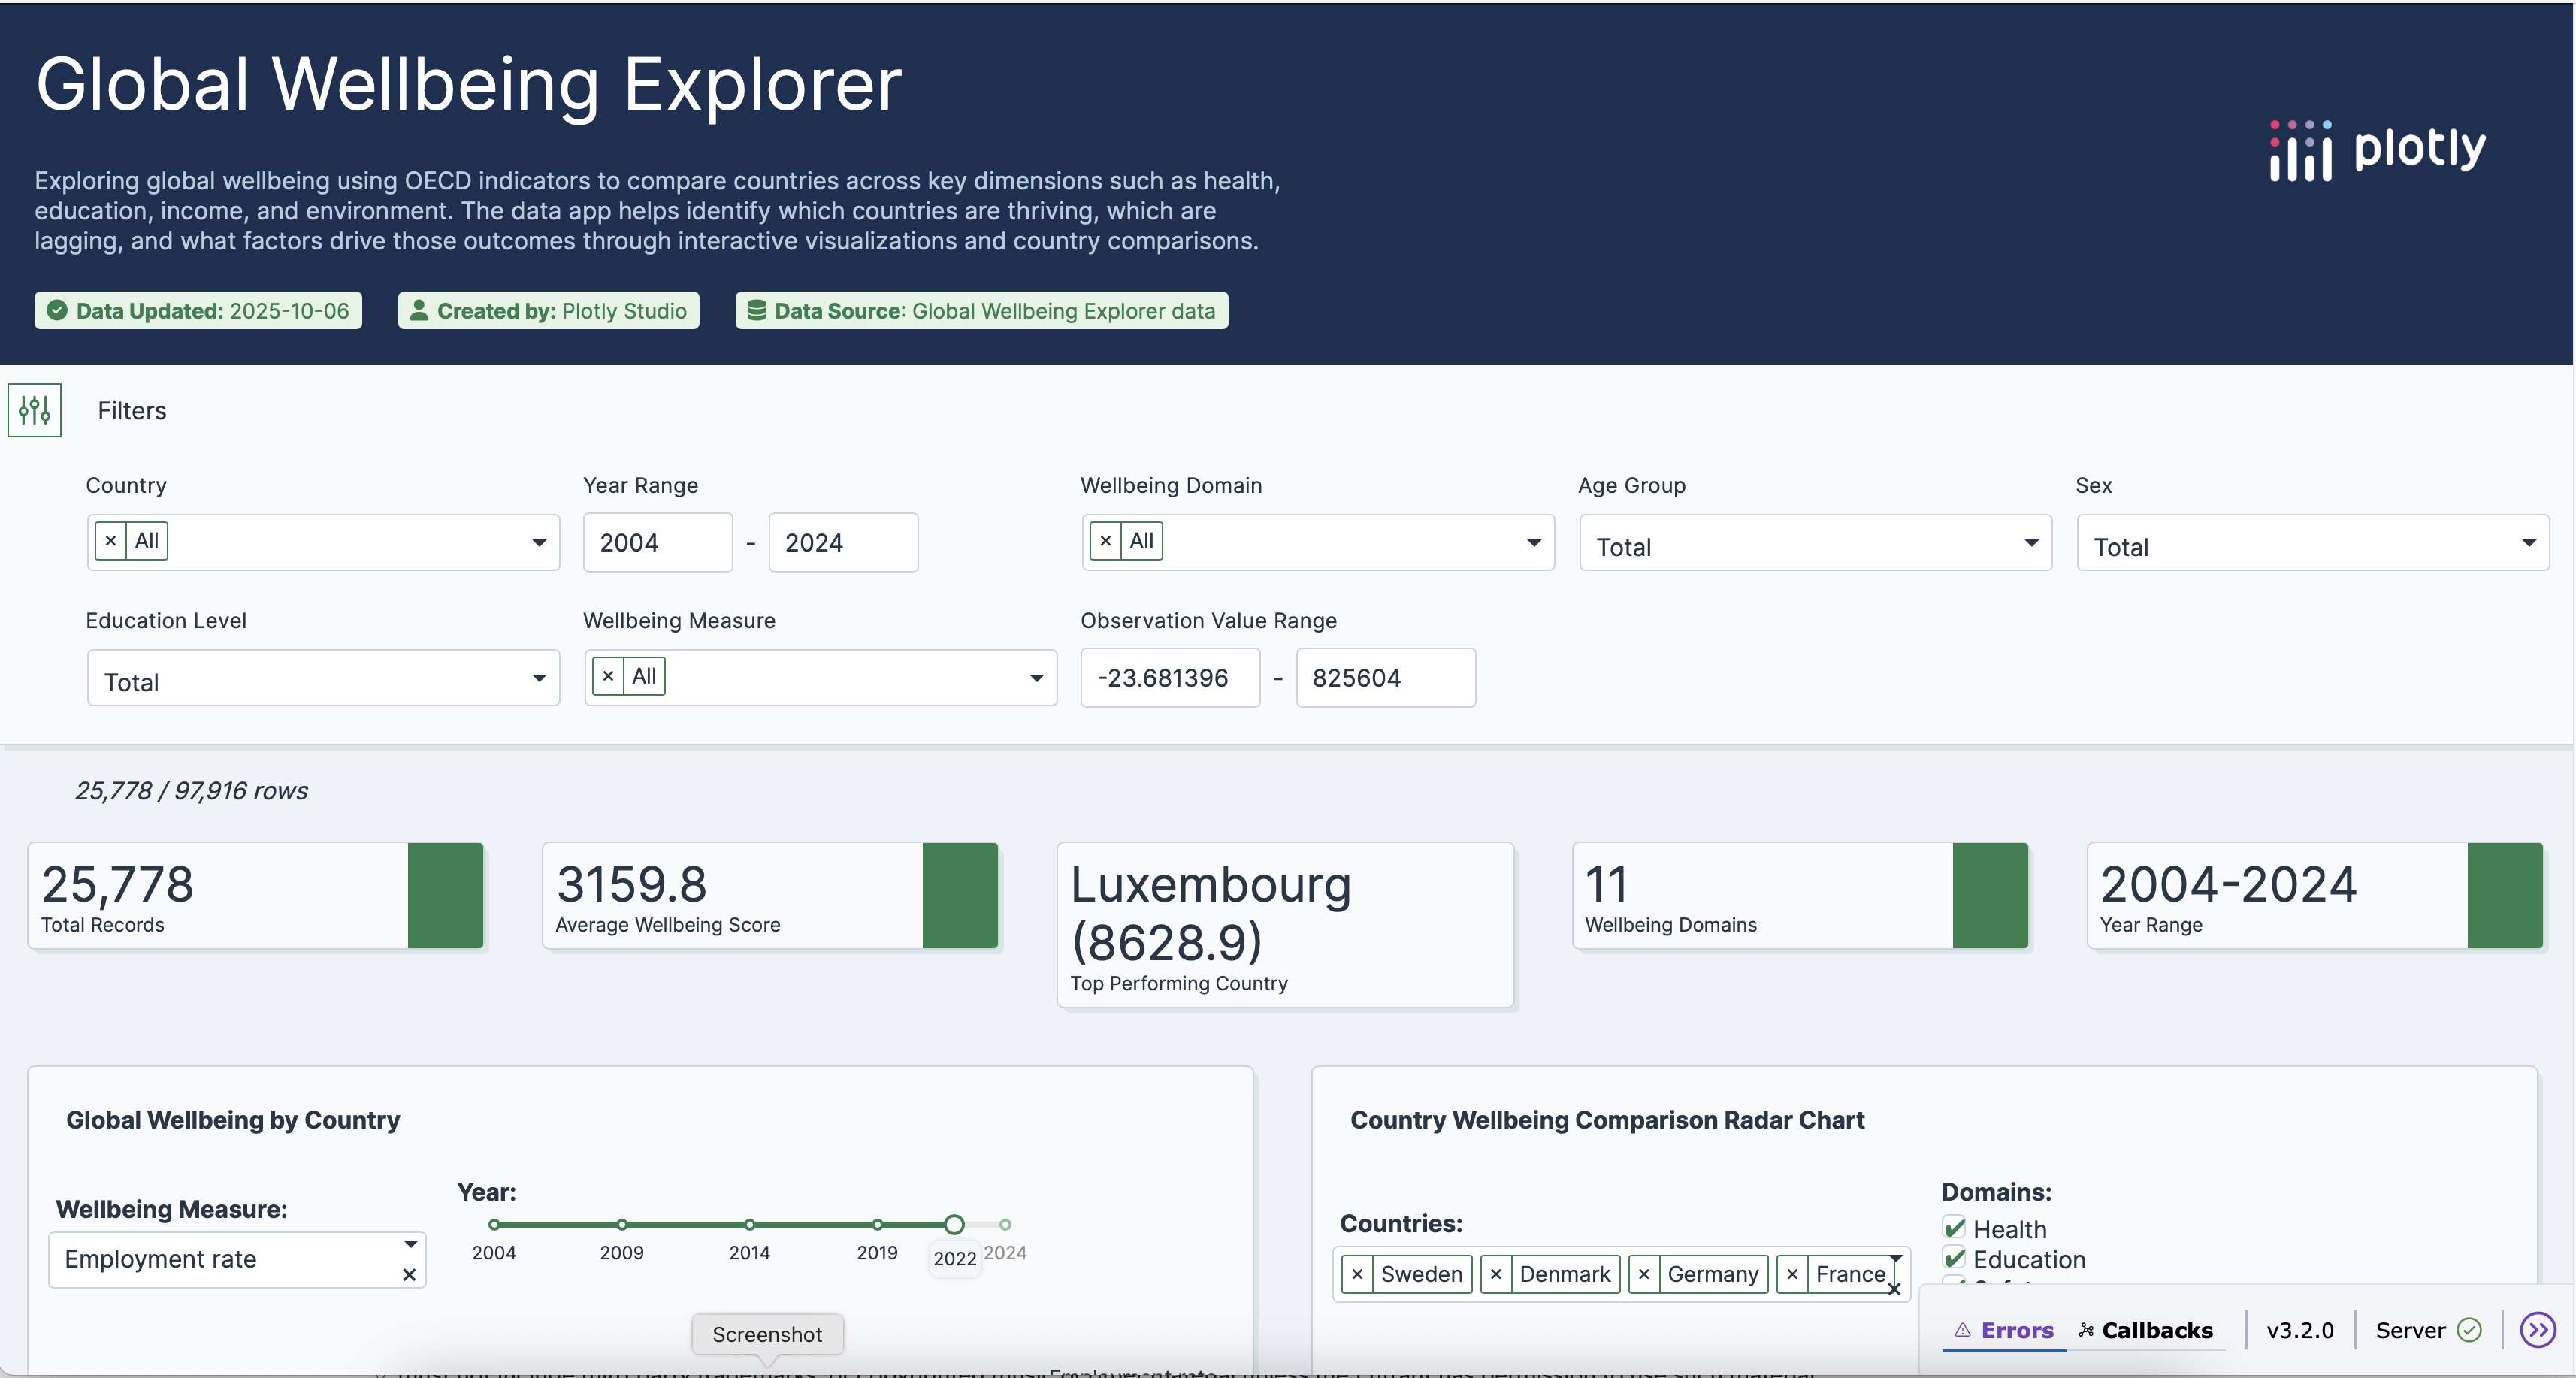
Global Wellbeing Explorer is an interactive dashboard that lets users 1.Compare countries across wellbeing dimensions with a radar chart.
2.Explore global patterns on a choropleth map.
3.Spotlight a single country’s strengths and weaknesses over time.
4.Discover correlations between wellbeing domains.
How I built it
The app was built in Plotly Studio and deployed on Plotly Cloud. I used the pre‑selected OECD wellbeing dataset, configured multiple chart types (radar, choropleth, line, box plot, bar, heatmap), and added global filters for country, year, and domain. The design emphasizes clarity, storytelling, and a clean blue‑green theme to reflect trust and sustainability.
Challenges I ran into
1.Narrowing down wellbeing measures into a set of intuitive views.
2.Ensuring the default state of the app was engaging without overwhelming users.
Accomplishments that I'm proud of
1.Creating a narrative flow: compare → explore globally → spotlight → analyze correlations.
2.Designing a dashboard that feels professional yet approachable for non‑technical audiences.
What I learned
1.How to quickly transform a large dataset into a polished, interactive app using Plotly Studio. 2.The importance of thoughtful defaults and storytelling in data visualization. 3.How small design touches (titles, color scheme, layout) can elevate an app.
What's next for Global Wellbeing Explorer
1.Add more storytelling elements, such as annotations and insights cards. 2.Incorporate additional datasets (e.g., World Bank, UN) for richer context. 3.Enable users to generate shareable “country wellbeing snapshots.” 4.Expand into a public resource for policymakers, educators, and researchers.
Built With
- dash)
- javascript
- plotly-studio
- python-(plotly

Log in or sign up for Devpost to join the conversation.