-
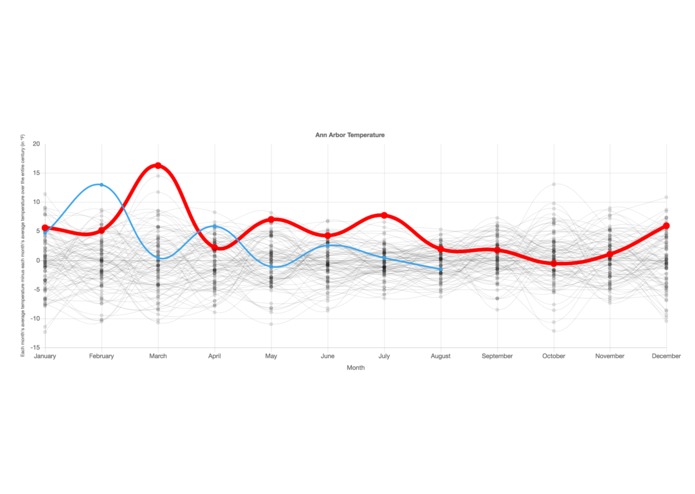
Photo of temperature graph
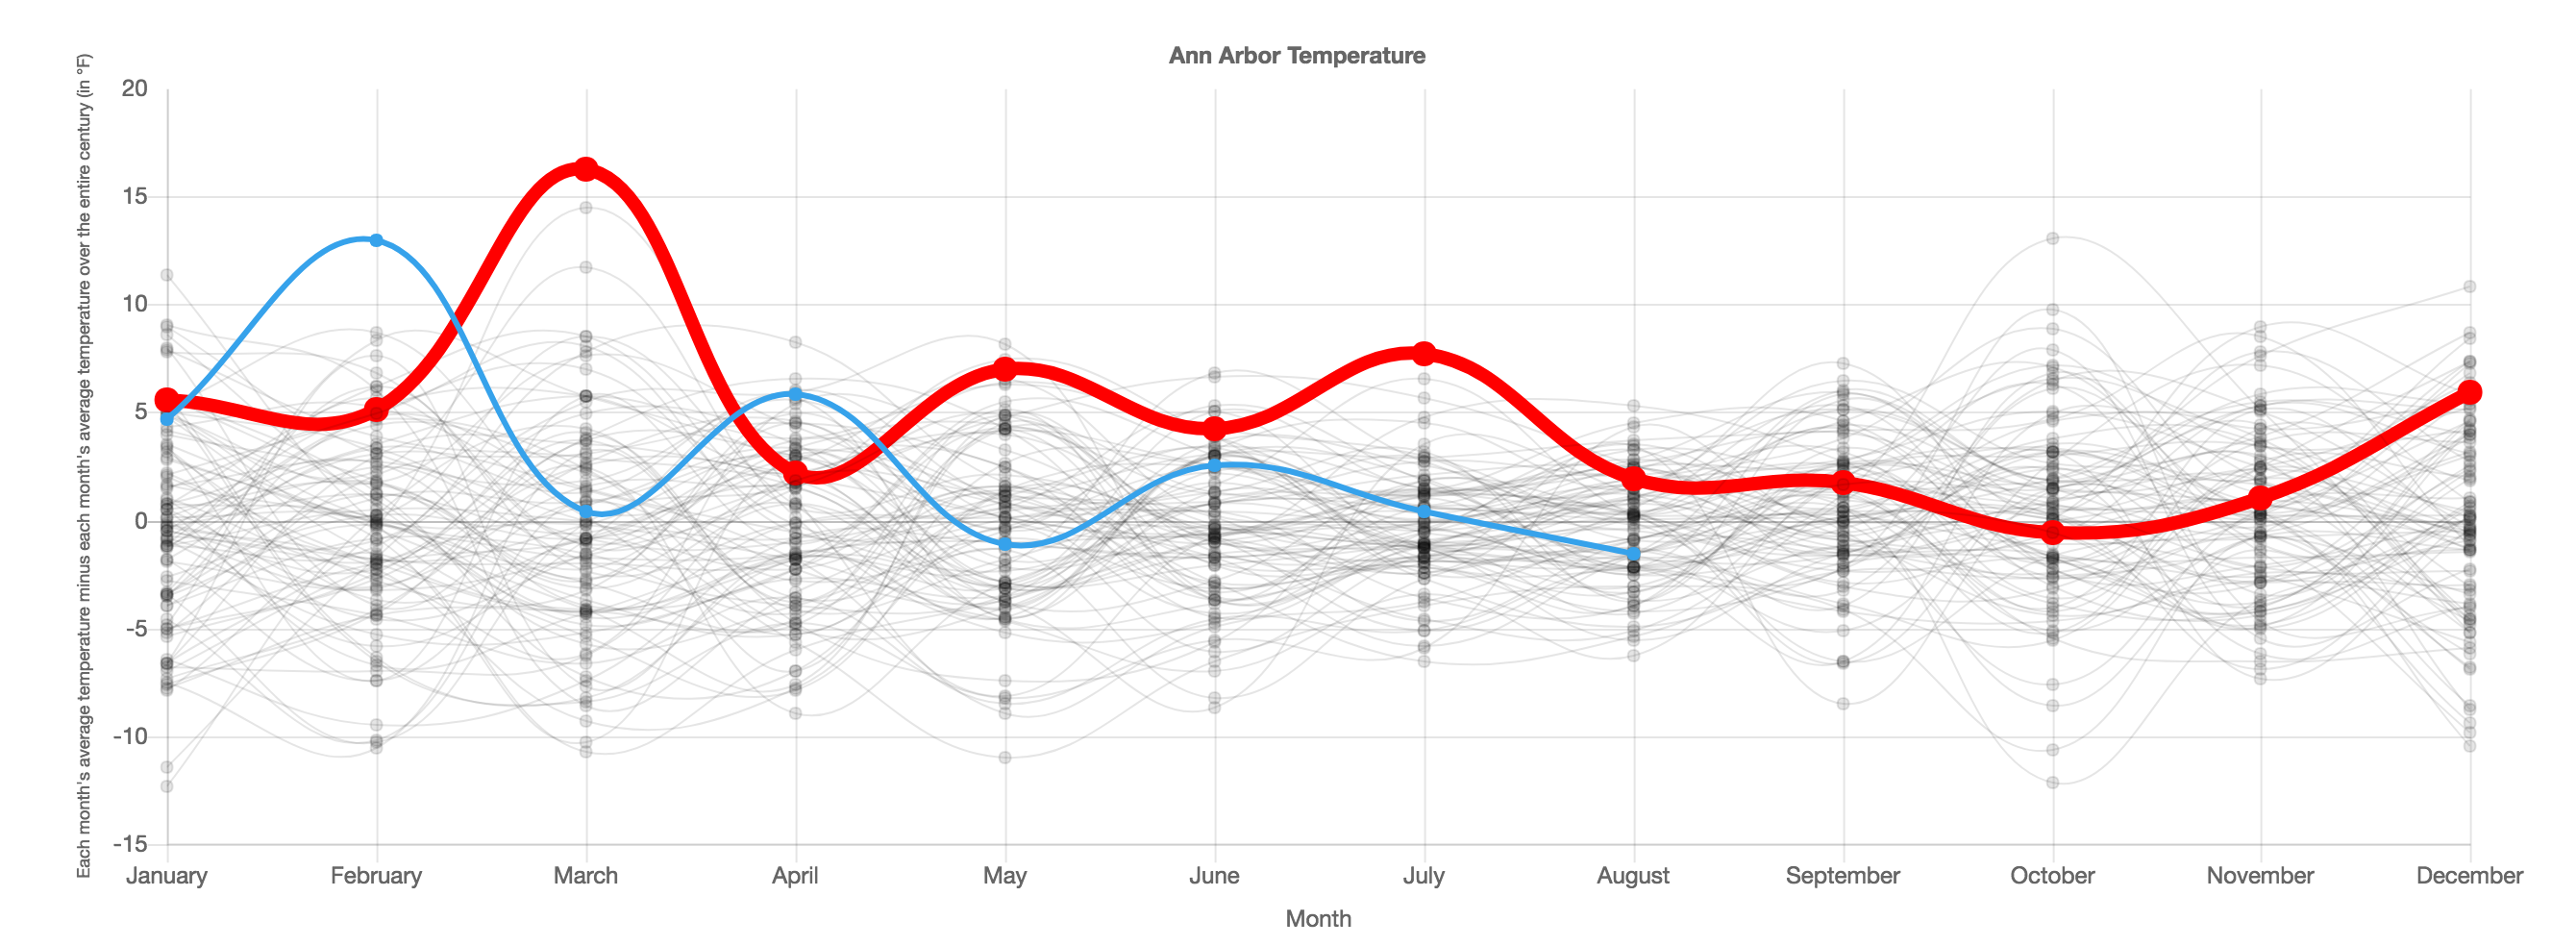
Inspiration
This project was inspired by news articles such as Climate change: How do we know and It’s Not Your Imagination. Summers Are Getting Hotter. Climate change is becoming a big issue. It is difficult to address this issue without first knowing if this issue exists.
What it does
This project displays Ann Arbor, Michigan temperature data from January 1916 to August 2017 in order to address the issue of climate change. The project displays an animated graph. The graph displays each month's average temperature minus each month's average temperature over the entire century (in °F) versus the month. You can use the play, pause, and restart buttons to control the graph. The blue line indicates the most recently added line. The red line corresponds to the year which had the highest average temperature. You can click on years in the legend to remove the corresponding line from the graph.
How I built it
I built the project using HTML5, CSS3, JavaScript, Chart.js, Node.js, and Express.js. The project was managed using GitHub and is currently hosted on Heroku at https://ann-arbor-temperature.herokuapp.com/. The data for the graph was collected from the Climate Data Online website through the National Centers for Environmental Information.
Challenges I ran into
Finding the data was not easy. I visited numerous sites until reaching the Climate Data Online. Once I requested the data, it took a small amount of time for the data to be prepared. However, I pulled through and was able to access and analyze the data.
Accomplishments that I'm proud of
I am most proud of the interactive graph. The graph is done using JavaScript and is not a recorded video or gif. The graph has transition animation between each year and clearly indicates the hottest year.
What I learned
I learned how to search and retrieve data from online websites. Also, I learned more about the features offered in Chart.js.
What's next for Global Warming - Temperature Analysis
The project will continue to help people understand climate change and move society towards a better tomorrow.


Log in or sign up for Devpost to join the conversation.