-
-
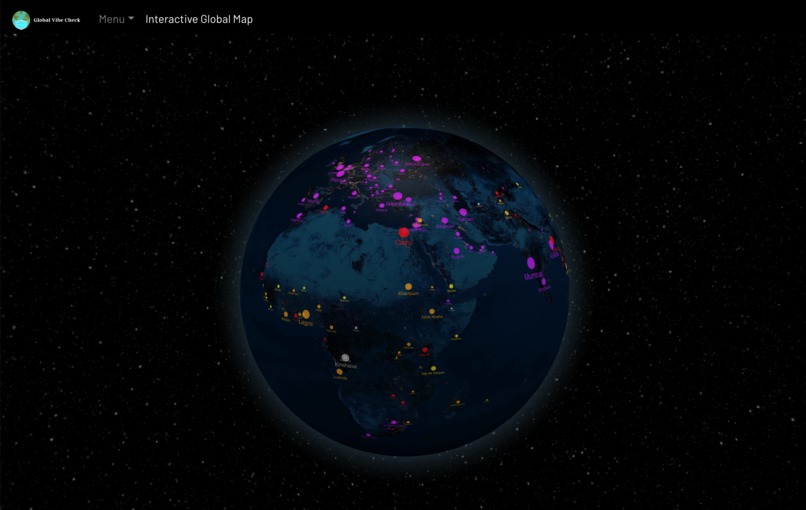
Check out the vibes of the world!
-
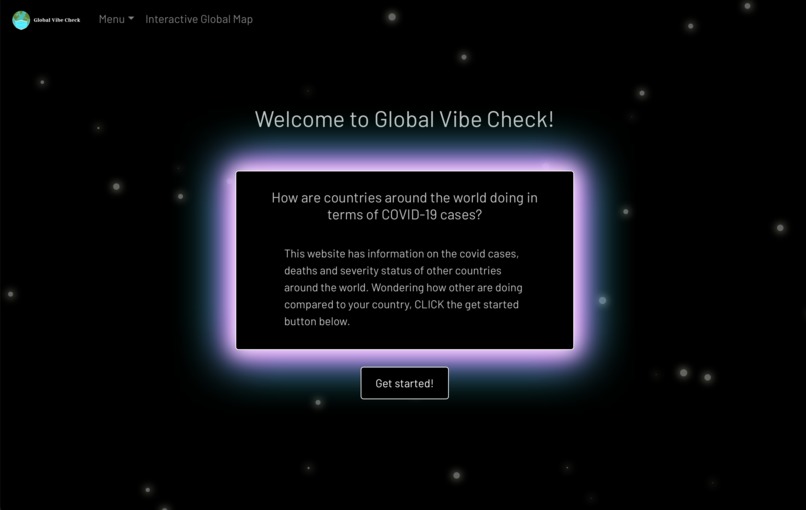
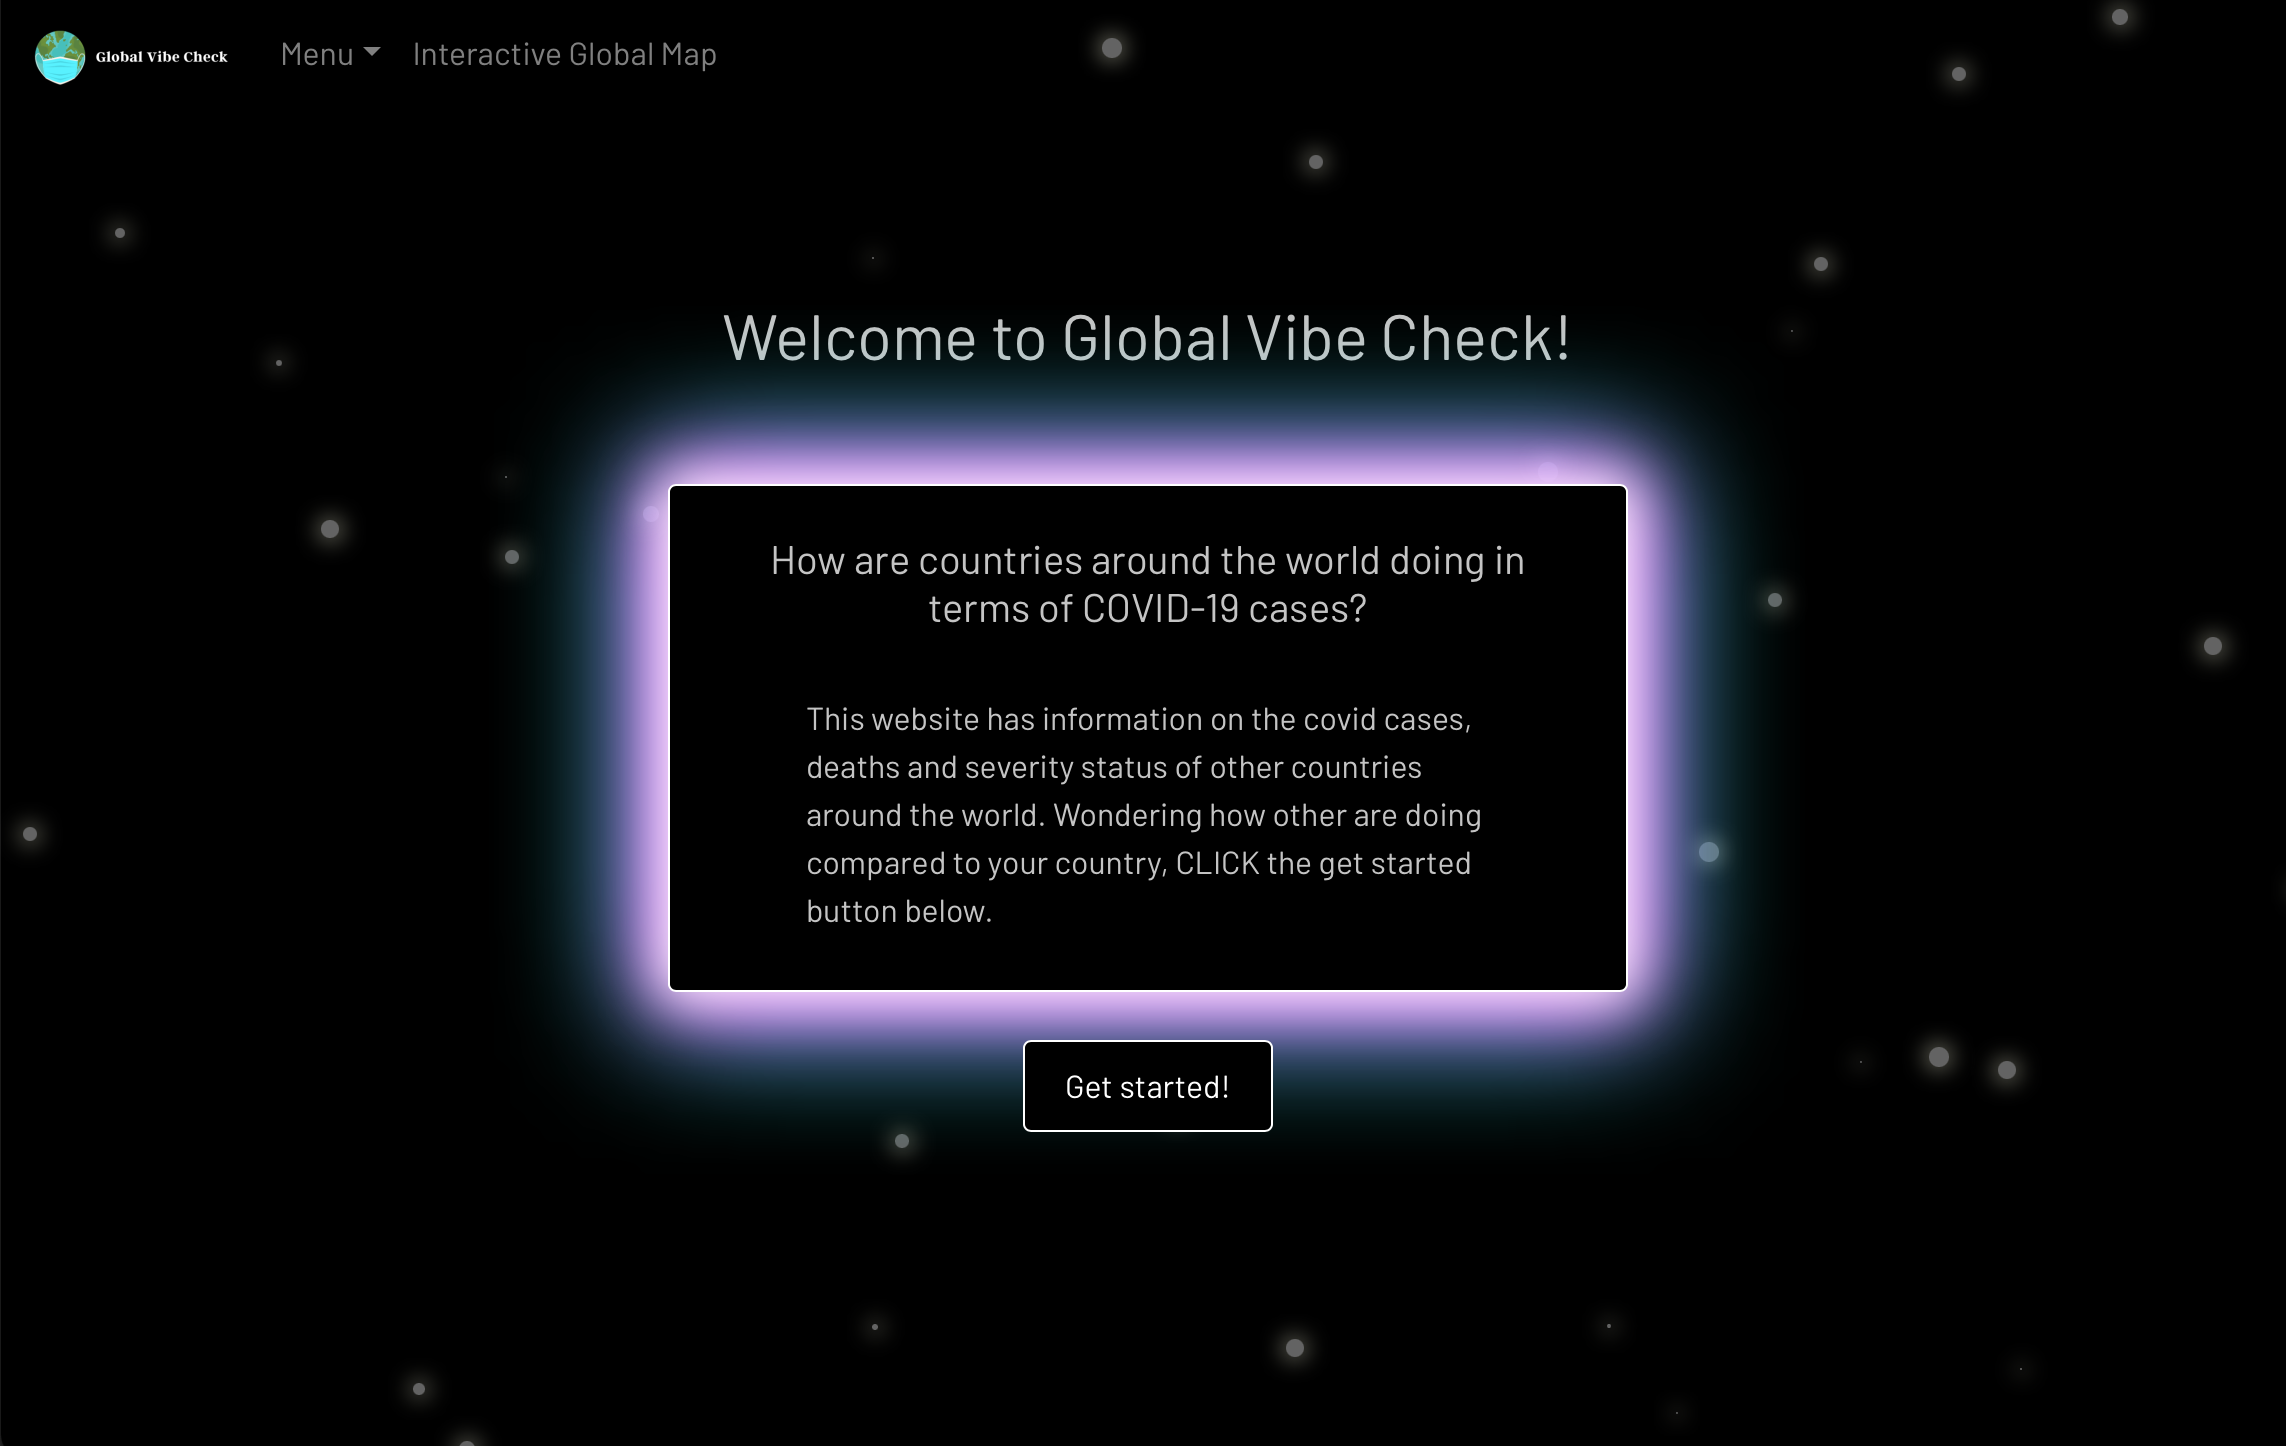
Our landing page
-
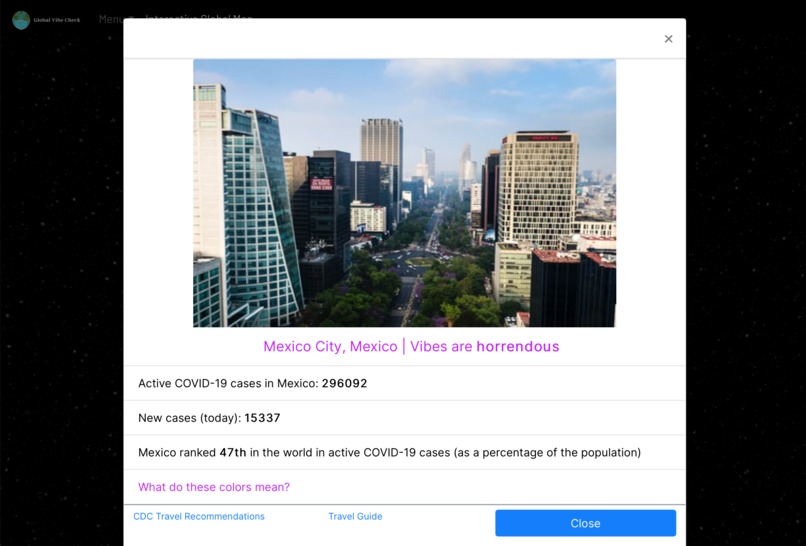
How are the vibes in Mexico City?
-

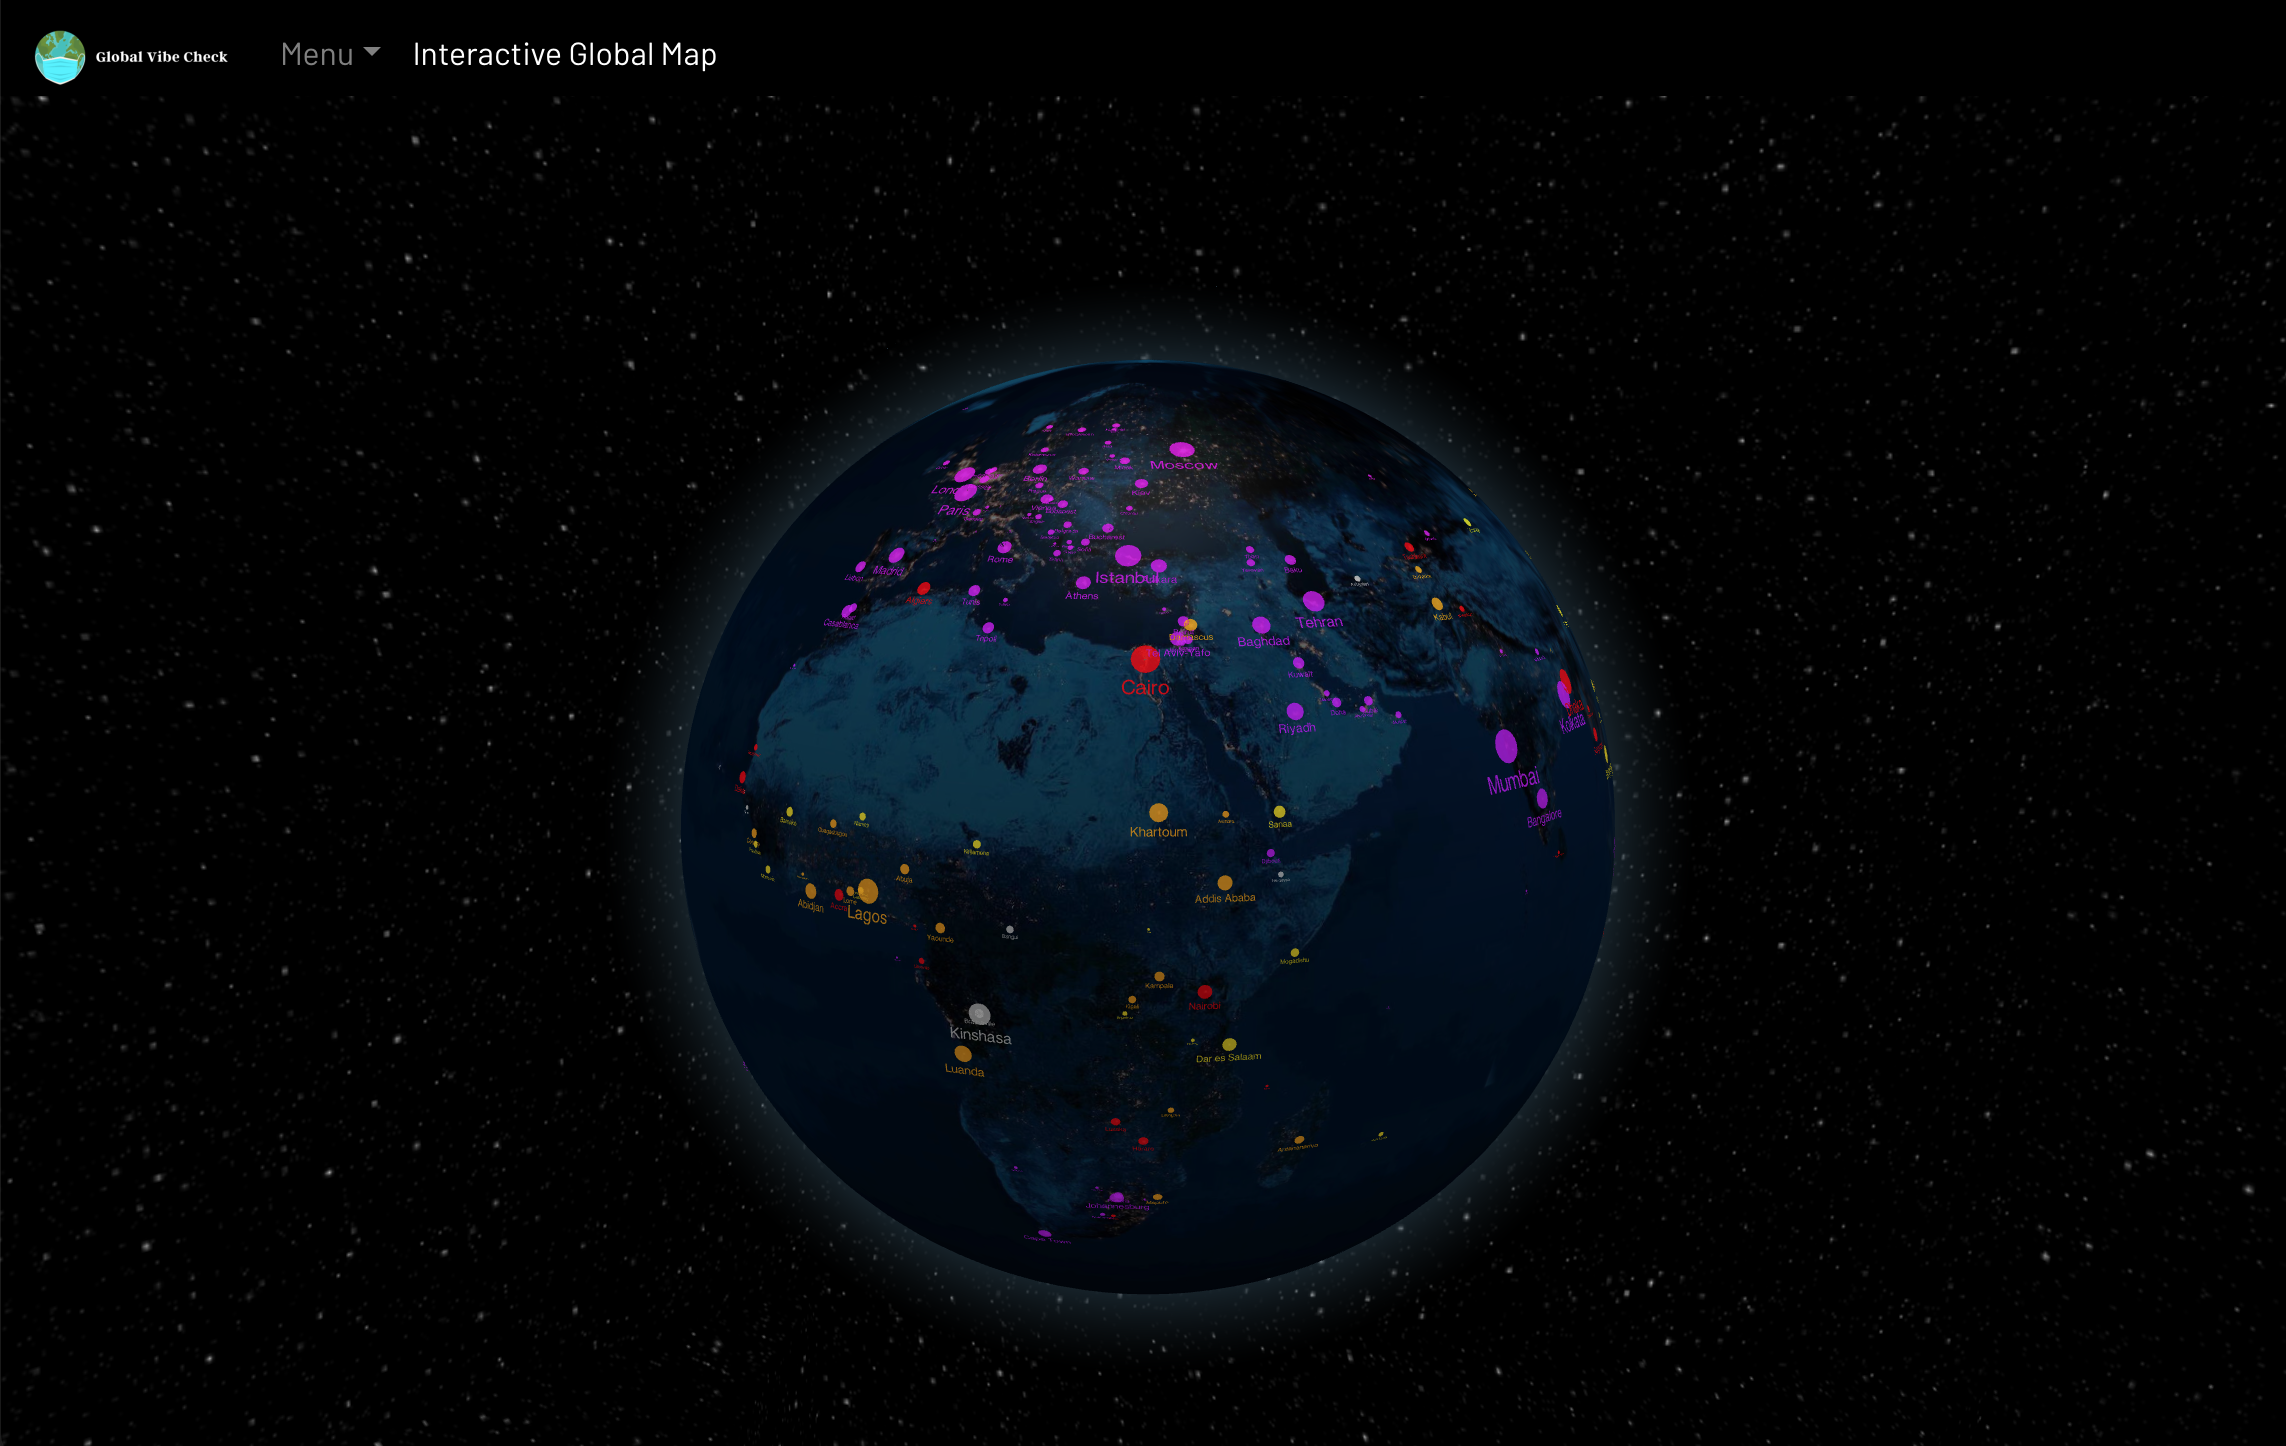
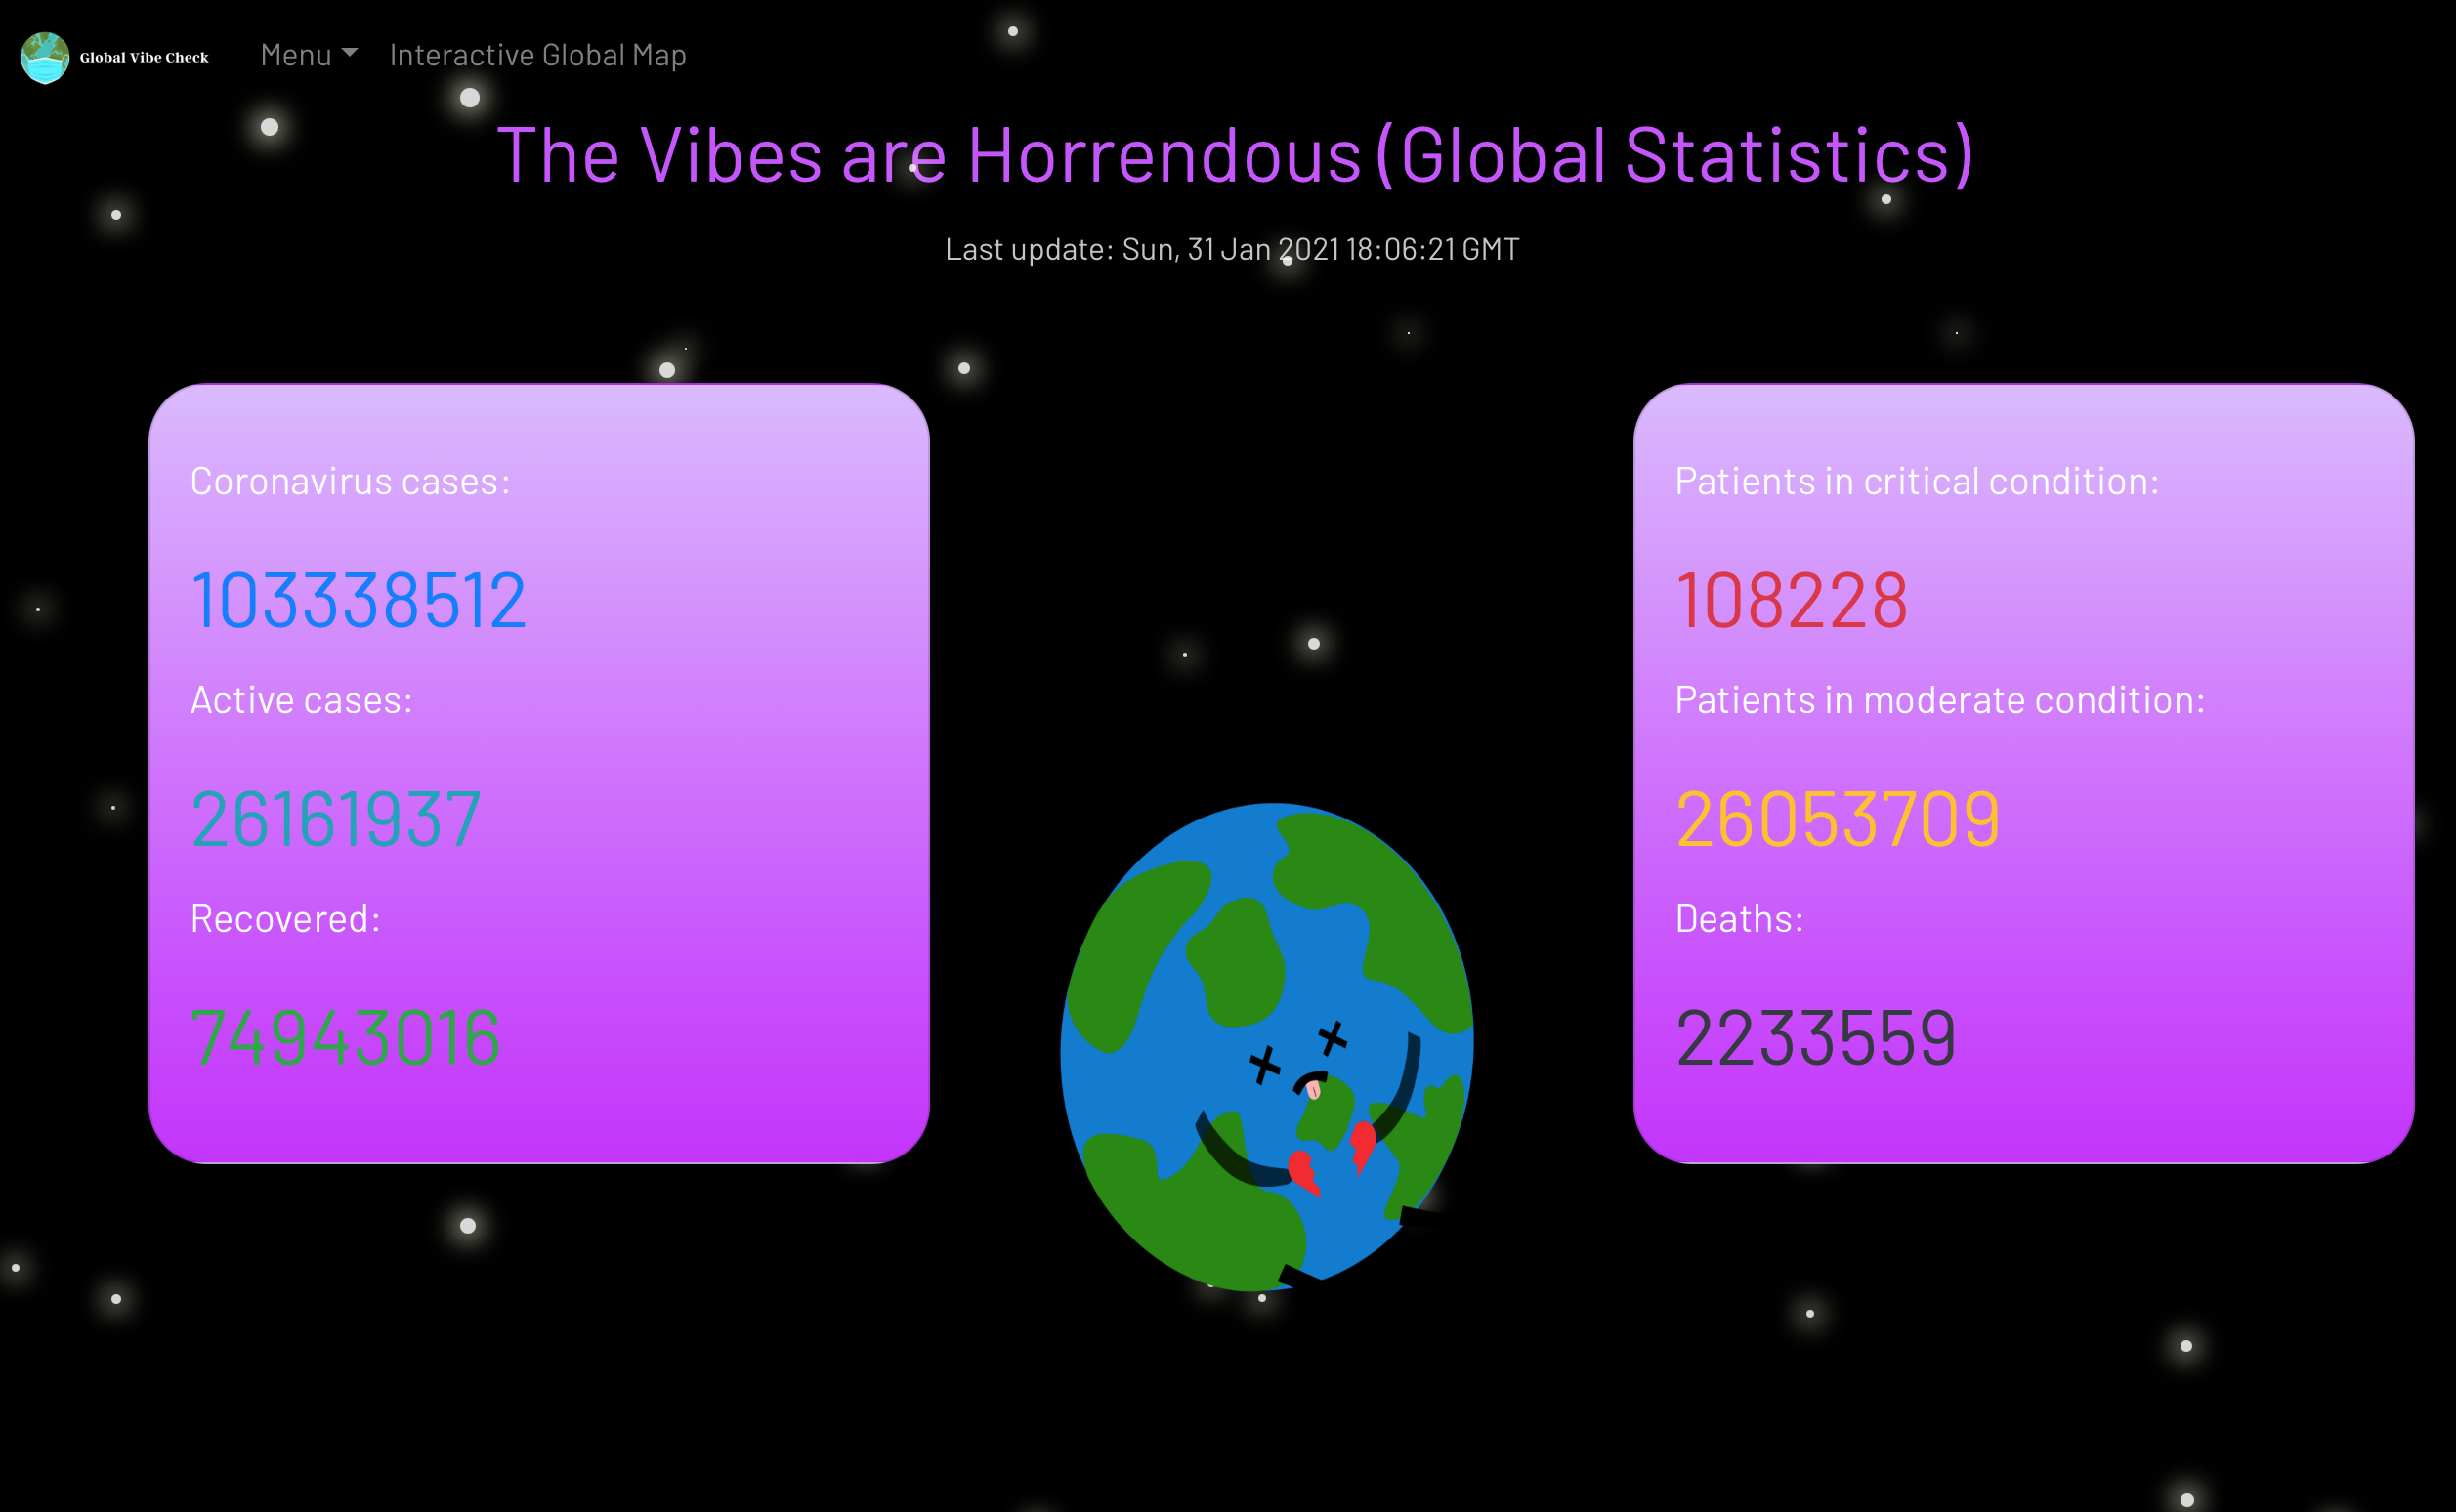
How is the world doing?

Inspiration
The initial app idea was a travel website that used the same globe for users to find their destination. We decided to combine this idea with COVID-19 API’s to better represent the time we’re living in and how realistic it is to travel around the globe. In addition to being a user friendly site to allow ease when it comes to the statistical side of the pandemic.
What it does
The product successfully displays Covid-19 cases, death, recover's, etc. In addition to this we have added an interactive globe that spins when you drag it, in order that you can see the other countries on the map. Not only is that the only thing the interactive map does, but it is color coded by Covid-19 severity. Finally, if you click the locations on the map an information card will appear and display the recent coronavirus cases, deaths and recovery along with two links leading to the CDC website and the other giving you information on the country covid.
How we built it
First we made of a prototype of the website on Figma that can be accessed through our github project's description. Global Vibe Check runs mainly on React.js, using the react-globe.gl library to render the spinnable globe. It uses several API’s: two for COVID statistics and Unsplash for country images. Styling was achieved using Bootstrap. There is also a small node.js/Express backend that fetches image data for each country. We split up the tasks by screen (each of us worked on different screens at different times).
Figma to prototype our web app to have the most vibes.
ThreeJS Globe Visualization to include an interactive globe so that a user may select cities.
Covid-API to extract Covid-19 data.
VACCOVID to extract Covid-19 data.
Unsplash to extract photos.
Challenges we ran into
The API we initially planned to use had some internal errors that we could not fix on our end, so we had to find new less popular API's to use in its place. Also, country names did not exactly match between the API’s that we used, so we had to make adjustments to get rid of any errors related to that.
Accomplishments that we're proud of
We are proud that we managed to pull off the functionality of the rotatable globe and markers containing COVID data. We also are quite pleased with the design of the overall website.
What we learned
We learned a lot from each other about the technology we used, such as React and node.js. We also learned about COVID-19 statistics, since we had to do light research and analyze our data on COVID-19.
What's next for Global Vibe Check
Have the photos included in the information cards be more representative of the respective city [Either improve fetch calls or use another API]. Have the web-app be responsive, including mobile-view. Create a more consistent vibe in design throughout each page. Extend the information provided about each country’s COVID statistics.


Log in or sign up for Devpost to join the conversation.