Inspiration
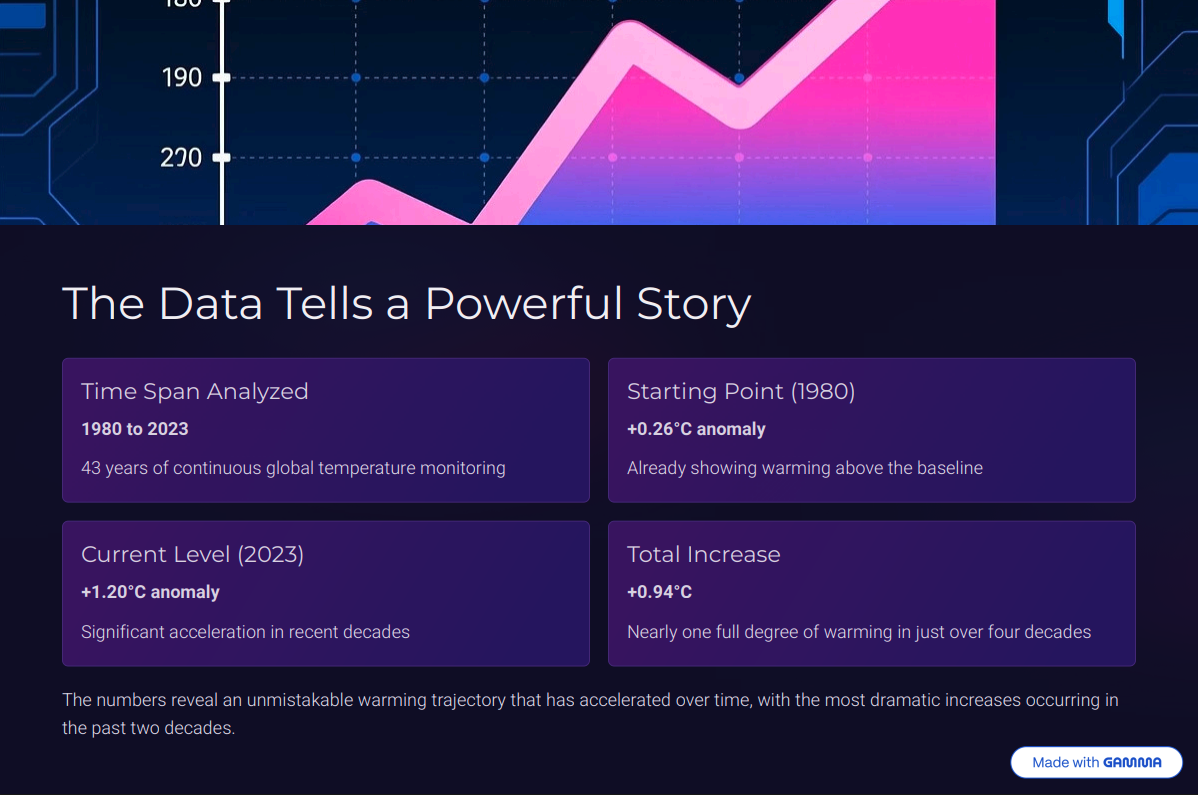
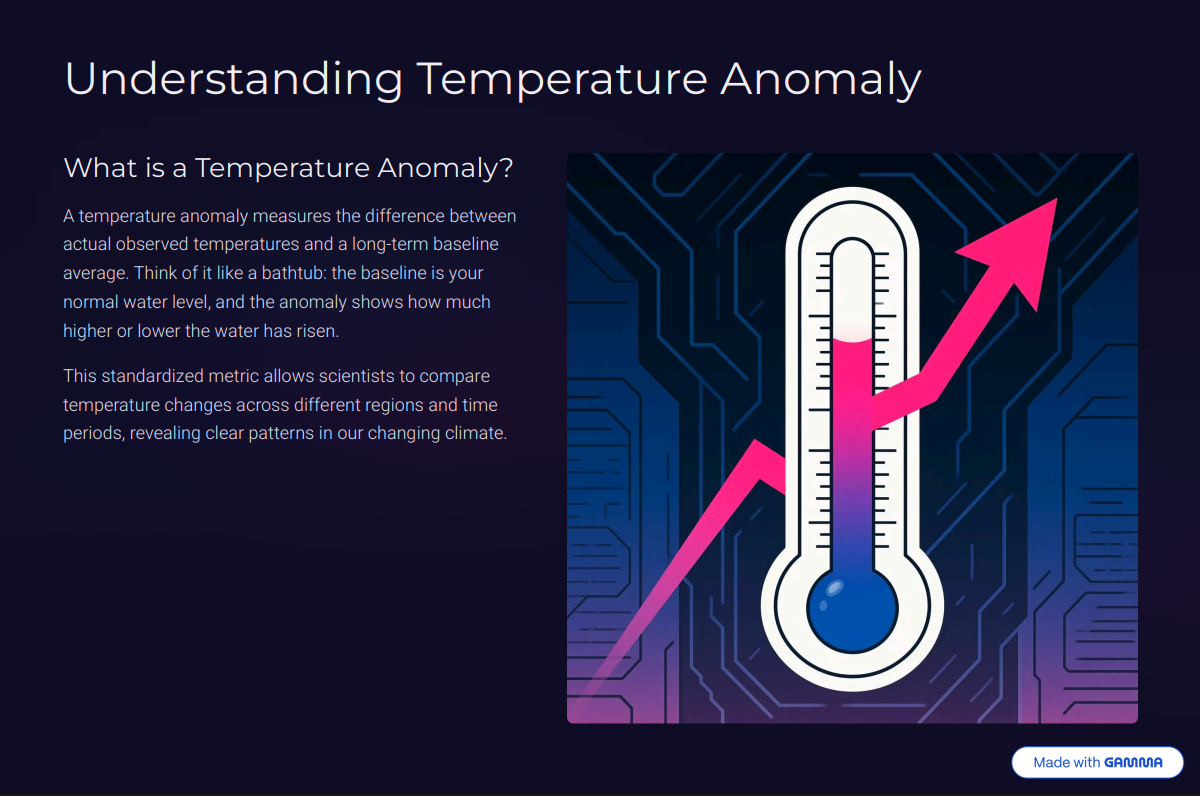
The growing urgency of climate change and the need for accessible, impactful data analysis drove the creation of the Global Temperature Analysis Anomaly Tool (GTAAT). We were inspired to build a simple, direct, and immediate way to demonstrate the undeniable trend of rising global temperatures. By focusing on temperature anomalies (deviation from a long-term average), we aimed to present a clear, quantifiable metric of global warming's progression over several decades.
What it does
The GTAAT is a command-line tool that performs a fundamental time-series analysis on global temperature anomaly data. It takes a list of pre-defined (year, temperature anomaly) data points, calculates the time span covered by the data, and determines the total increase in the temperature anomaly across the period. Crucially, it calculates the average rate of increase of the anomaly per year. Finally, it prints a clear, formatted report to the console, using color coding for visual emphasis on the critical findings.
How we built it
GTAAT was built using Python 3, focusing on simplicity and readability. The data structure employs a list of tuples (temp_anomaly_data) to store the paired year and anomaly values. The logic is encapsulated in a single, dedicated function, analyze_global_anomaly(data), promoting modularity. Calculation uses simple arithmetic operations to determine the time span and total anomaly increase, with division yielding the average rate. Output relies on the built-in print() function with f-strings for clear, dynamic formatting, and ANSI escape codes were included to color the total increase metric, enhancing the user experience in a terminal environment.
Challenges we ran into
The primary challenge was keeping the scope minimal yet impactful. We prioritized a working proof-of-concept over complex implementation, which meant avoiding advanced features like robust data ingestion or sophisticated graphing initially. The script uses hard-coded data; a major challenge was deciding not to immediately implement a data pipeline to fetch live data (e.g., from NASA or NOAA). Also, ensuring the console output was easily readable and visually emphasized the total anomaly increase within a strictly terminal-based environment required careful formatting.
Accomplishments that we're proud of
We successfully distilled a complex climate trend into two simple, powerful numbers: the total increase and the average rate of increase over the period. The use of color-coding in the terminal output effectively draws the user's eye to the most significant result, making the data's meaning immediately apparent. We are also proud of the functional simplicity of building a minimal, dependency-free Python script that performs a crucial analysis with high efficiency.
What we learned
We learned the power of data narrative—that even with a small amount of data, a focused analysis can communicate a powerful story. Specifically, we reinforced our understanding of Time-Series Basics, including how to calculate basic metrics like rate of change over a defined time interval. We also improved our mastery of Python Formatting, utilizing f-strings and the utility of ANSI escape sequences for basic terminal styling, and confirmed the benefit of Modular Design by placing all core logic within a single, well-named function.
What's next for Global Temperature Analysis Anomaly Tool (GTAAT)
Next steps involve expanding the tool's capabilities, starting with External Data Integration by modifying the script to read data from an external file (e.g., CSV or JSON) or an online API instead of hard-coded values, making the tool dynamic. We plan to incorporate Advanced Statistics, specifically calculations for linear regression, to provide a more statistically robust trend line and a better estimate of future anomalies. Finally, we aim for Data Visualization by integrating a plotting library like Matplotlib to generate a simple line graph of the anomaly trend, transitioning the tool from a purely text-based output to a graphical one.

Log in or sign up for Devpost to join the conversation.