-
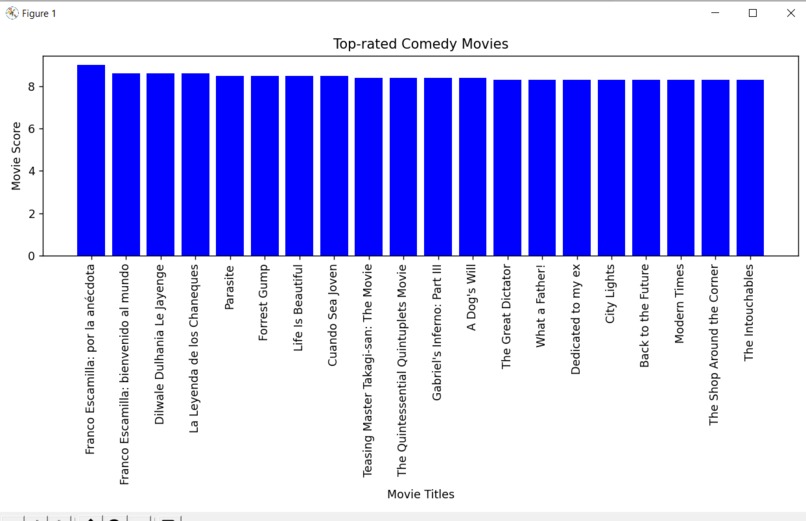
the graph which was shown
-

running the file


Inspiration
the challenge given in day 3 of global hack week was to build a few applications with certain conditions, out of them this completes the "Build a Data Visualization" and "Use a data api"
What it does
Using a genre ID, the script fetches movie data and processes it into a Pandas DataFrame. It then creates a bar chart, displaying movie titles on the x-axis and vote averages on the y-axis. after running the script, you can see the bar chart with the top rated comedy movies visually.
How we built it
built it using python and TMDB api (https://www.themoviedb.org/)
Challenges we ran into
plotting the graph without overflowing it
Accomplishments that we're proud of
of the entire program
What we learned
data visualization, pandas, matplotlib

Log in or sign up for Devpost to join the conversation.