-
-
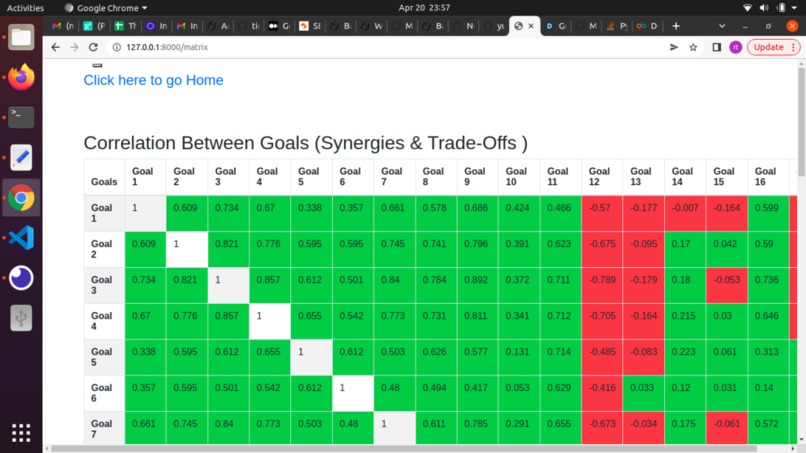
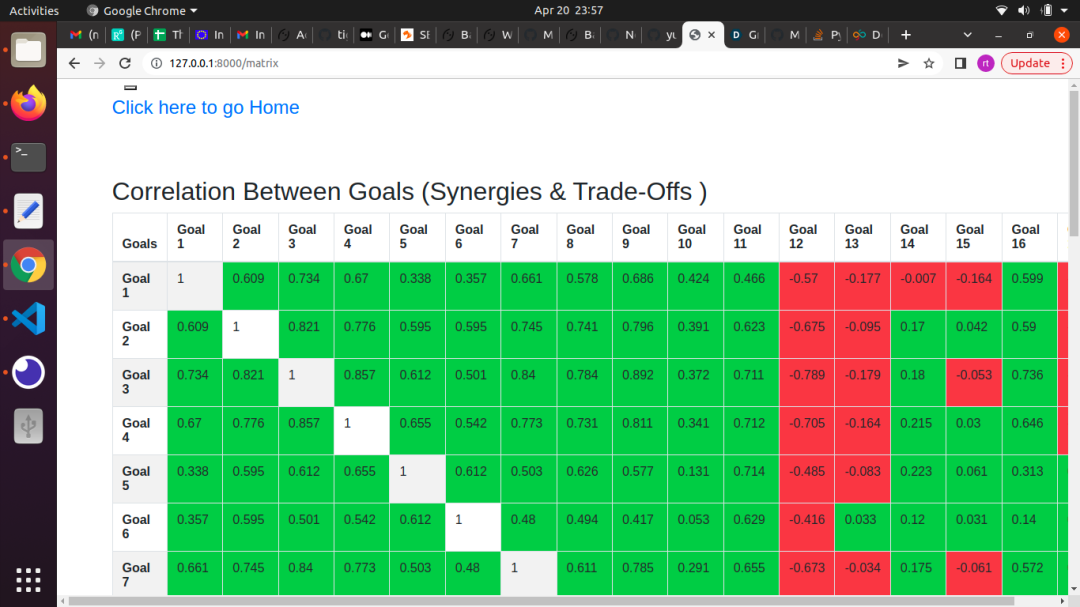
Master Matrix
-
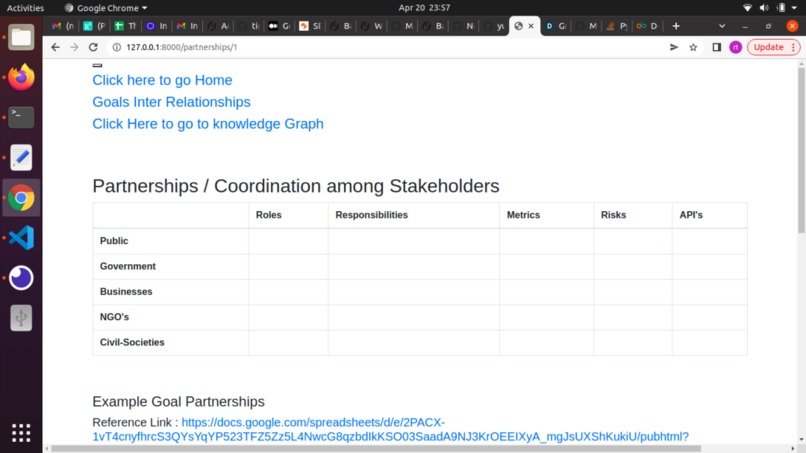
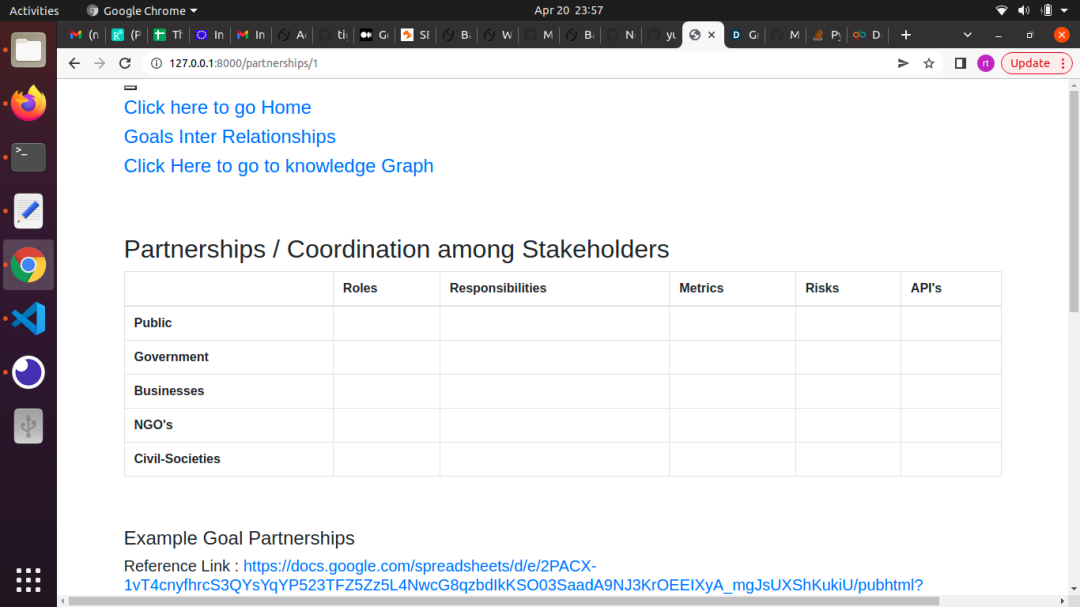
Partnerships amongst stakeholders
-
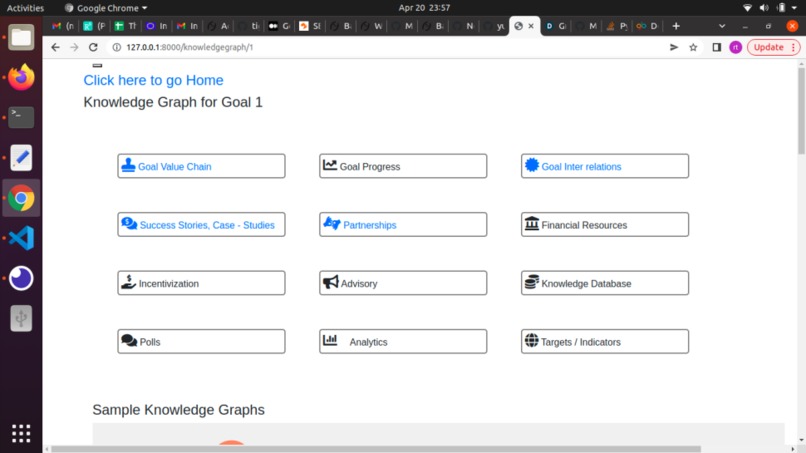
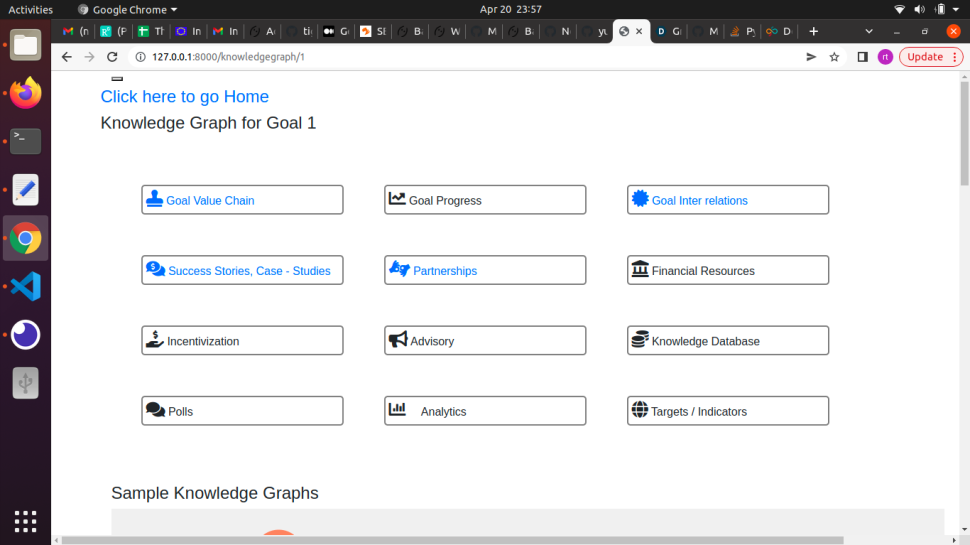
Knowledge Graphs
-
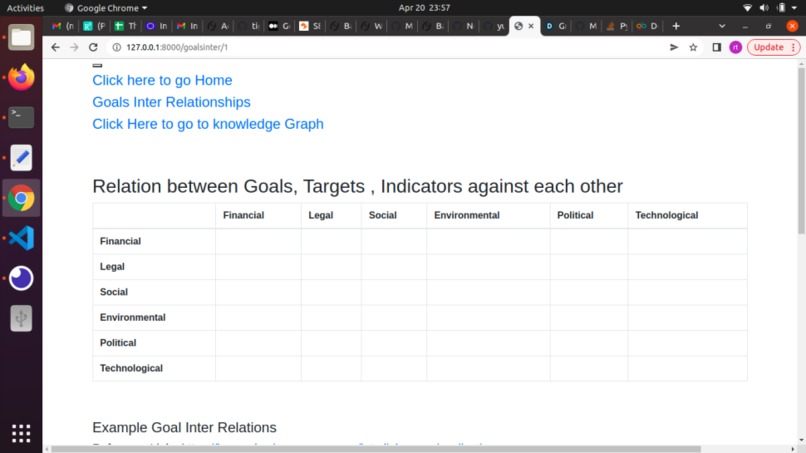
Relation between Goals, Targets and Indicators
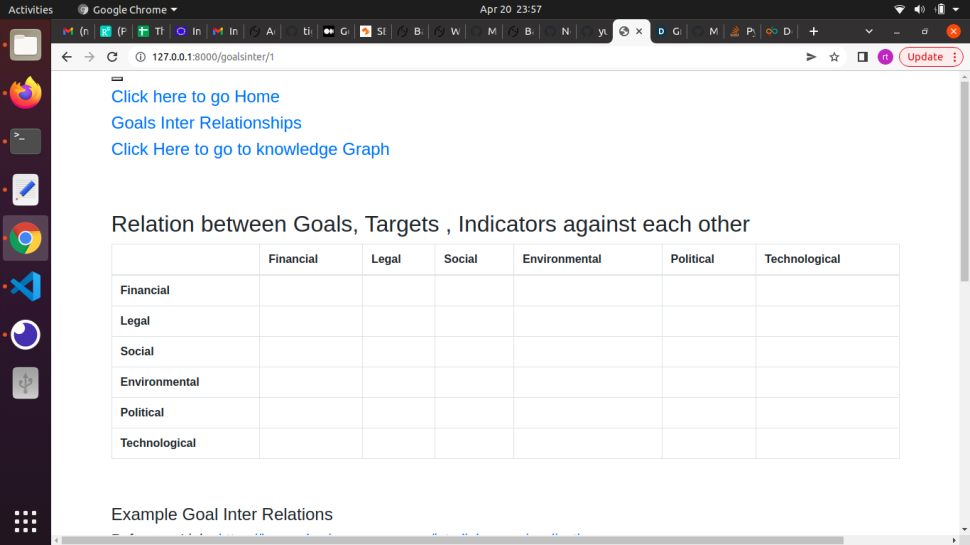
Global Goals Graph is a project which comprises of Knowledge Graph for United Nations Sustainable Development Goals which showcases the goals, targets, indicators and their inter-relationships. The Knowledge Graph shows the holistic view of various entities related to the goals and acts as a one-stop information source for all things related to the goals and enables coordination among the stakeholders.
Impact 😀
The United Nations Sustainable development goals have complex implementation challenges like financial, socio-economic, inequality, globalization, environmental degradation, population diversity and siloed information. These common challenges are an urgent call of action by each and every country. There are a lot of interconnections between different goals like ending poverty and other deprivations must go hand-in-hand with strategies that improve health and education, reduce inequality, and spur economic growth – all while tackling climate change and working to preserve our oceans and forests. If we are able to lay out all the interconnections between different sustainable development goals, it would be incredibly beneficial for all our stakeholders to achieve multiple goals with just one solution. That is what our project Global Goals Graph does uses the power of Graph technology. Our potential stakeholders for the UN SDGs are the general public, governments, conscious businesses, NGOs and civil -societies. Our solution showcases the Knowledge graph for the development goals. We use a holistic approach for our knowledge graph which enables coordination among stakeholders thereby addressing some of the above problems.
The social benefit includes saving the environment, maximizing resources for the world, improving quality of living, and good health. The economic benefit includes betterment of wages for lower-income, efficient use of resources and increased productivity, Our solution positively impacts the environment, increases the quality of life of people from different walks of life, from different communities, efficient use of resources, reduces poverty, better health and sustainable living. So our solution would prove to be a step toward achieving all the development goals and help the society sustain itself. It proves to be effective in helping create more understanding of the interconnections between all the 17 SDGs so that stakeholders can target multiple goals with one step which will increase the efficiency of the steps taken for achieving the goals and hence help in the betterment of our society and planet earth.
Innovativeness 🧠
Our project has a complex implementation. It involves intensive Tiger Graph, Our approach for achieving the United Nations Sustainable development goals is through using Knowledge Graphs and Design Thinking. A knowledge graph, also known as a semantic network, represents a network of real-world entities—i.e. objects, events, situations, or concepts—and illustrates the relationship between them. This information is usually stored in a graph database and visualized as a graph structure. In the context of the UN SDGs, achieving the goals would require a deep understanding of the challenges, value chain propositions, and looking into what frameworks would fit in to solve the root of the problems. Our Knowledge graph and design-thinking approach enable a holistic view of the entities and their relationships and coordination between the stakeholders. The approach is inherently suited to handle this type of complexity.
A graph's inherent properties of relationships among entities capture the requirement of what needs to be modelled and are well suited to handle the size and complexity of this nature. We analyzed the nature of the problem and similar problems, studied the existing practices, technologies and frameworks, and came up with the Knowledge Graph. After evaluating the different solutions, their features, offerings, pros & cons, we matched the requirements against the potential solutions and finalized Knowledge Graph. After implementing the tiger graph, we created a python-based server in Django, where we created a basic frontend using bootstrap, after which we integrated the Tiger Graph database with the frontend which resulted in a fully functional dynamic website.
Reference Links:
- http://ceur-ws.org/Vol-2519/short1.pdf
- https://assets.pubpub.org/ike3bea9/71590171394041.pdf
- https://www.ajah.ca/blog/2021/10/26/knowledge-graphs-connecting-the-work-of-nonprofits-to-the-un-sustainable-development-goals
Ambitiousness 💪🏻
Our solution requires modelling data from various diversified sources such as scientific, industry, governments and all kinds of projects. The tool that captures information & interactions among the data from all the above sources requires a complex graph such as Tiger Graph. Our Knowledge graph solution composes of 13 vertices and 13 edges. We started by first studying the UN SDGs. We studied how to dissect the value chain. The information present in each goal, target and indicator is transformed into a semantic representation. We identified the gaps in the value chain through gap analysis. We then wrote the functional requirements and then modelled the requirements into database design and user interfaces, developed queries, and built the frontend and backend.
Some functional features we targeted are speed, scaling, analytics, built-in REST APIs, and GSQL. We tried to have the platform as smooth and seamless as possible thus we targeted to have a high speed, we used the best and the fastest options for the frontend like bootstrap, and Django for the backend as it had a high compatibility speed with Tiger Graph. The website is also scalable and can be accessed from any form of device that has a connection to the internet. We show very detailed analytics on our frontend, after all the data gets processed by the database, it generates precise values that we show on our frontend as you must have seen on the Matrix page in the video. We also used several built-in REST APIs and also created our own multiple custom REST APIs for the dataset fetching and integration process. We wrote several GSQL queries to integrate the data into the database. We used GSQL because it is the fastest and most scalable query language for graph databases. That briefly summarises how we went about this project technically.
Applicability 🌍
The stakeholders of our solution are the general public, governments, businesses, NGOs and civil -societies. In particular, for example for SDG no. 11, stakeholders would be city residents, municipalities & residential societies. Most of the stakeholder's systems are providing information through Public access data portals, APIs, messengers, and bots which can be integrated into our system. Integrating the above systems /applications with our solution is easy. The backend data is modelled as per the requirements of the real-world processes and their inter-relationships are also captured. The solution accepts data from heterogeneous sources. Depending on the goal we are addressing, solutions can be adapted as needed. First, we Identify which goal, targets/or indicators we want to handle first and identify the systems like stakeholders systems, government systems, and private businesses. Next mapping the data, loading in our systems. Release the project as a pilot to a small set of users. Then take feedback and close the loop.
The size of the market depends on the goal. For example Goal no. 11: Sustainable Cities and Communities is around 700 bn. The market size for the Global climate change consulting market generated revenue of US$ 5.3 billion in 2017. The market size for the global renewable energy market was valued at $881.7 billion in 2020. Since UN Sustainable development goals are an urgent call of action by each and every country, the target and the impacted audience are huge. This being the need of the hour, has a wide potential to be applicable/implemented in today's world
Conclusions 😴
The application is fully finished yet has some limitations that we would like to talk about: Firstly Some queries are not optimized and take a little longer to execute. Secondly, We did not implement every feature of the Knowledge Graph that is normally present, we did not implement 2-3 features that were either useless for our purpose or out of our skillset. This was my first time interacting with graphs for both of us teammates. Therefore we faced a lot of challenges we faced during the implementation of this project such as:
- Understanding the interactions between the SDGs.
- Learning Tiger Graph, designing and writing queries.
- Managing Time effectively.
- Come up with a practical solution to achieve the UN SDGs
- High level of diversity found between different datasets while integrating.
However, we did all our best efforts to overcome all the problems we faced, with the help of mentors and fellow competitors we were successfully able to complete the project. We learnt a great ton of graph and writing GSQL queries, integrating datasets in graph databases, connecting the database to a python framework, interconnections between UN sustainable development goals and overall working as a team. We had many more features planned for the Global Goals Graph, but we couldn't implement them due to time shortage (we started the project very late, we learnt much more time learning) and some features it was not doable with our skillset. In the future, however, we will improve the design for the application, enhance the versatility of the graph and reduce the response time from the backend, use frontend libraries to portray the information in a more eye-pleasing and understandable manner, and integrate much more datasets into the database to have an even-larger variety of information available. Thank you to tiger graph for giving us such a beautiful opportunity to work on this project. We really enjoyed it and learned a lot in the process ✌🏻✌🏻.
Some reference links: https://www.researchgate.net/publication/314450804_Achieving_Sustainable_Development_through_Value_Chain https://knowsdgs.jrc.ec.europa.eu/interlinkages-visualization
Website available at - https://rtrao99.pythonanywhere.com

Log in or sign up for Devpost to join the conversation.