-
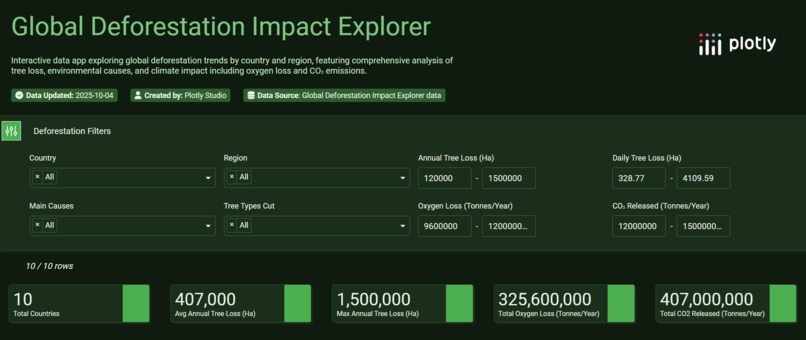
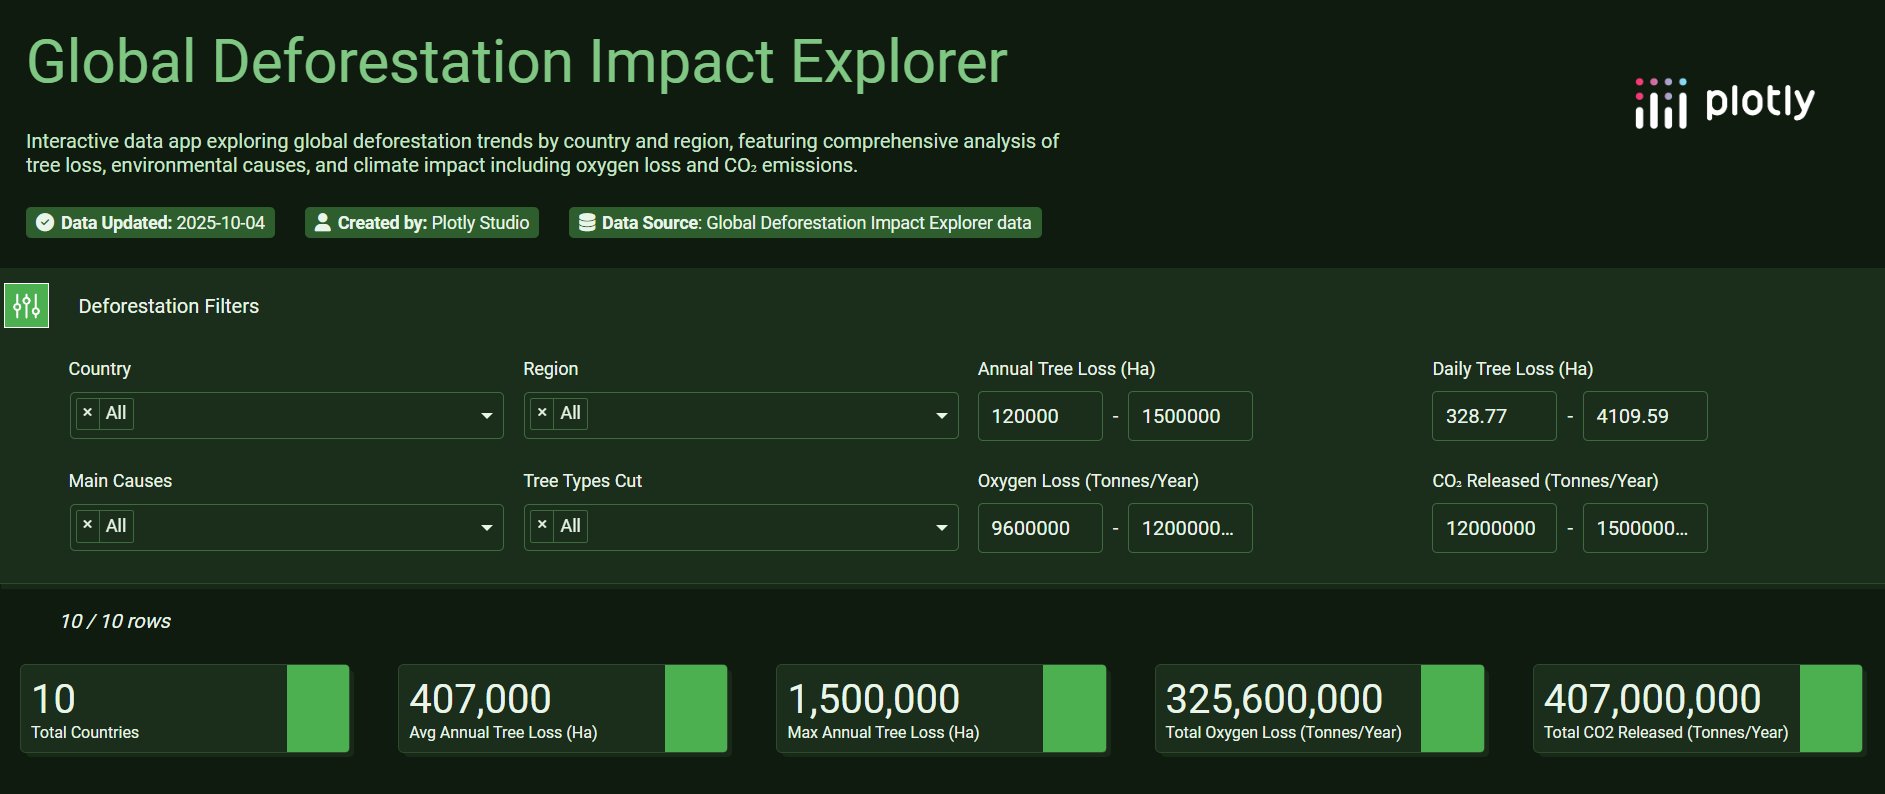
Global Deforestation Impact Explorer- Shows total countries,average & max annual tree loss,oxygen & CO2 impact.
-
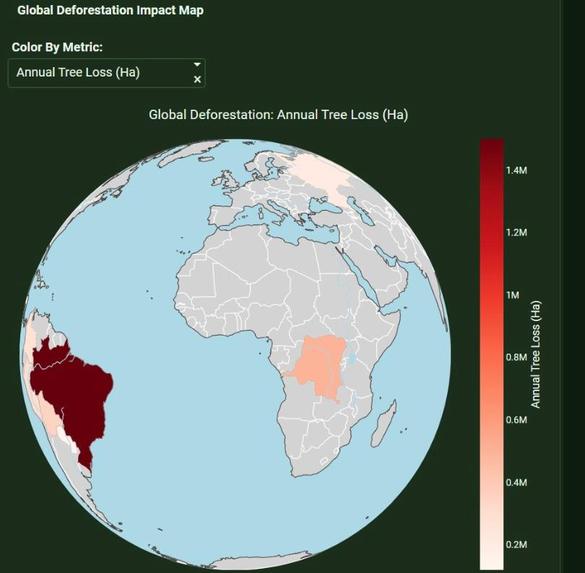
Annual Tree Loss Map - Higlights countries like Brazil & Congo with highest deforestation.
-

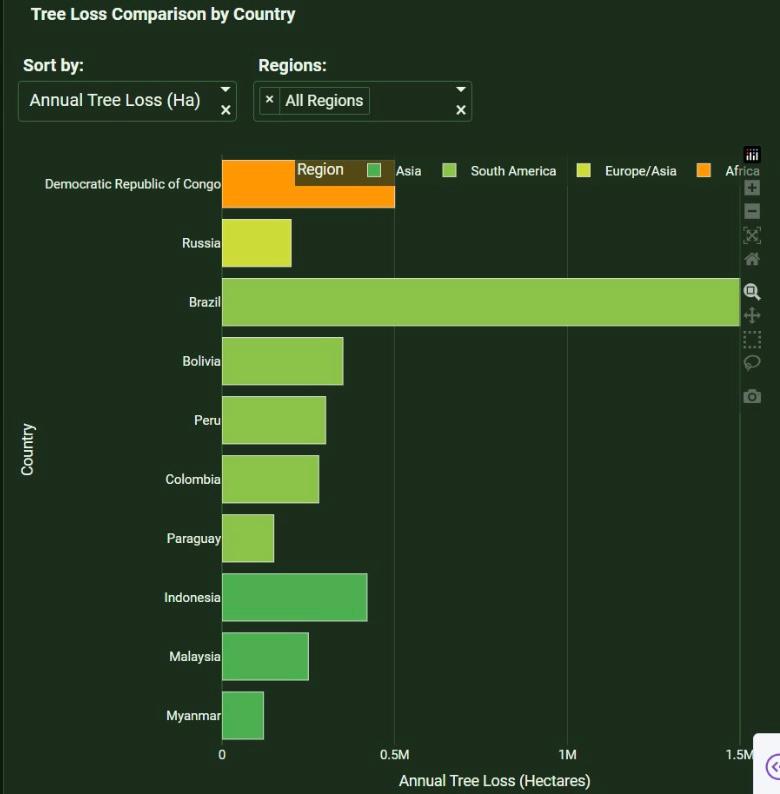
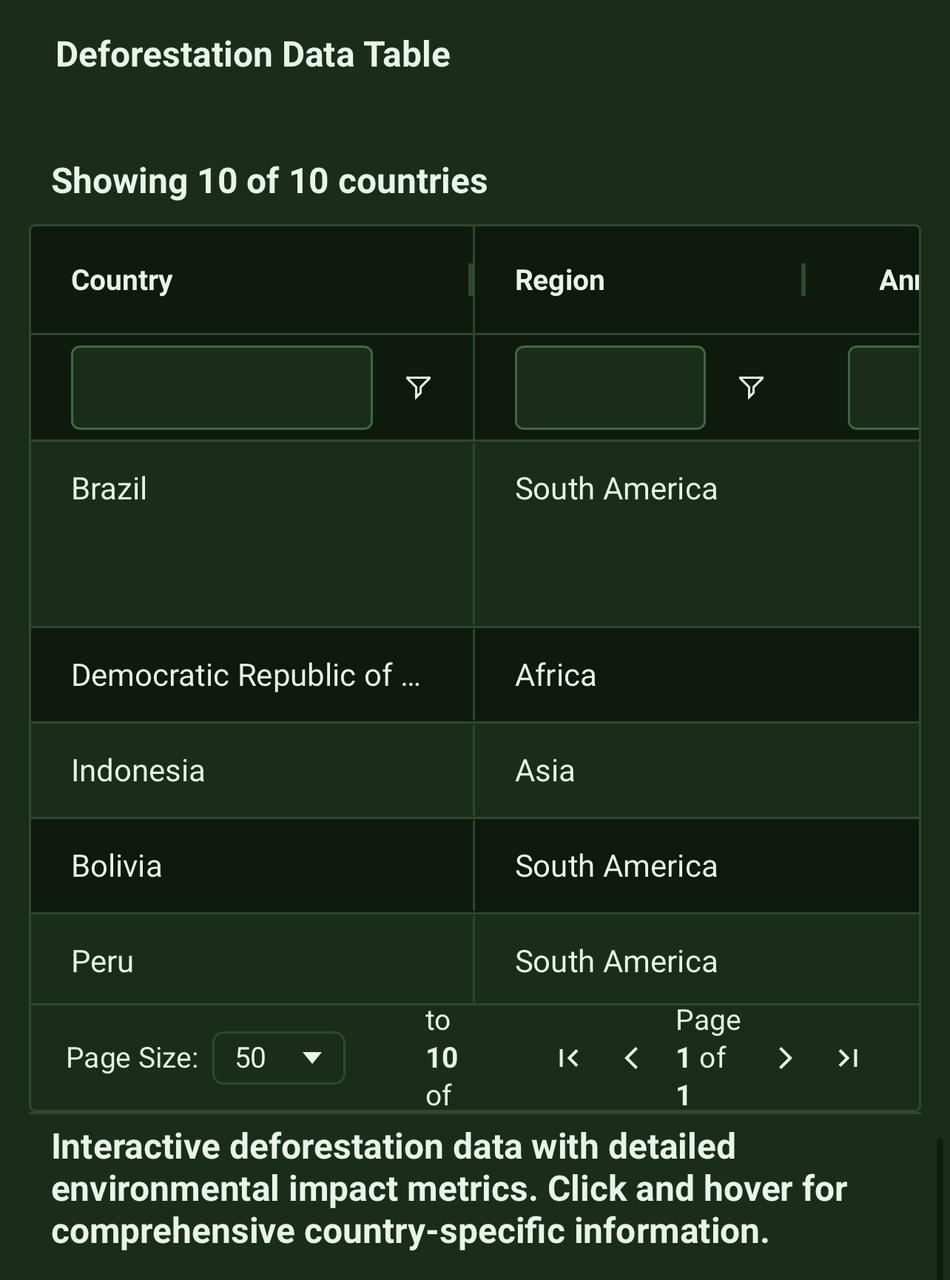
Tree Loss by Country - Brazil,Congo,Indonesia,Bolivia & others compared.
-
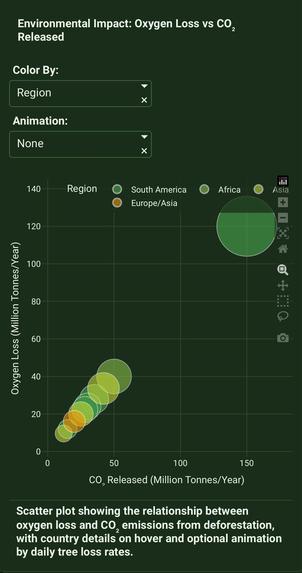
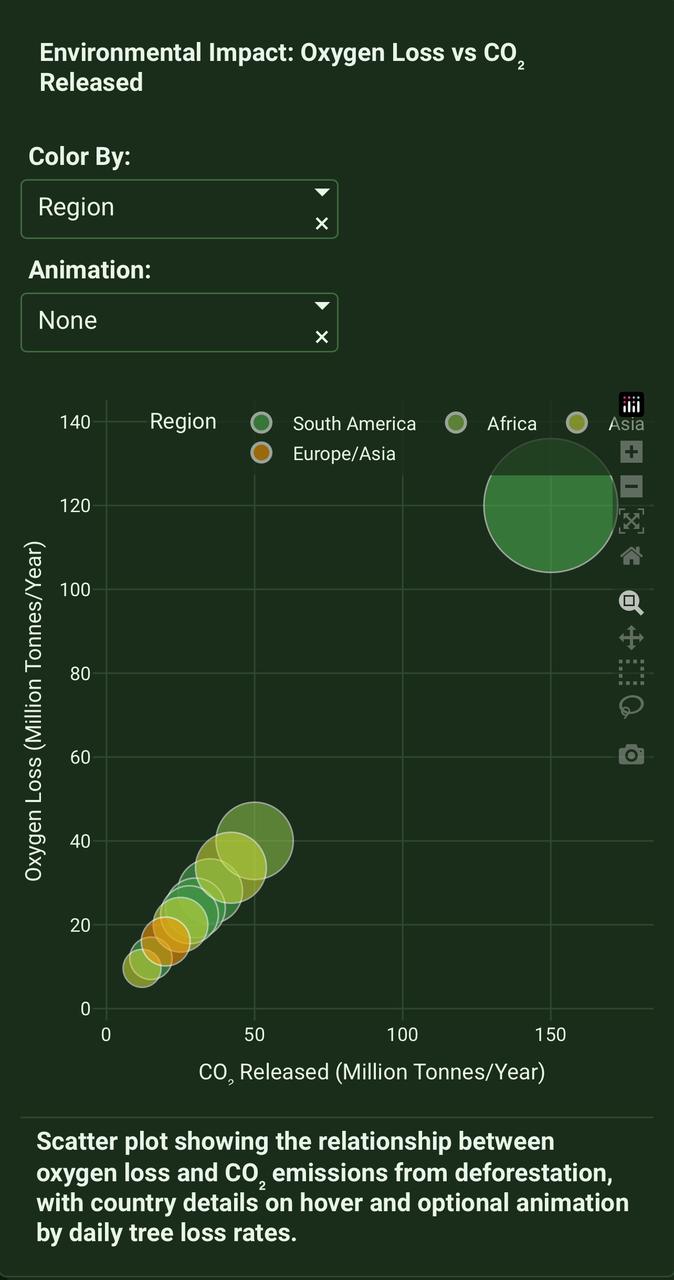
Oxygen Loss vs CO2 Released - Bubble chart comparing environmental impact by region.
-
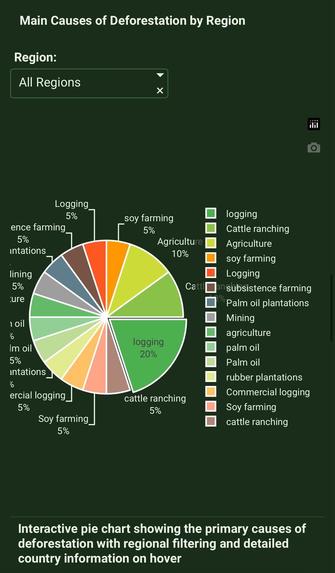
Causes of Deforestation - Logging,cattle,ranching,agriculture,soy farming,etc.,
-
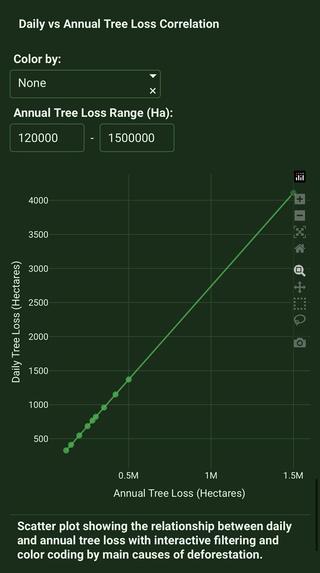
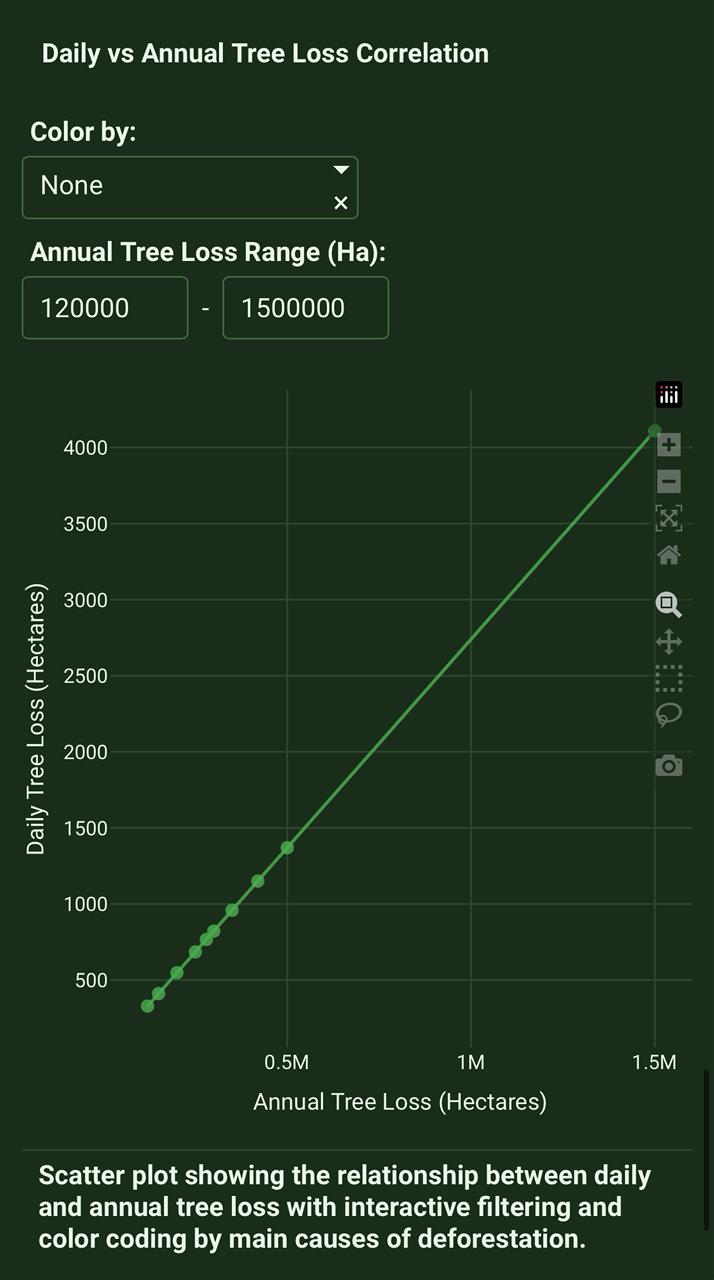
Daily vs Annual Tree Loss - Direct correlation showing how annual tree loss translates into daily impact.
-
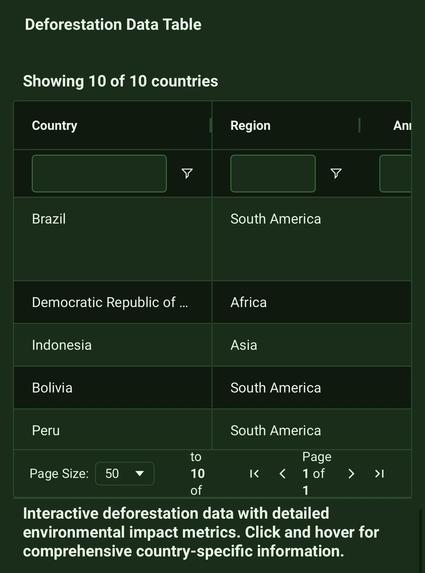
Country wise data - Interactive table with filters for countries & regions.
-

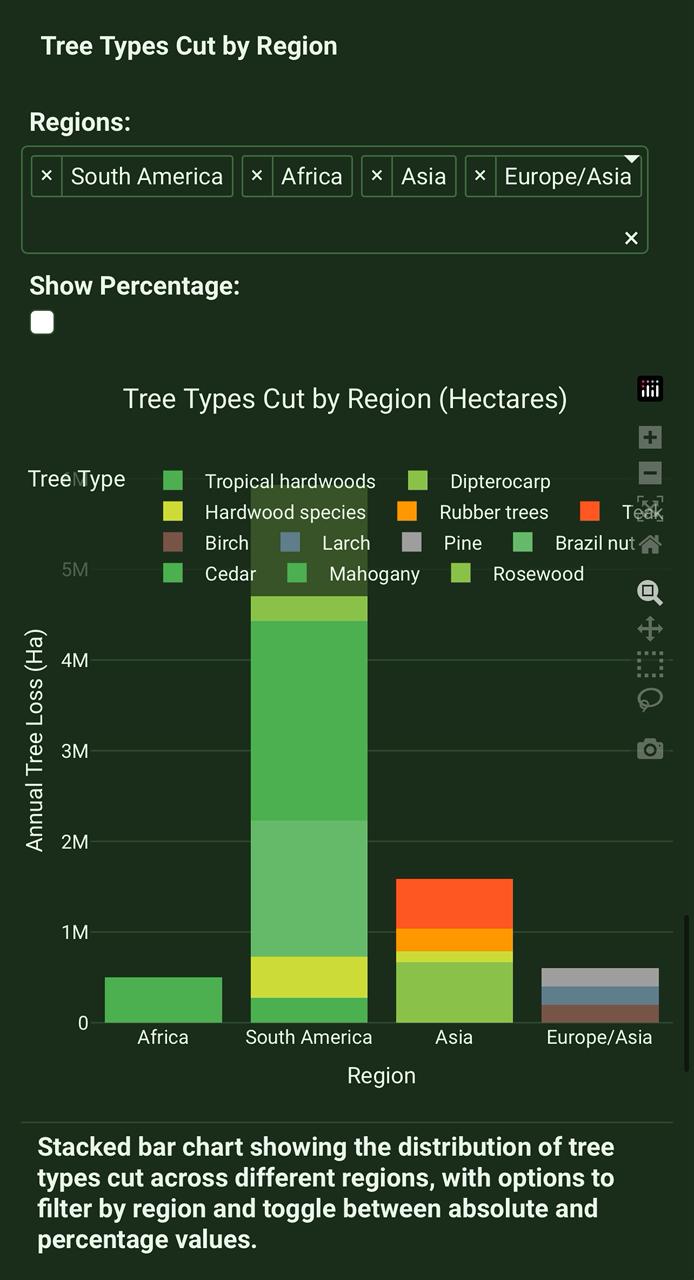
Tree Types Cut - Breakdown by hardwoods,mahogany,cedar,rubber trees,etc.,


Inspiration
*Childhood Memory of a big tree on my street that's no longer there.
What it does
*Shows Global tree loss by country & region. *Explains main causes(logging,palm oil,cattle,etc.,) *Reveals tree types cut & purposes. *Estimates oxygen loss & CO2 emissions. *Interactive map with filters & comparisons.
How we built it
*Collected/structured data (FAO,GlobalForest Watch,WRI) *Created CSV with tree loss + environmental impact. *Built app using Plotly *Added global map with hover/click insights
Challenges we ran into
*Finding reliable structed data *Estimating oxygen & CO2 impact *Balancing interactivity with simplicity
Accomplishments that we're proud of
*Built a meaningful tool to educate people. *Linked deforestation tp oxygen/CO2 clearly. *Turned Complex data into engaging visuals.
What we learned
*Plotly can turn raw data into powerful stories. *The scale of deforestation is larger than expected. *Data storytelling inspires more awareness than numbers alone.
What's next for Global Deforestation Impact Explorer
*Add realtime deforestation data (APIs) *Show yearly time-lapse of tree loss *Suggest solutions & actions for users. *Collaborate with NGOs/educators for outreach.
Built With
- fao
- globalforestwatch
- python
- wri

Log in or sign up for Devpost to join the conversation.