-
-
This is not the pull webpage. Do visit the link for more
Inspiration
The Global CO₂ Footprint Explorer & Forecast was inspired by the need for accessible, interactive tools that empower individuals, researchers, and policymakers to understand and act upon global carbon emissions data. Drawing from datasets like Our World in Data and the Global Carbon Project, the project aims to provide a comprehensive view of emissions trends, sectoral contributions, and future projections.
What it does
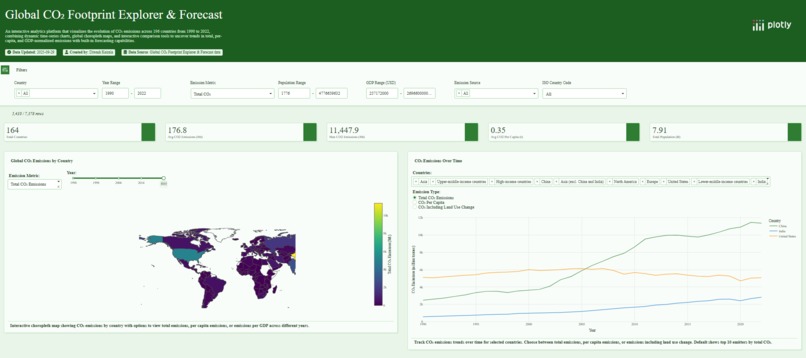
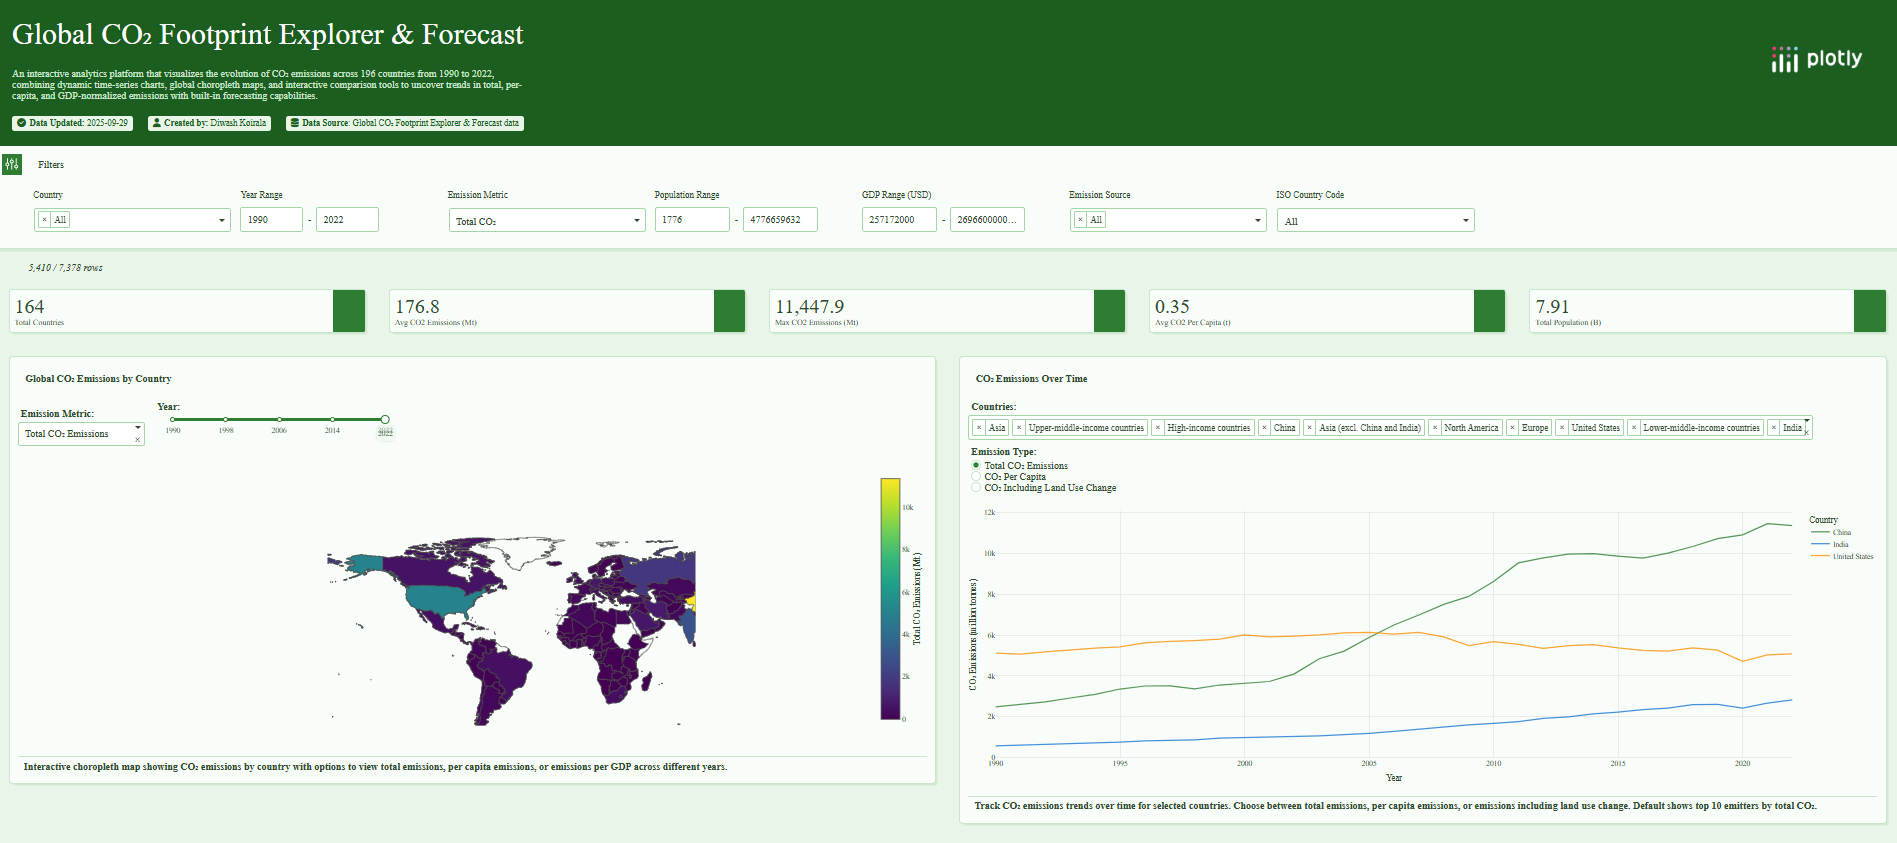
This interactive dashboard visualizes global CO₂ emissions from 1990 to 2024, offering insights into total and per capita emissions, sectoral breakdowns, and cumulative contributions by country. Users can explore emissions data through various charts, including choropleths, time series, rankings, and scatter plots, with interactive features like dropdowns and range sliders for customized analysis.
How we built it
The dashboard was developed using Plotly Dash, leveraging Python for data processing and visualization. Data sources include the Global Carbon Project and Our World in Data. Interactive components were implemented using Dash's built-in features, allowing for dynamic updates and user engagement.
Challenges we ran into
Integrating diverse datasets with varying formats posed initial challenges. Ensuring smooth interactivity across multiple charts required careful design and testing. Additionally, optimizing performance for real-time data updates was a key consideration to maintain user experience.
Accomplishments that we're proud of
We successfully created an intuitive interface that allows users to explore complex emissions data interactively. The integration of multiple chart types and interactive elements provides a comprehensive tool for understanding global CO₂ emissions trends.
What we learned
The project deepened our understanding of data visualization principles and the importance of user-centered design. We also gained insights into the complexities of handling large datasets and the technical considerations involved in building interactive web applications.
What's next for Global CO₂ Footprint Explorer & Forecast
Future developments include integrating predictive modeling to forecast emissions trends beyond 2024, incorporating additional environmental indicators like methane and nitrous oxide, and enhancing the user interface for improved accessibility and engagement.
Built With
- ploty


Log in or sign up for Devpost to join the conversation.