-
-
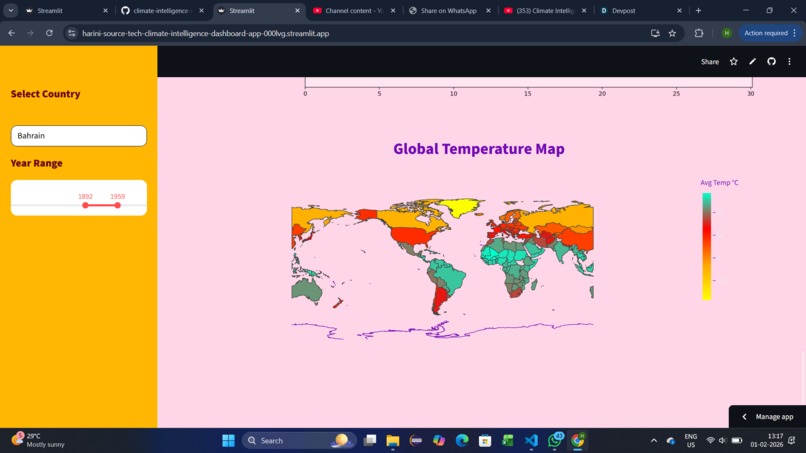
Map
-
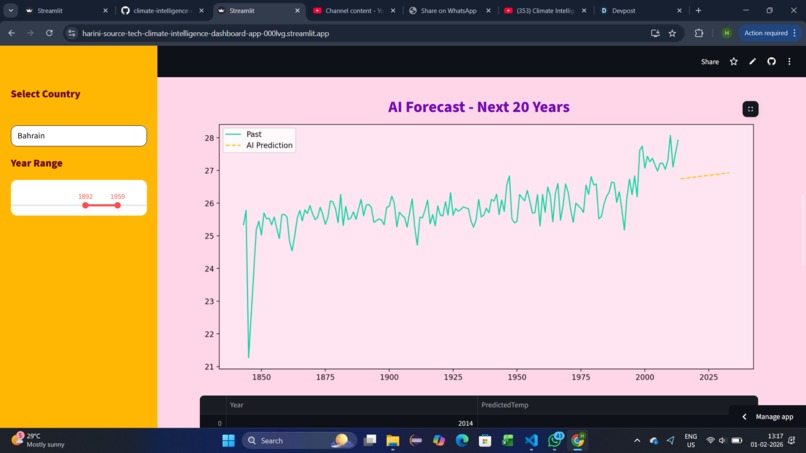
AI prediction
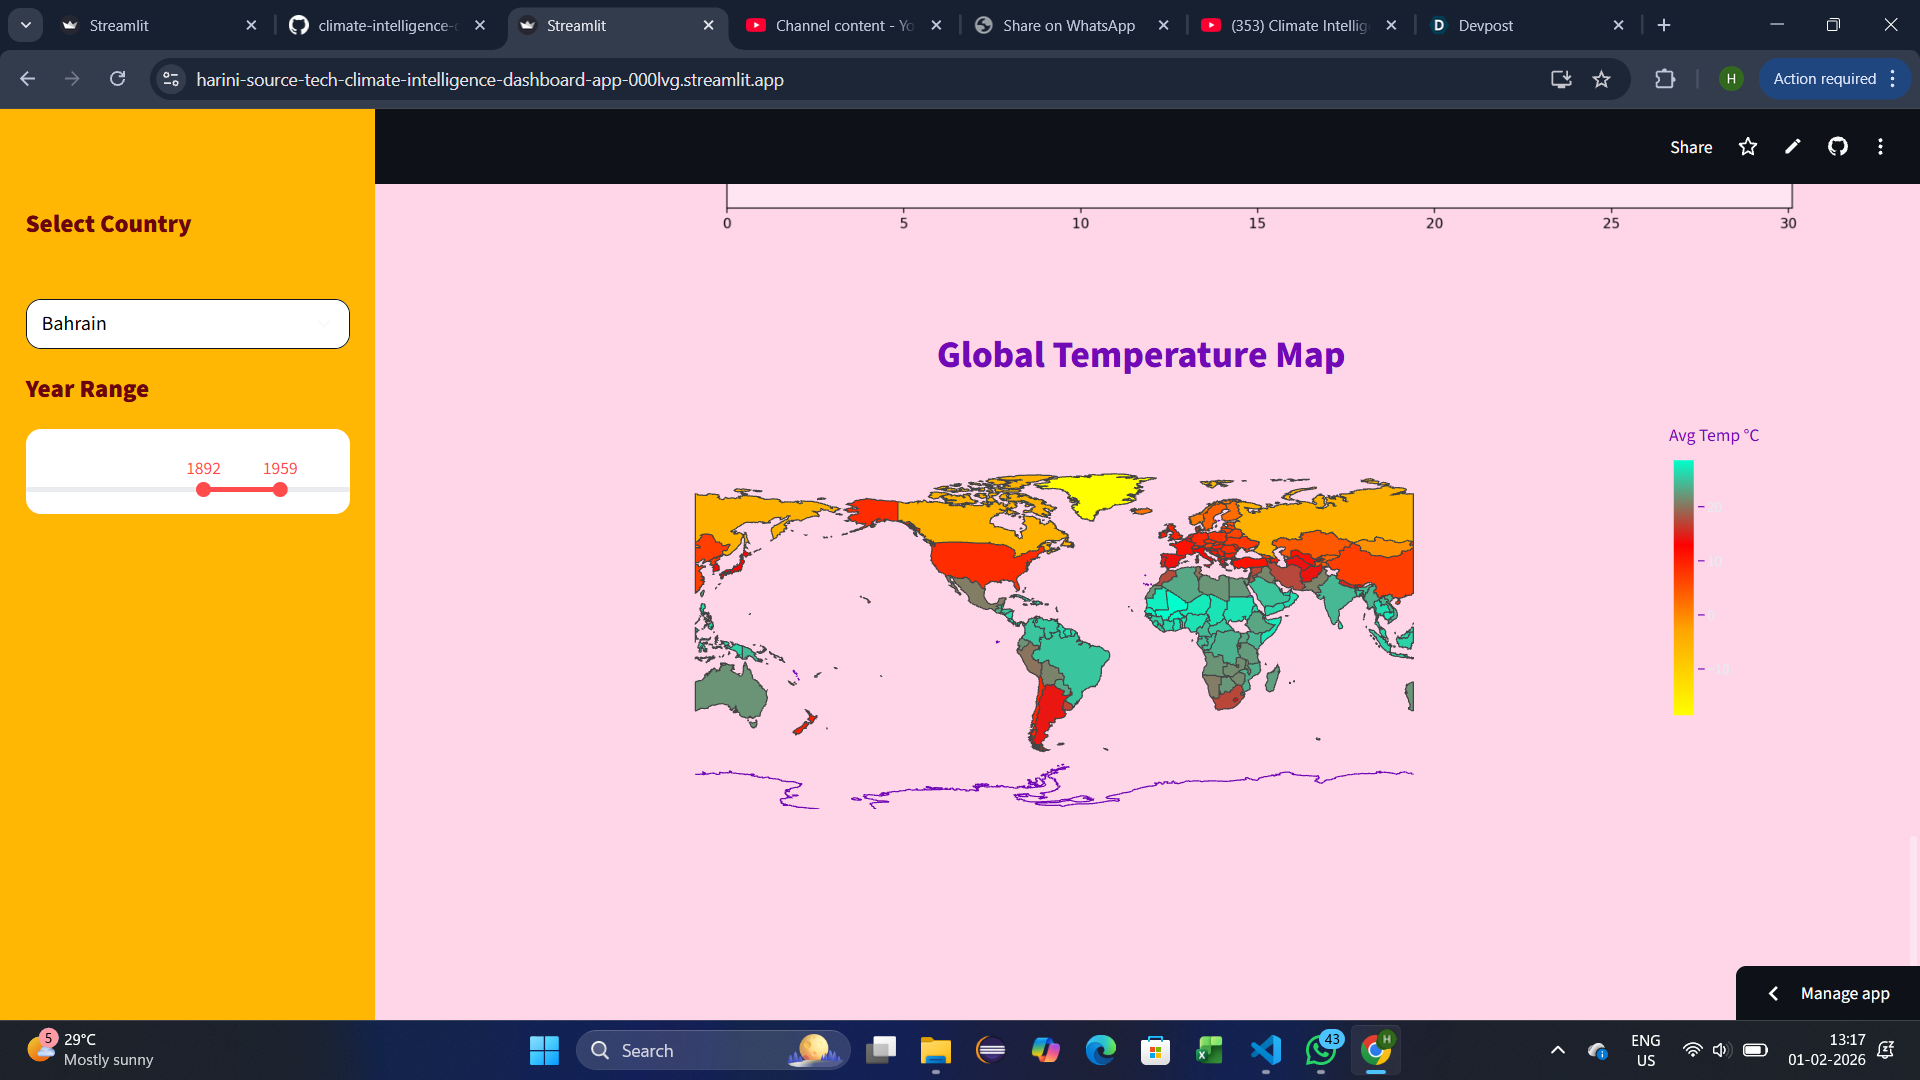
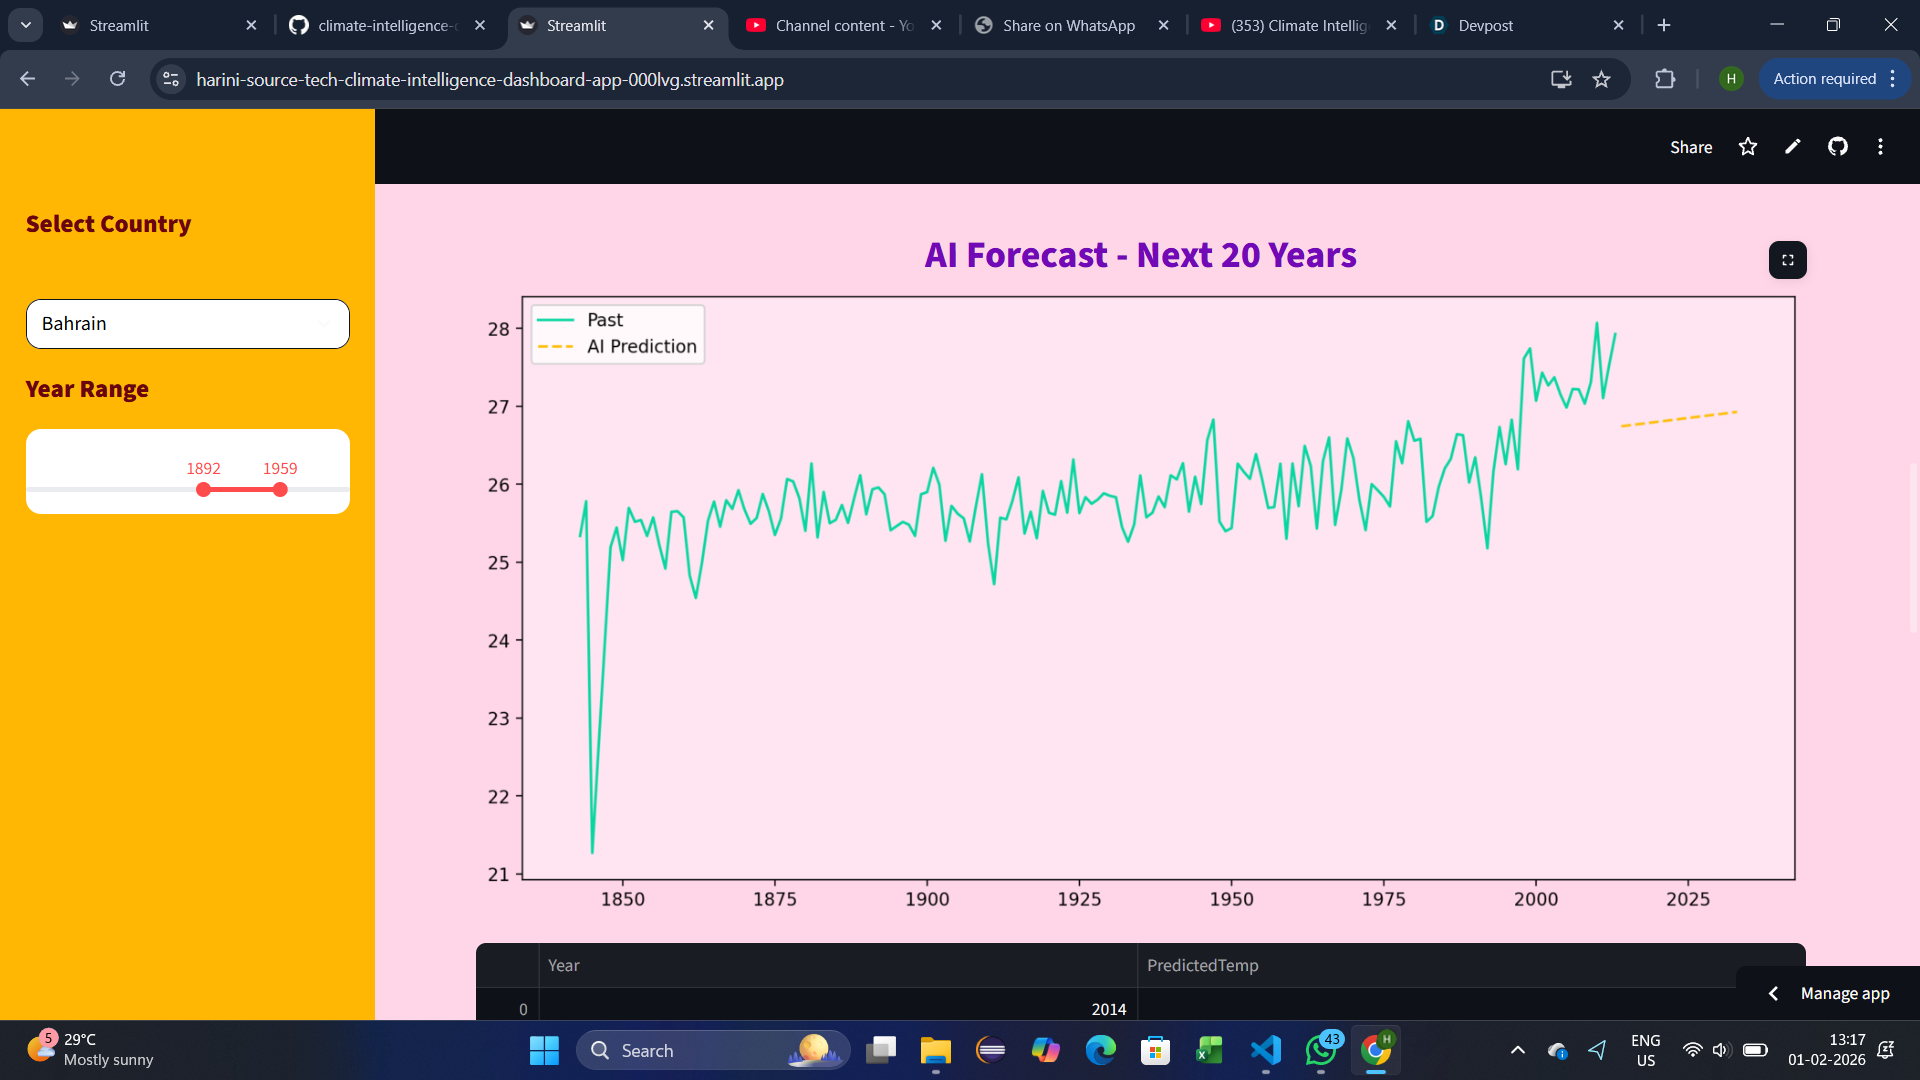
Inspiration Climate change is one of the most urgent global challenges. I wanted to build a simple and interactive way for people to explore temperature data across countries and understand long-term climate patterns using data and AI. What it does The Global Climate Intelligence Platform allows users to select any country and year range to visualize historical temperature trends, compare rankings, view global patterns on a world map, and generate AI-based forecasts through regression models. How I built it The dashboard was built using Python and Streamlit for the interface. Data was cleaned and processed using Pandas and NumPy. Visualizations were created with Matplotlib, Seaborn, and Plotly. Machine learning forecasting was implemented using scikit-learn. Challenges I faced Handling large climate datasets, deploying the application online, fixing dependency errors, and optimizing visualizations were the main challenges. These were solved by preprocessing data carefully, debugging deployment logs, and simplifying heavy plots. What I learned I learned how to deploy Streamlit apps, structure real-world data projects, build dashboards, and integrate machine learning models into interactive applications.
Built With
- matplotlib
- numpy
- pandas
- plotly
- python
- scikit-learn
- seaborn
- streamlit

Log in or sign up for Devpost to join the conversation.