Inspiration
One of us watched her mom go through menopause: years of hot flashes, sleepless nights and mood swings, and every doctor visit ended with "it's just age." She's not alone. Frequent hot flashes last a median of 7.4 years, yet women walk into a 10-minute appointment with nothing but memory. Medicine has under-studied women for decades. Women have adverse drug reactions nearly twice as often as men, and today's women's health apps track dates without connecting symptoms to sleep, fitness or nutrition. We built Glitch to turn what a woman feels into evidence she and her doctor can trust.
What it does
- Voice-first logging: say "I'm having a hot flash" and it's logged in the moment.
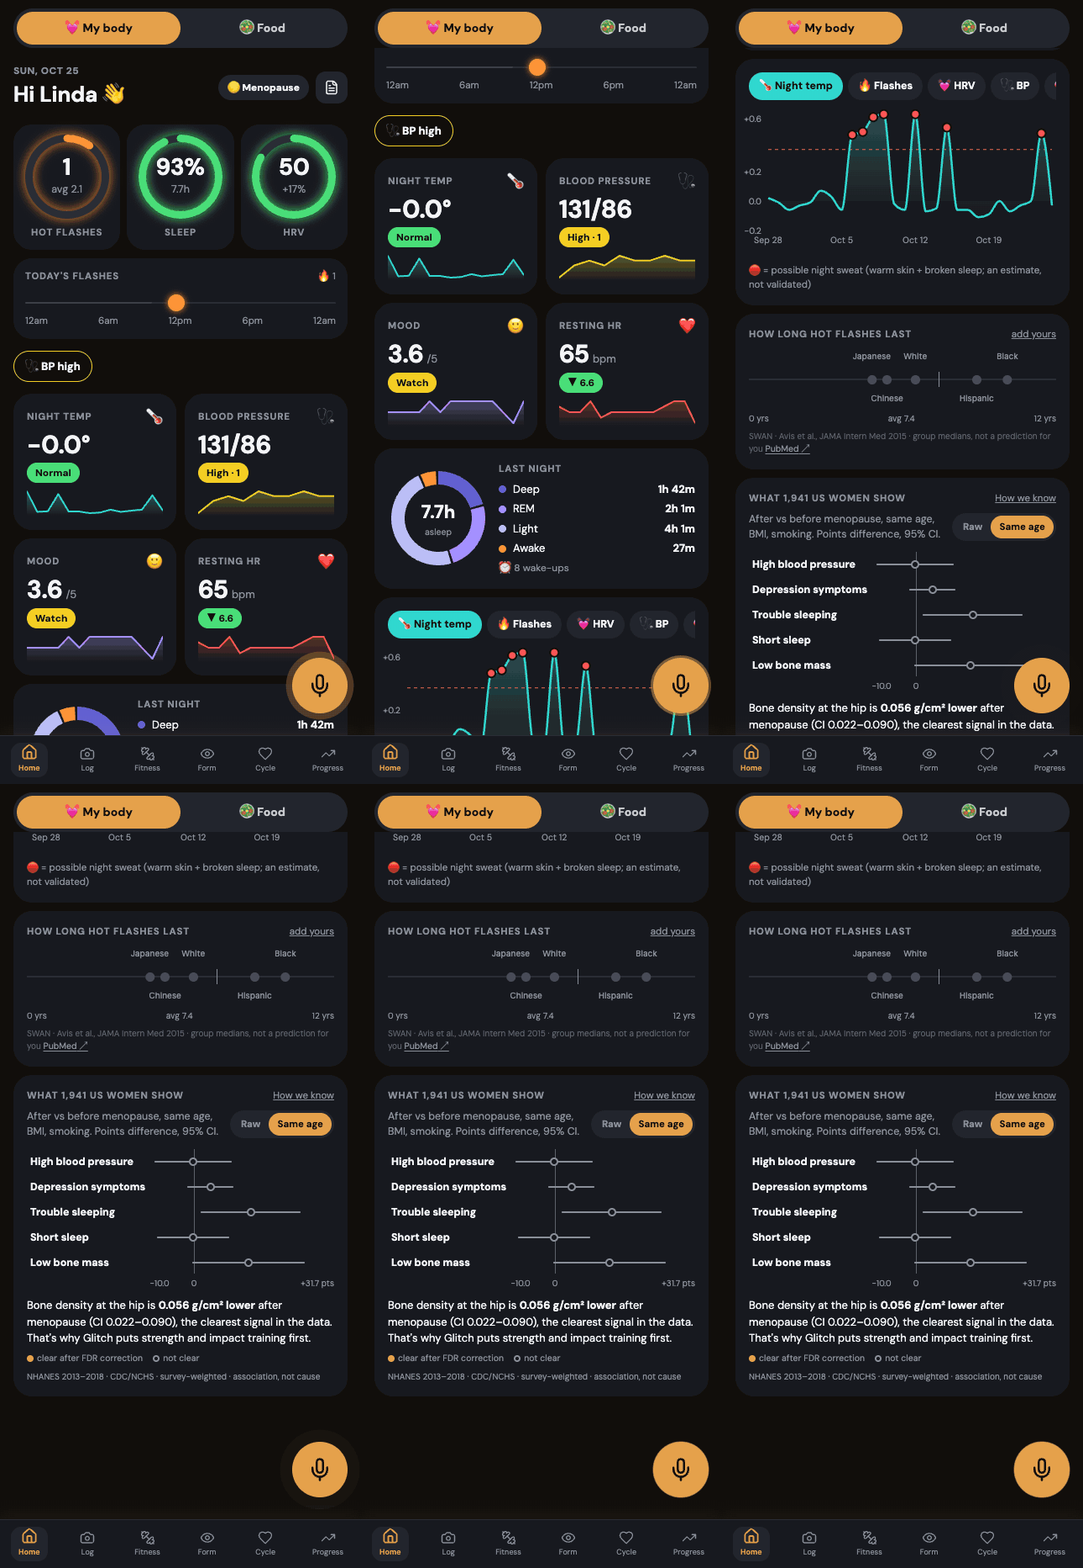
- One view of her body: hot flashes, sleep, HRV and blood pressure from a wearable, plus mood and possible night sweats.
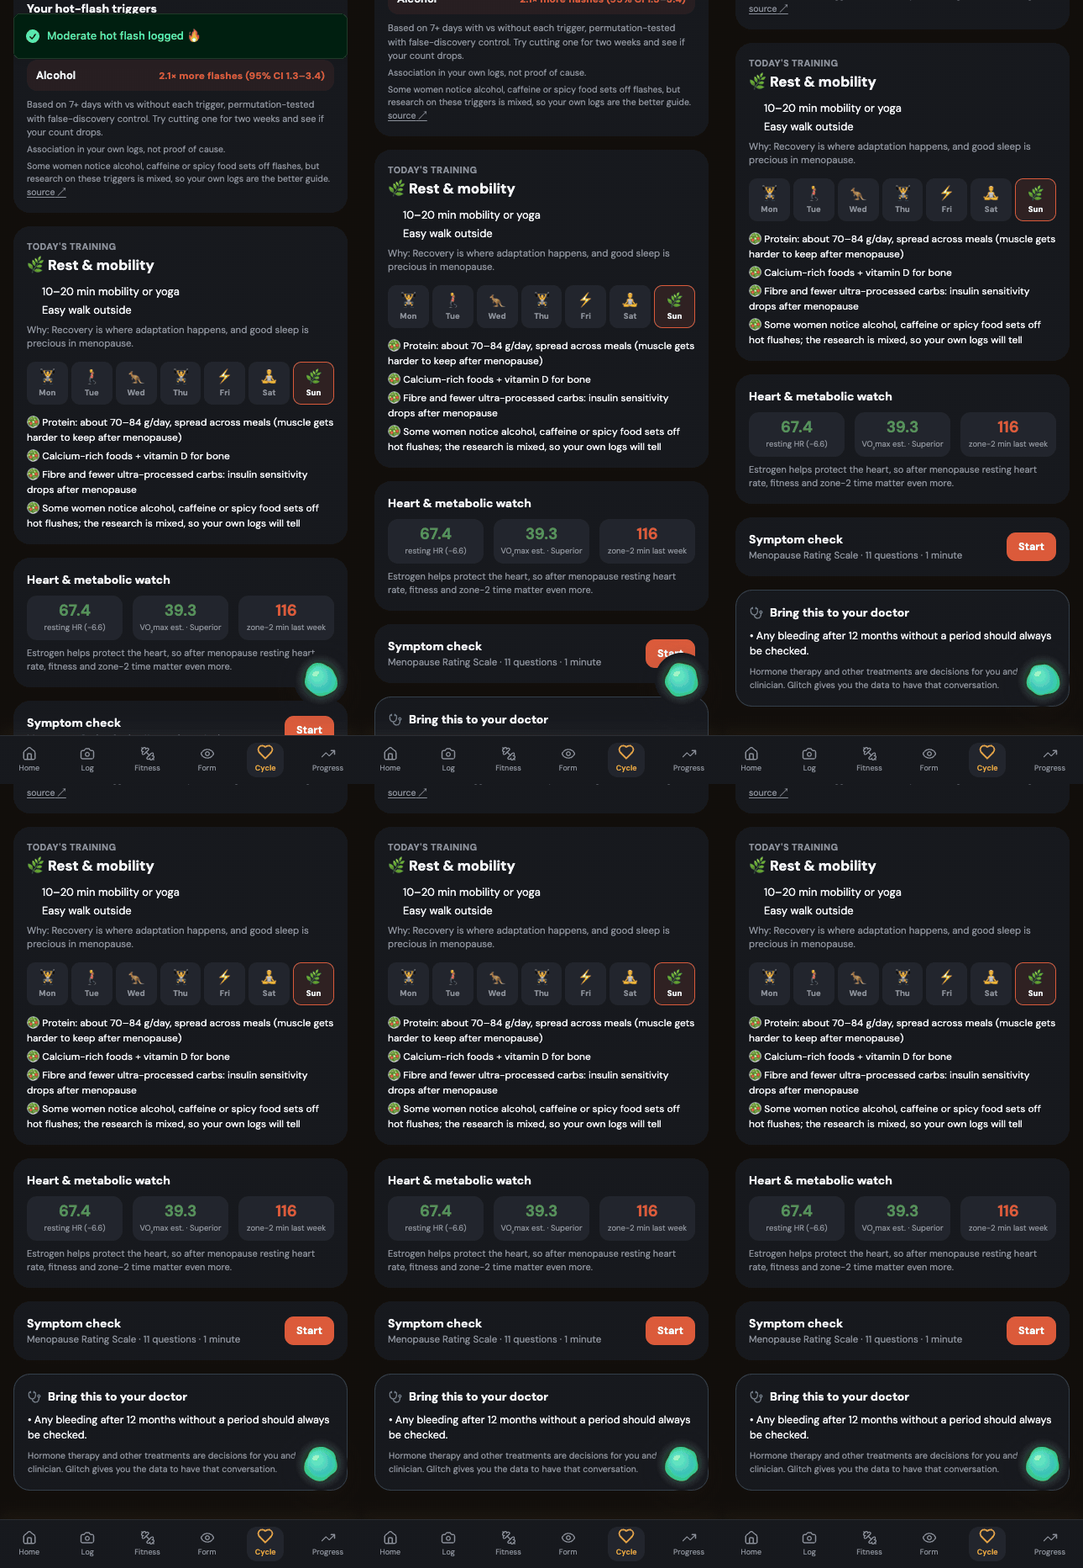
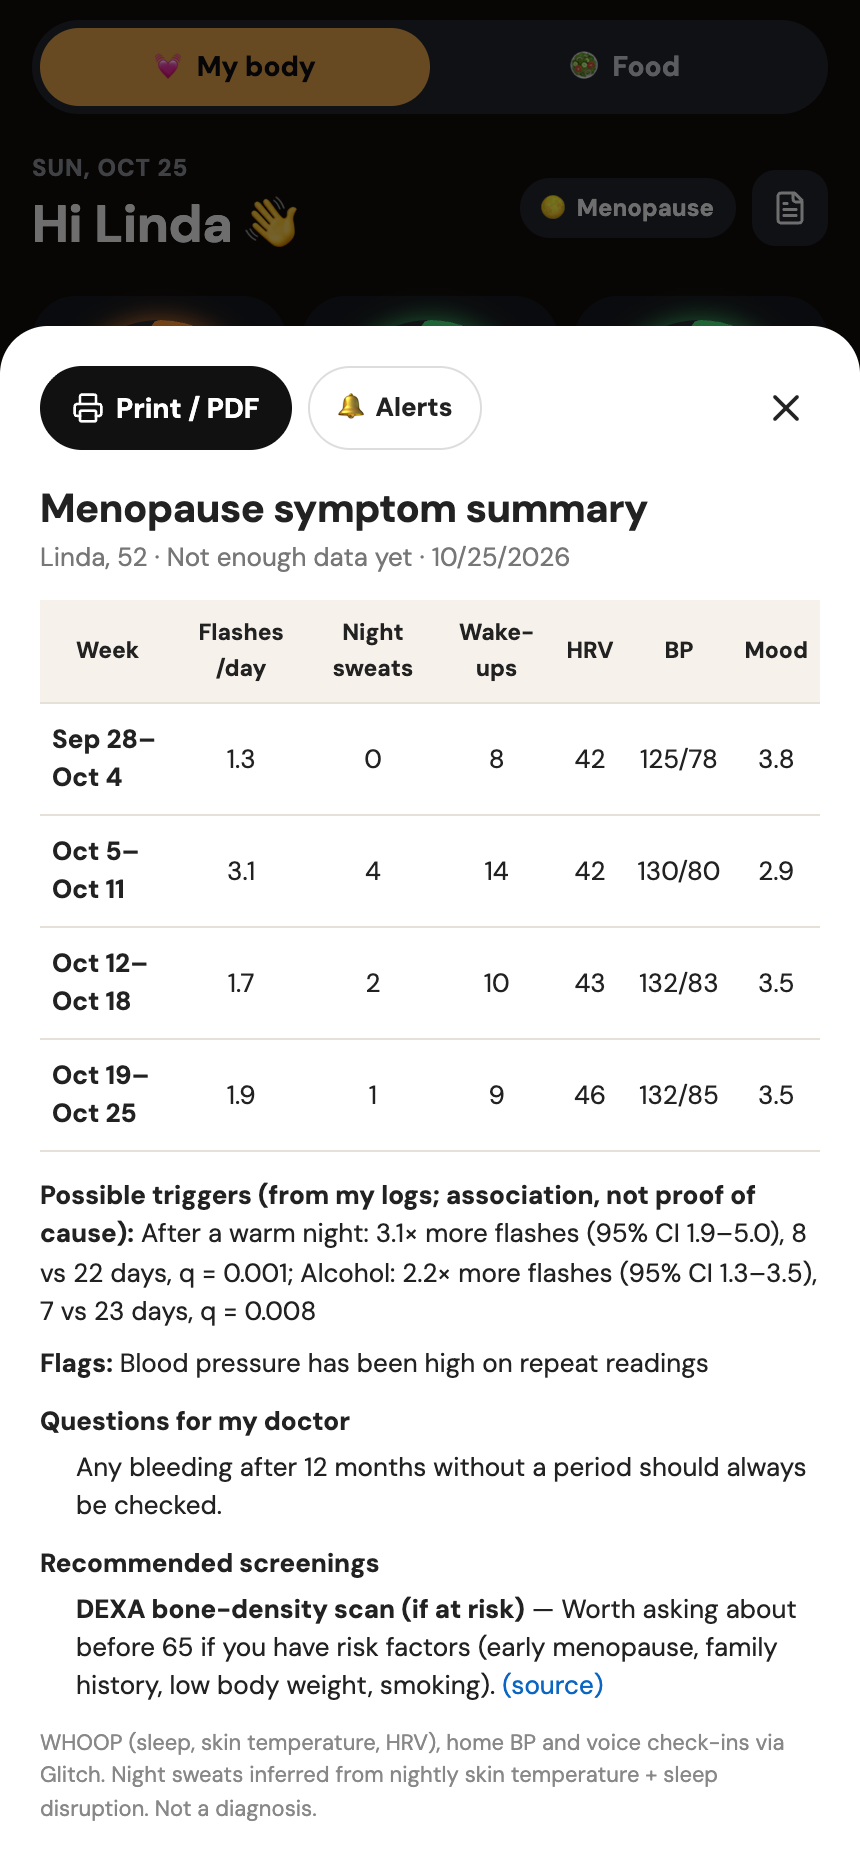
- Triggers tested on her own data: a trigger appears only when it passes a statistical test. Otherwise Glitch says "no clear link yet" and tells her how many more days of logging it needs.
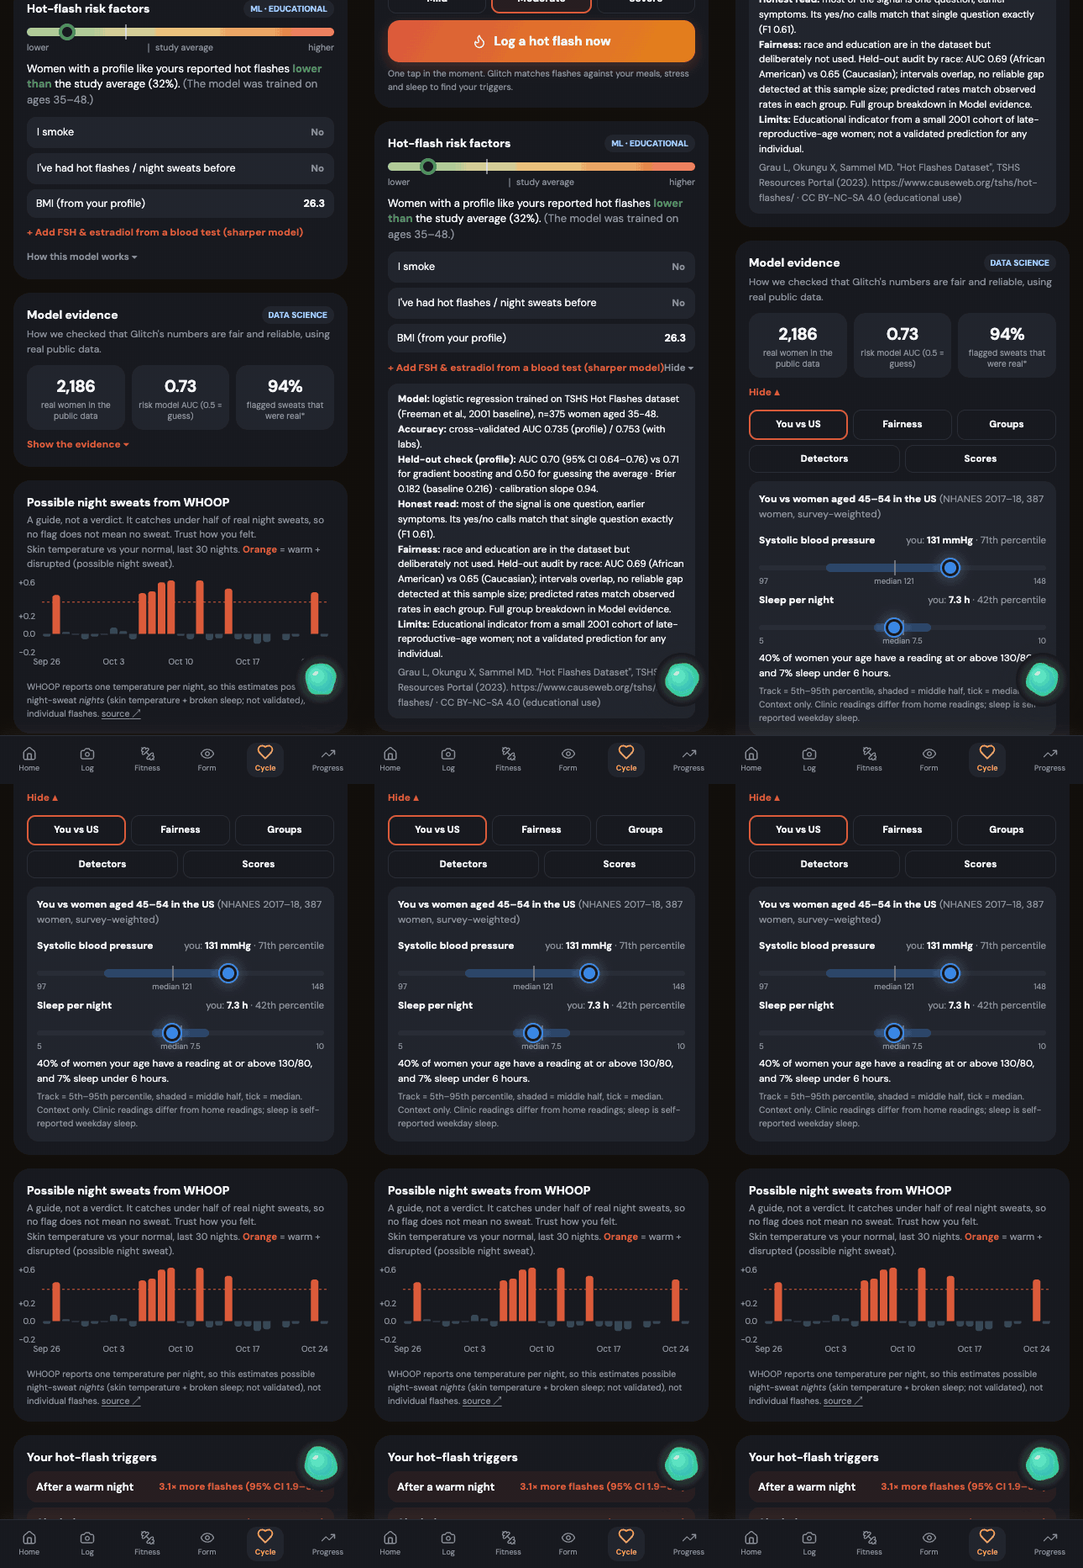
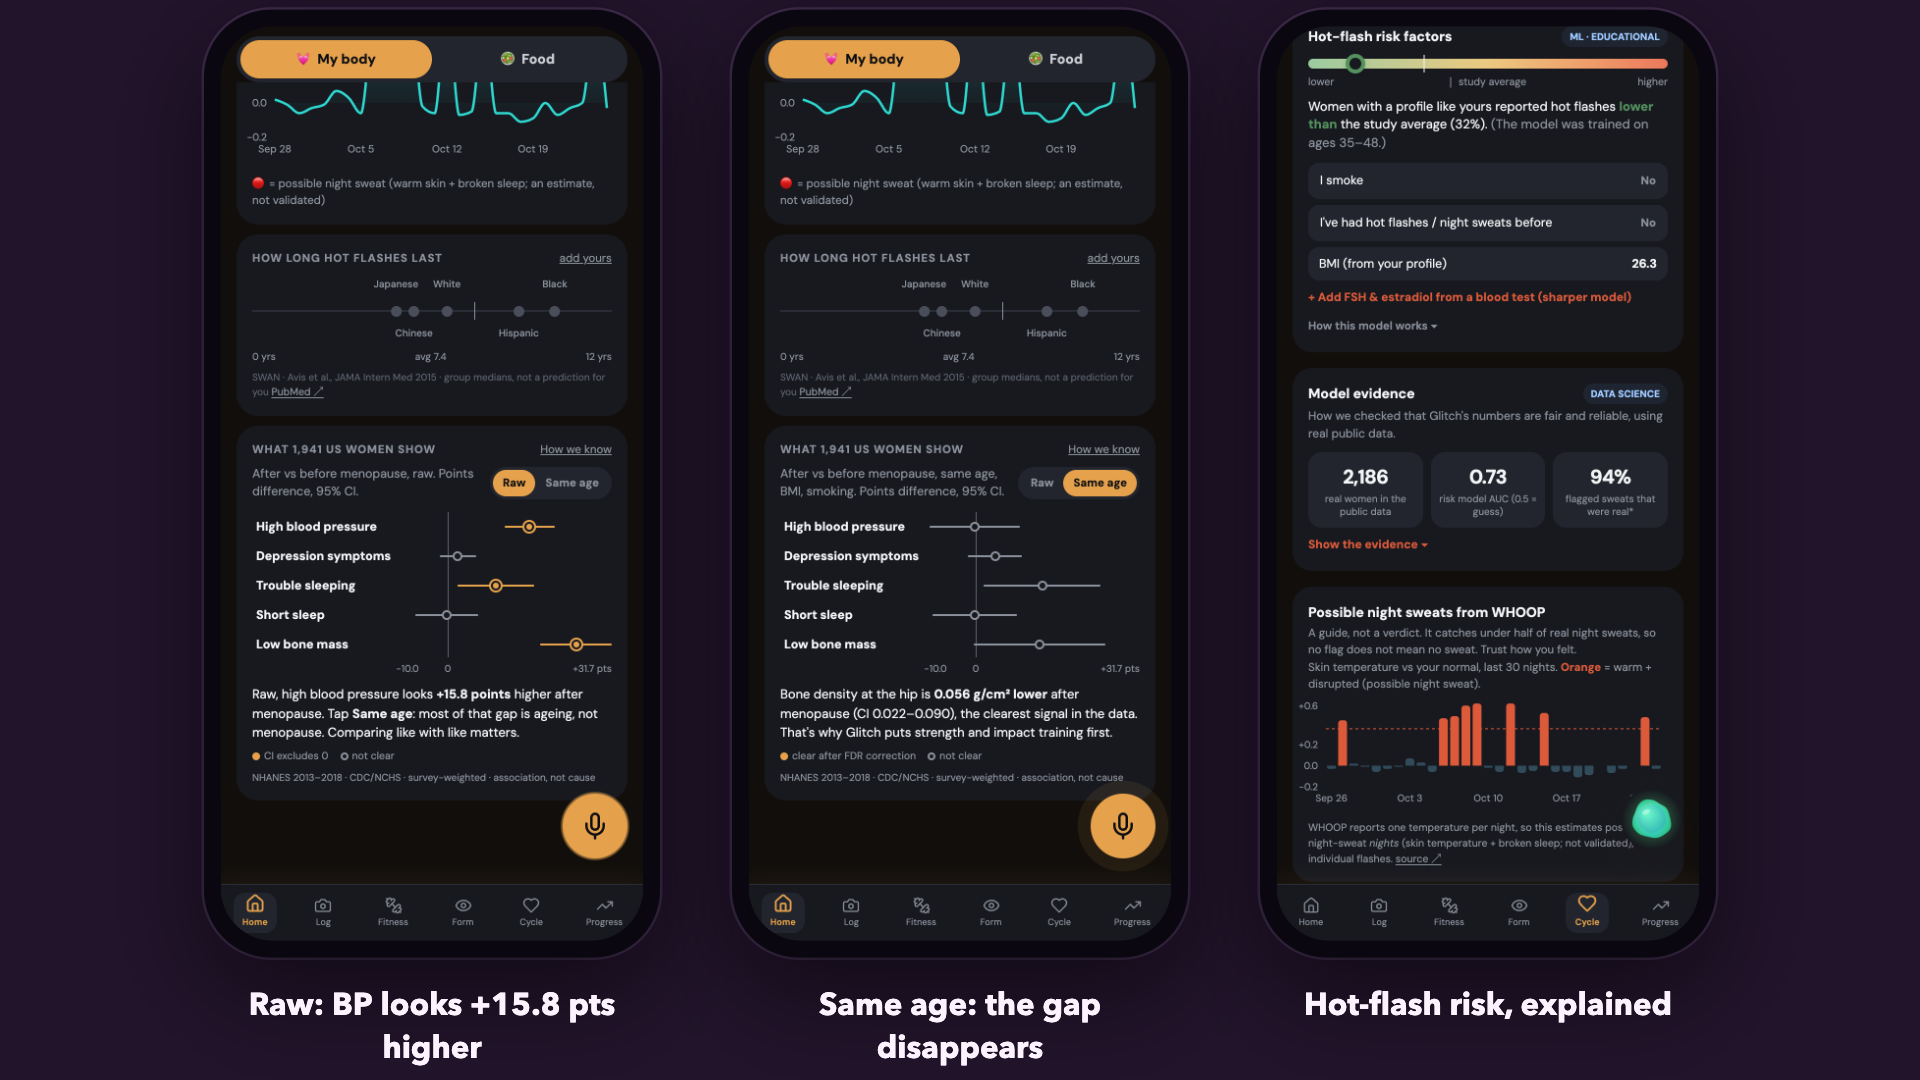
- Hot-flash risk, explained: a model trained on real cohort data, with a plain-language "What does this mean?" panel.
- What US women show: CDC data on how menopause relates to bone, blood pressure, sleep and mood. Doctor summary: one page with weekly trends, tested triggers and questions to ask.
- Private by design: everything is encrypted on her phone, with no central database.
How we built it
Datasets and research
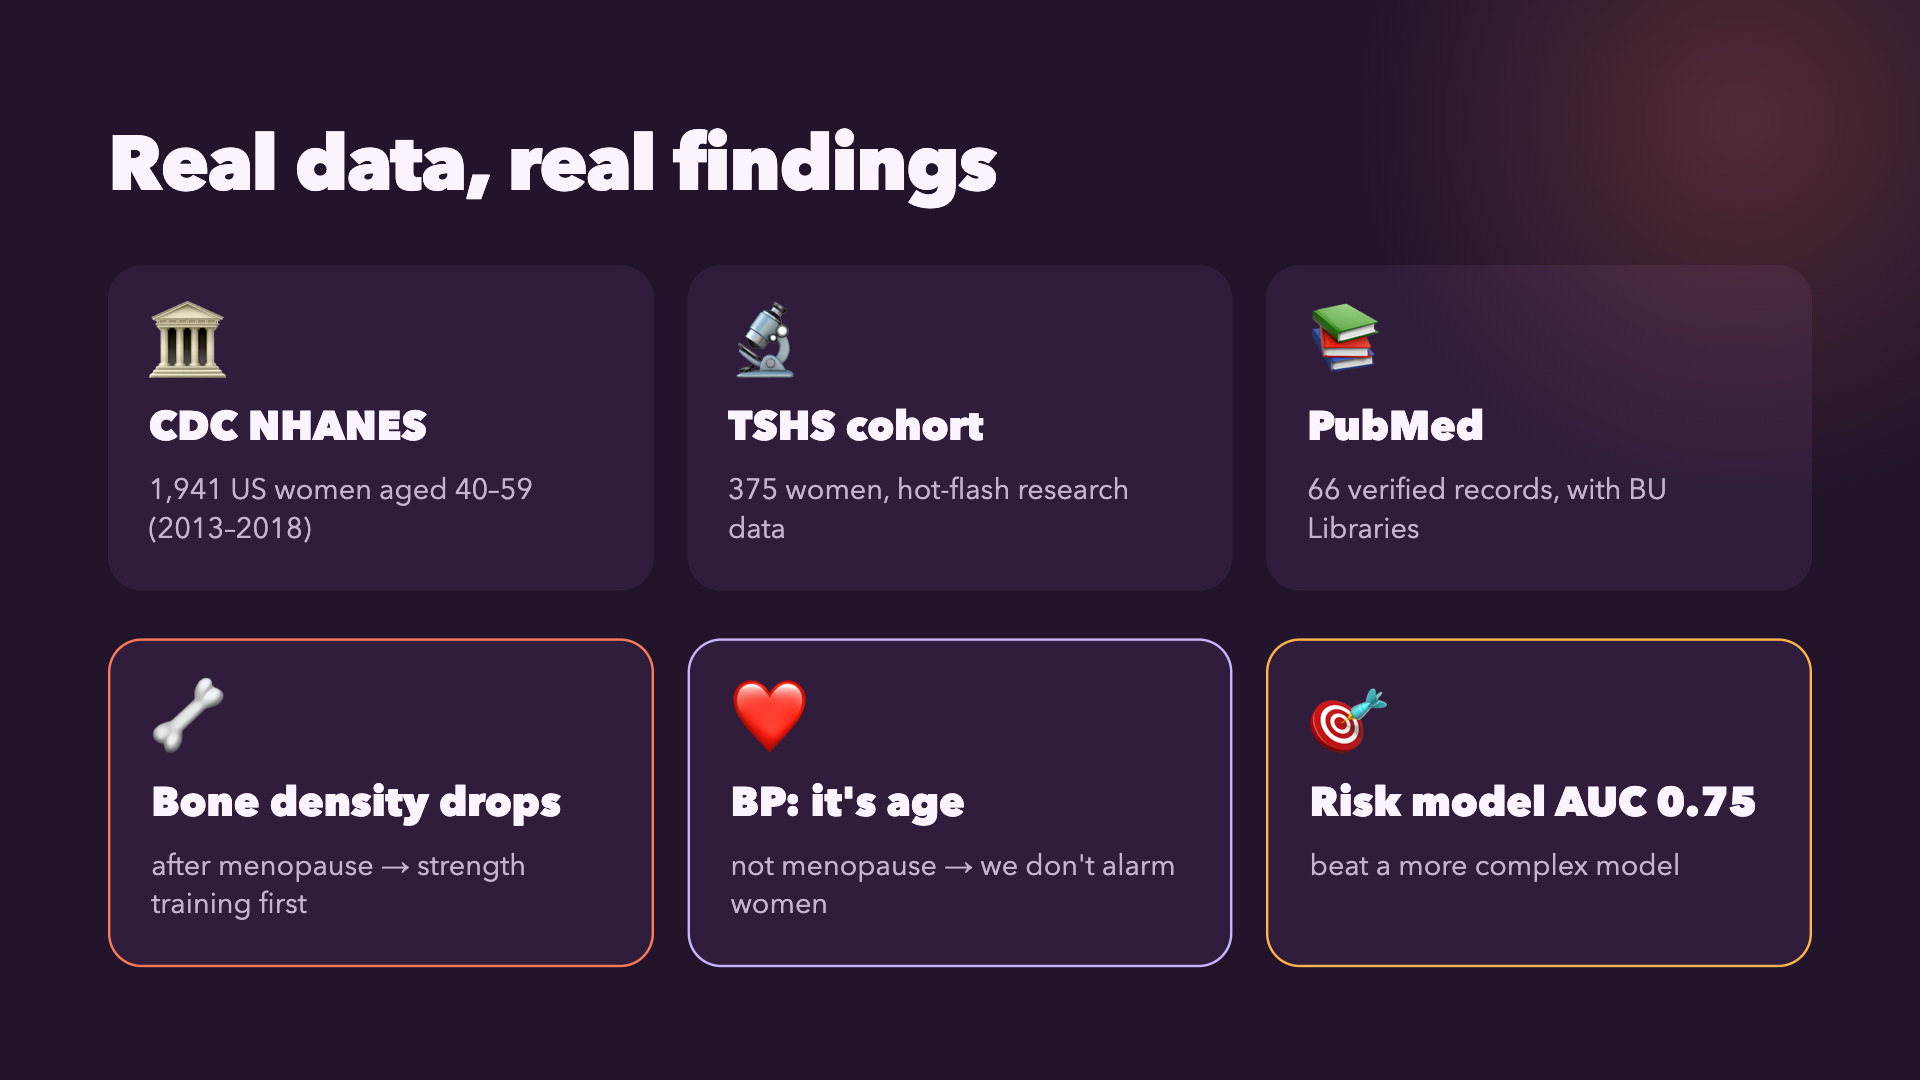
CDC NHANES 2013–2018: a national US health survey. We analysed 1,941 women aged 40–59, comparing before and after natural menopause. TSHS hot-flash cohort: 375 women with symptom and hormone data, used to train our risk model. PubMed: with guidance from BU Libraries, we backed every health claim in the app with peer-reviewed research (66 records).
What the research showed us
Hot flashes last a median of 7.4 years, longer for some groups (SWAN study). So Glitch is built for long-term tracking, not a quick fix. Bone loss is fastest around the final period. Our NHANES analysis confirmed bone density is $0.056\ \text{g/cm}^2$ lower after menopause ($q = 0.015$), so Glitch puts strength training first. Blood pressure: it looks 15.8 points higher after menopause in raw numbers, but $\text{OR} = 0.99$ once age is accounted for. It's ageing, so we don't alarm women about it. Hormone therapy and CBT are the evidence-based options for hot flashes, so the coach points women to these to discuss with a clinician. Earlier symptoms and FSH levels predict hot flashes most strongly, which shaped our risk model's inputs.
Population analysis: survey-weighted logistic regression, so results represent US women rather than just the sample:
$$\log\frac{p}{1-p} = \beta_0 + \beta_1\,\text{post} + \beta_2\,\text{age} + \beta_3\,\text{age}^2 + \beta_4\,\text{BMI} + \beta_5\,\text{smoker}$$
We used design-based standard errors and Benjamini–Hochberg correction across 8 outcomes. Our estimator matches the independent samplics library exactly.
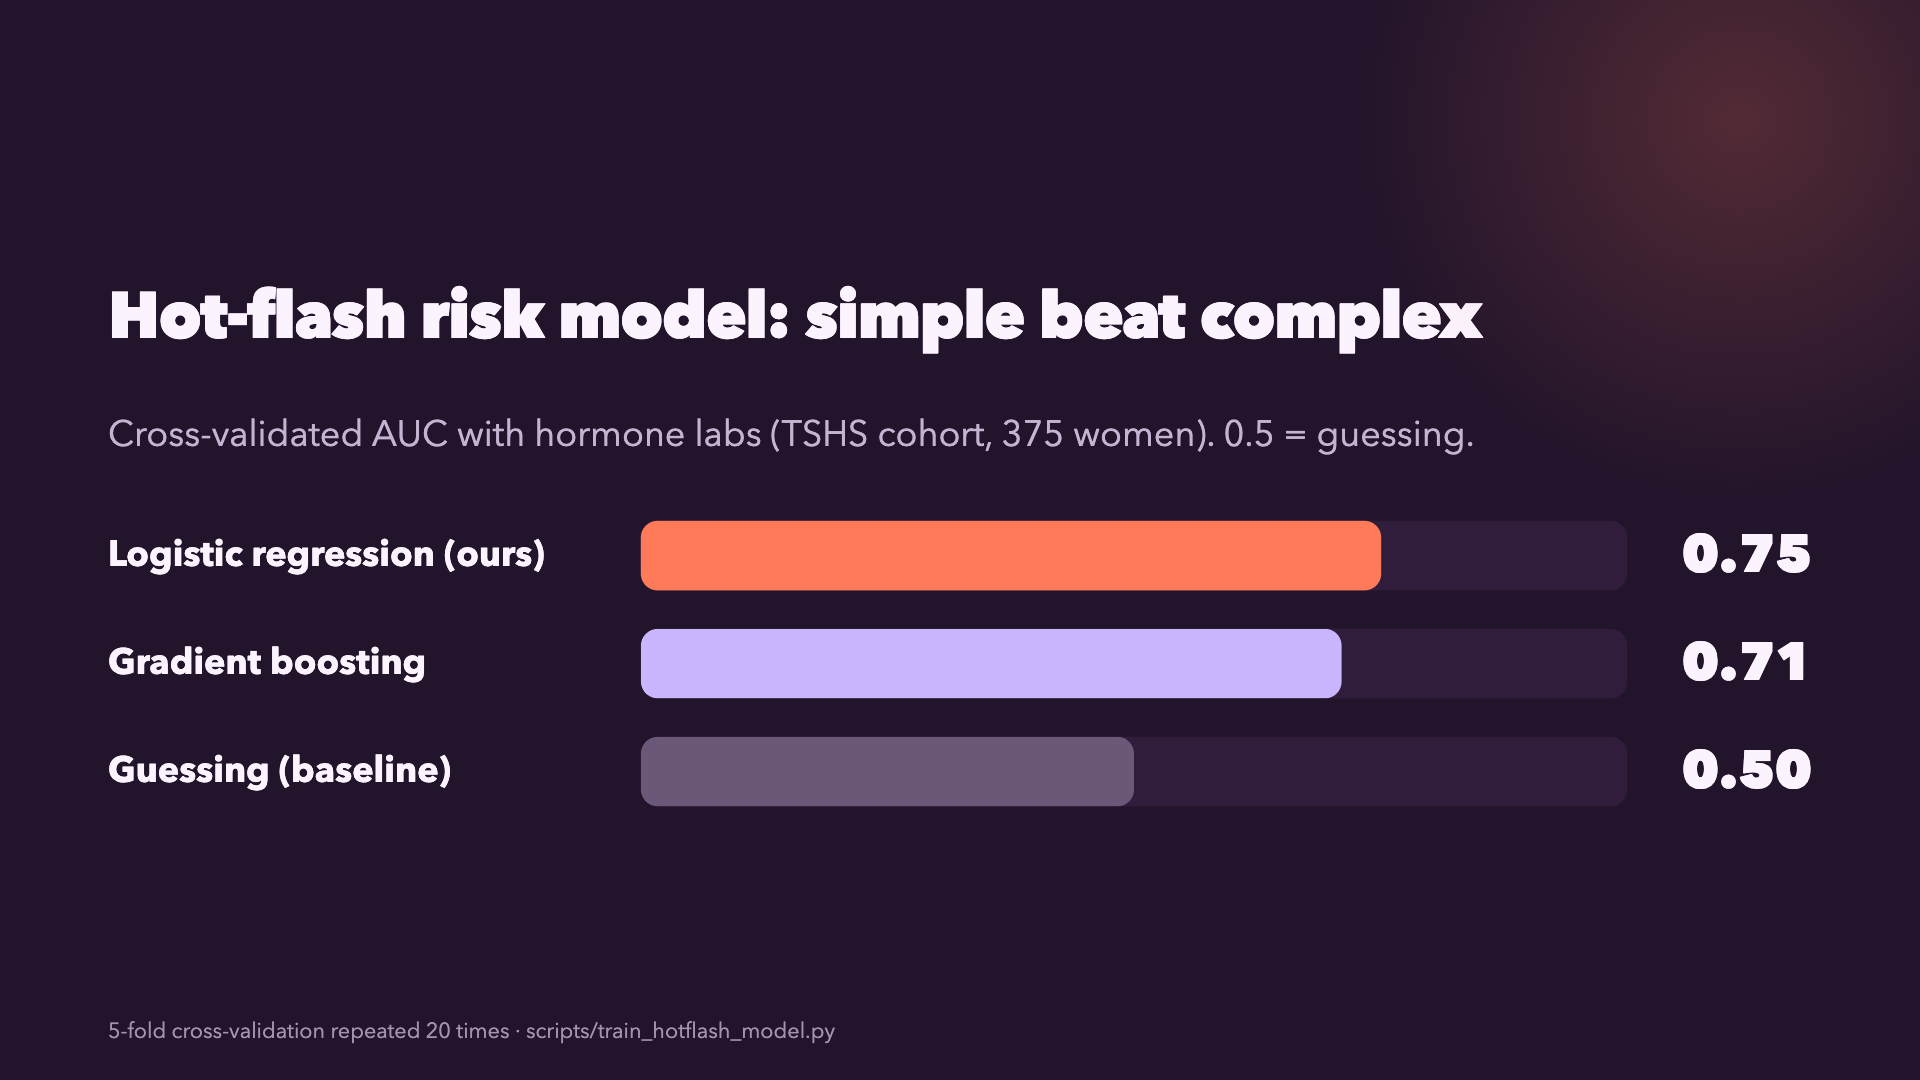
Hot-flash risk model: logistic regression vs gradient boosting vs a baseline, on repeated 5-fold cross-validation (20 repeats). Race and education are never inputs; they're used only to audit fairness.
Personal triggers: for each trigger we compare her flash rate on trigger days with other days:
$$\text{RR} = \frac{\text{flashes on trigger days} \,/\, n_{\text{trigger}}}{\text{flashes on other days} \,/\, n_{\text{other}}}$$
A permutation test with $B = 2000$ shuffles gives $p = \dfrac{1 + #{\text{shuffled} \ge \text{observed}}}{1 + B}$, and Benjamini–Hochberg controls false discoveries. A trigger is shown only if $q < 0.10$ and the lower bound of its 95% CI is above 1.
App:
React, TypeScript and Vite. MediaPipe and Web Speech, so camera and voice are processed in the browser. A Groq LLM coach behind a server-side proxy, grounded in the evidence library. AES-GCM encryption on the device, with no backend database.
Challenges we ran into
Finding the right data: a lot of women's health data isn't public. The Apple Women's Health Study, for example, has no open participant data, so we worked with BU Libraries to find reliable public sources like CDC NHANES. Getting the statistics right: national survey data needs special weighting to represent all US women. Learning to apply it correctly, and checking our results against an independent library, took real effort. Bringing different data together: survey data, a research cohort and a woman's own daily logs all come in different shapes, and we had to make them work in one app. Making statistics feel human: turning odds ratios and p-values into plain sentences a woman can understand in a few seconds took many rewrites. Building it in a weekend: voice logging, wearable data, the analysis and the doctor summary all had to come together in under 36 hours.
Accomplishments that we're proud of
We built something we'd want our own moms to use. Glitch is voice-first, simple, and it explains itself in plain language. Our data changed our product. NHANES showed bone density really drops after menopause, so Glitch puts strength training first. It also showed blood pressure tracks age, not menopause, so we don't scare women about it. Simple beat complex. Our hot-flash risk model reached $\text{AUC} = 0.75$ with hormone labs, beating a more complex gradient-boosting model (0.71). A trigger test that only shows what's real. It tests each woman's own logs, and when there's no clear pattern it says so. Every claim backed by research. We worked with BU Libraries to link every claim to one of 66 PubMed records. Private by design. Her data stays encrypted on her phone, with no central database. We built it all in one weekend, with 208 automated tests behind it
What we learned
We came in thinking menopause was mostly hot flashes. The more we read, the more we realised how much women go through quietly: years of broken sleep, mood changes, bone loss. And so much of it gets brushed off as "just age." That changed how we saw the people in our own lives.
The data surprised us too. We expected to find that blood pressure jumps after menopause, because that's what the raw numbers said. Then we compared women of the same age and the gap disappeared. That moment taught us to question the first answer the data gives you.
We also learned that a simpler model can be the better one, and that saying "we're not sure yet" is often more helpful than a confident guess. Most of all, we learned that building for women's health means listening first. Every screen we designed started with one question: would this actually help someone feel understood?
What's next for Glitch: Find the Bug, Fix Your Health
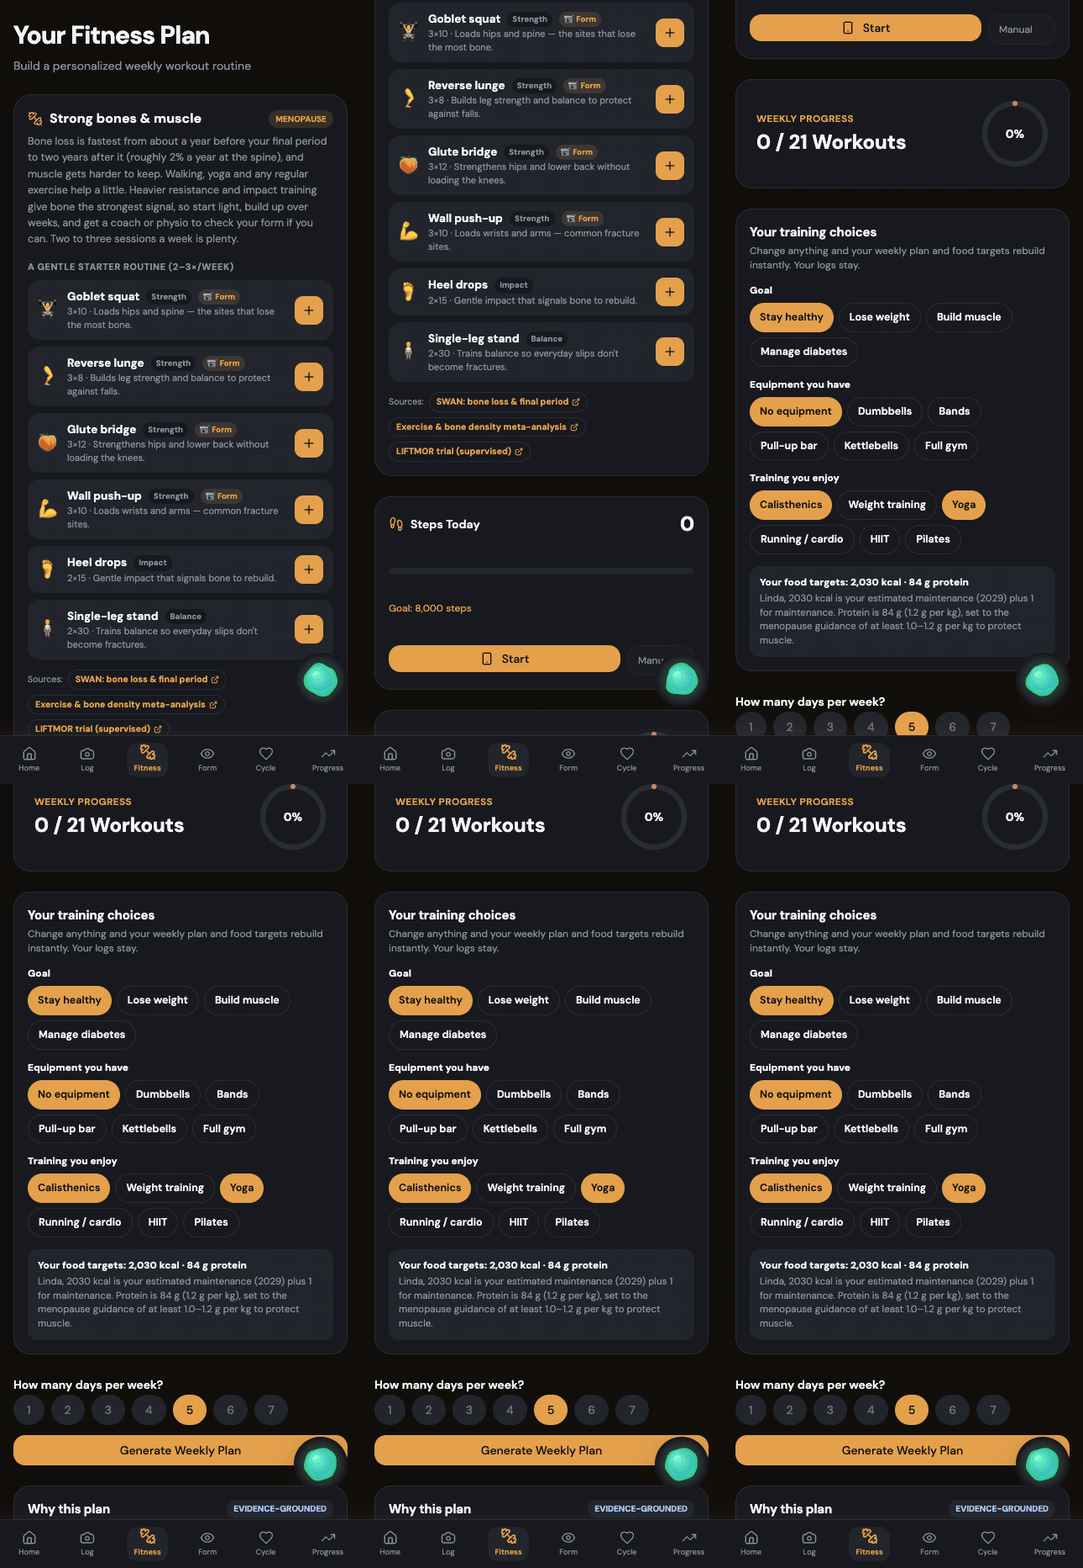
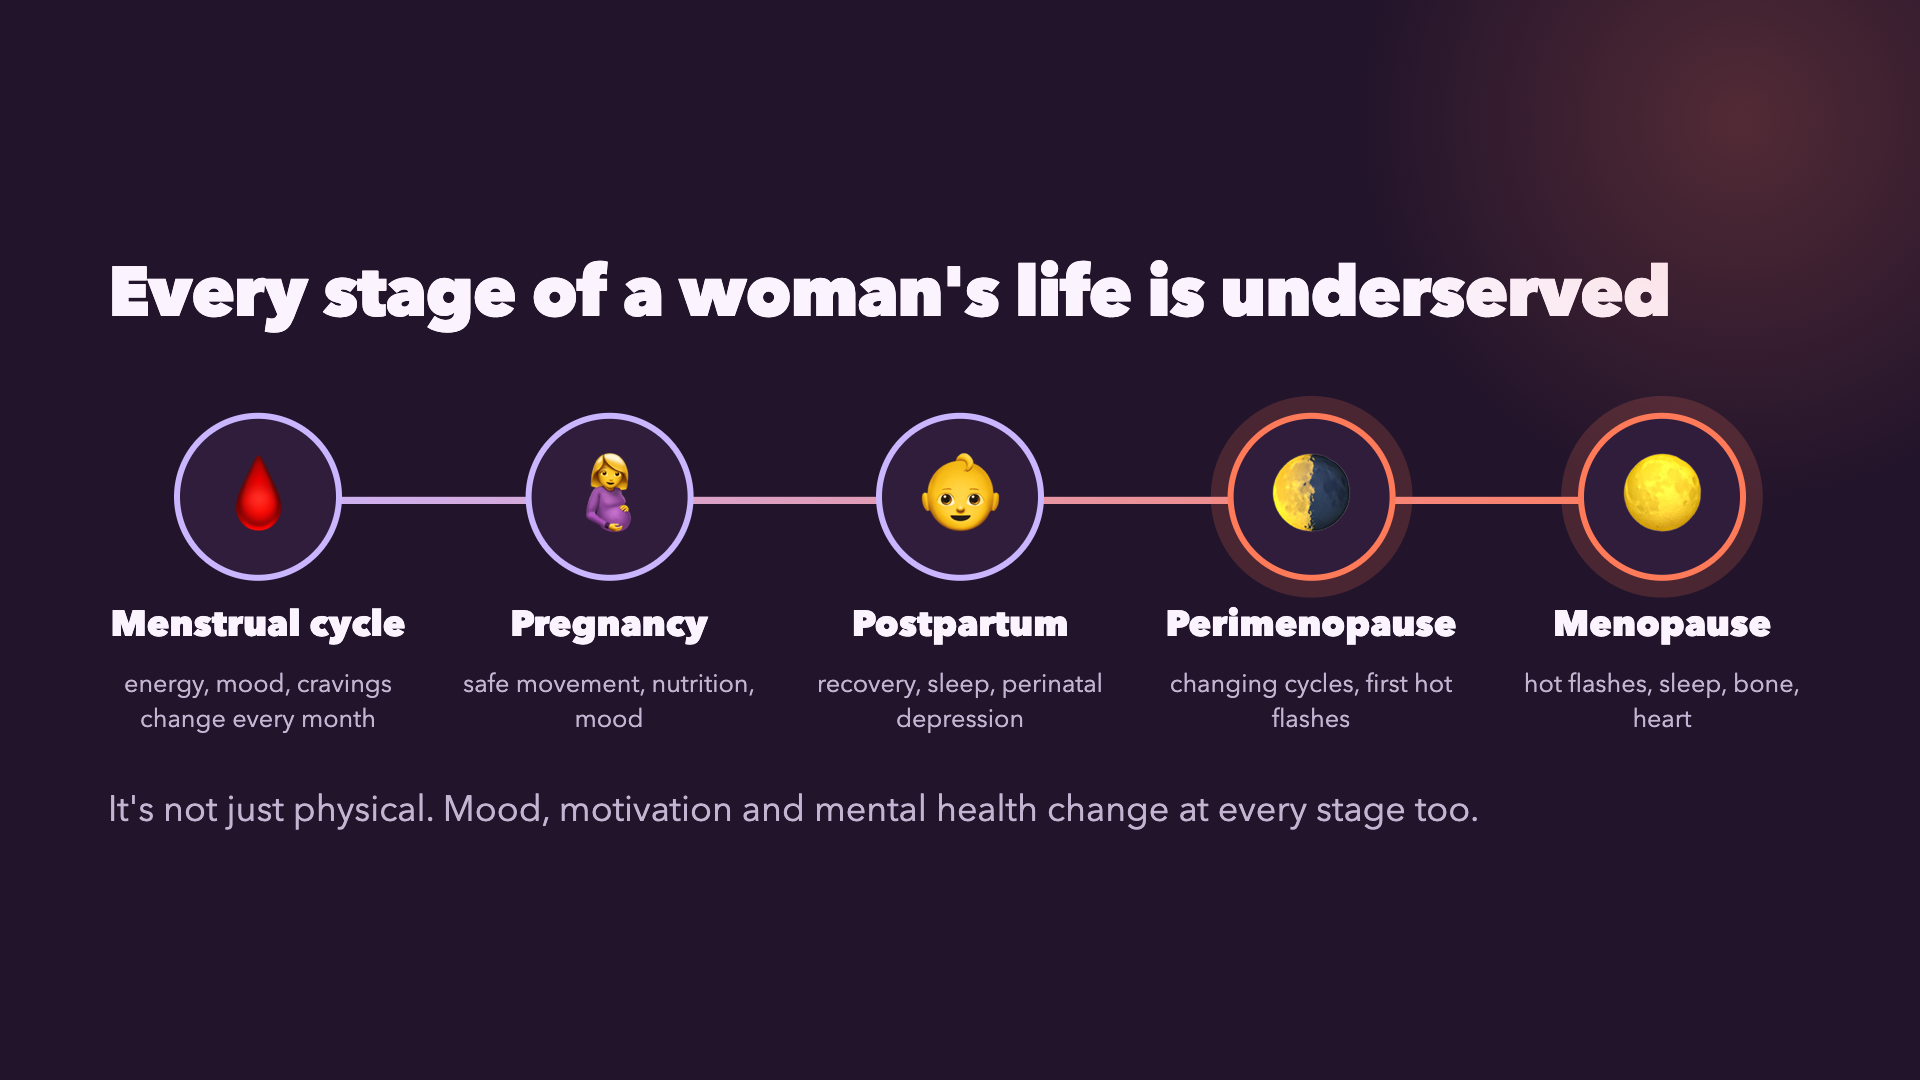
Full WHOOP integration. Connect live to the WHOOP API so sleep, HRV, skin temperature and recovery sync automatically, with no manual logging. More participants. Recruit women in perimenopause and menopause for a pilot study, so the models learn from more real data and work well across more women. A smarter fitness plan. Fine-tune workouts to each woman's recovery, symptoms and goals, so the plan adapts day by day instead of following a fixed schedule. Work with clinicians. Co-design the doctor summary with menopause specialists, so it fits how appointments actually work. Support every stage of a woman's life. Bring the same approach to periods, pregnancy and postpartum. We've already started building it.
Built With
- claude
- express.js
- figma
- framer-motion
- groq
- mediapipe
- nhanes
- node.js
- numpy
- pandas
- pubmed
- python
- react
- recharts
- render
- samplics
- scikit-learn
- scipy
- tailwindcss
- typescript
- vite
- vitest
- web-speech-api
- whoop

Log in or sign up for Devpost to join the conversation.