-
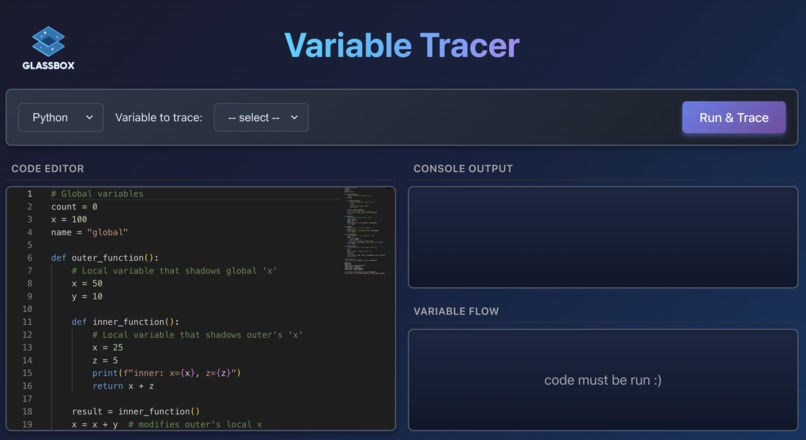
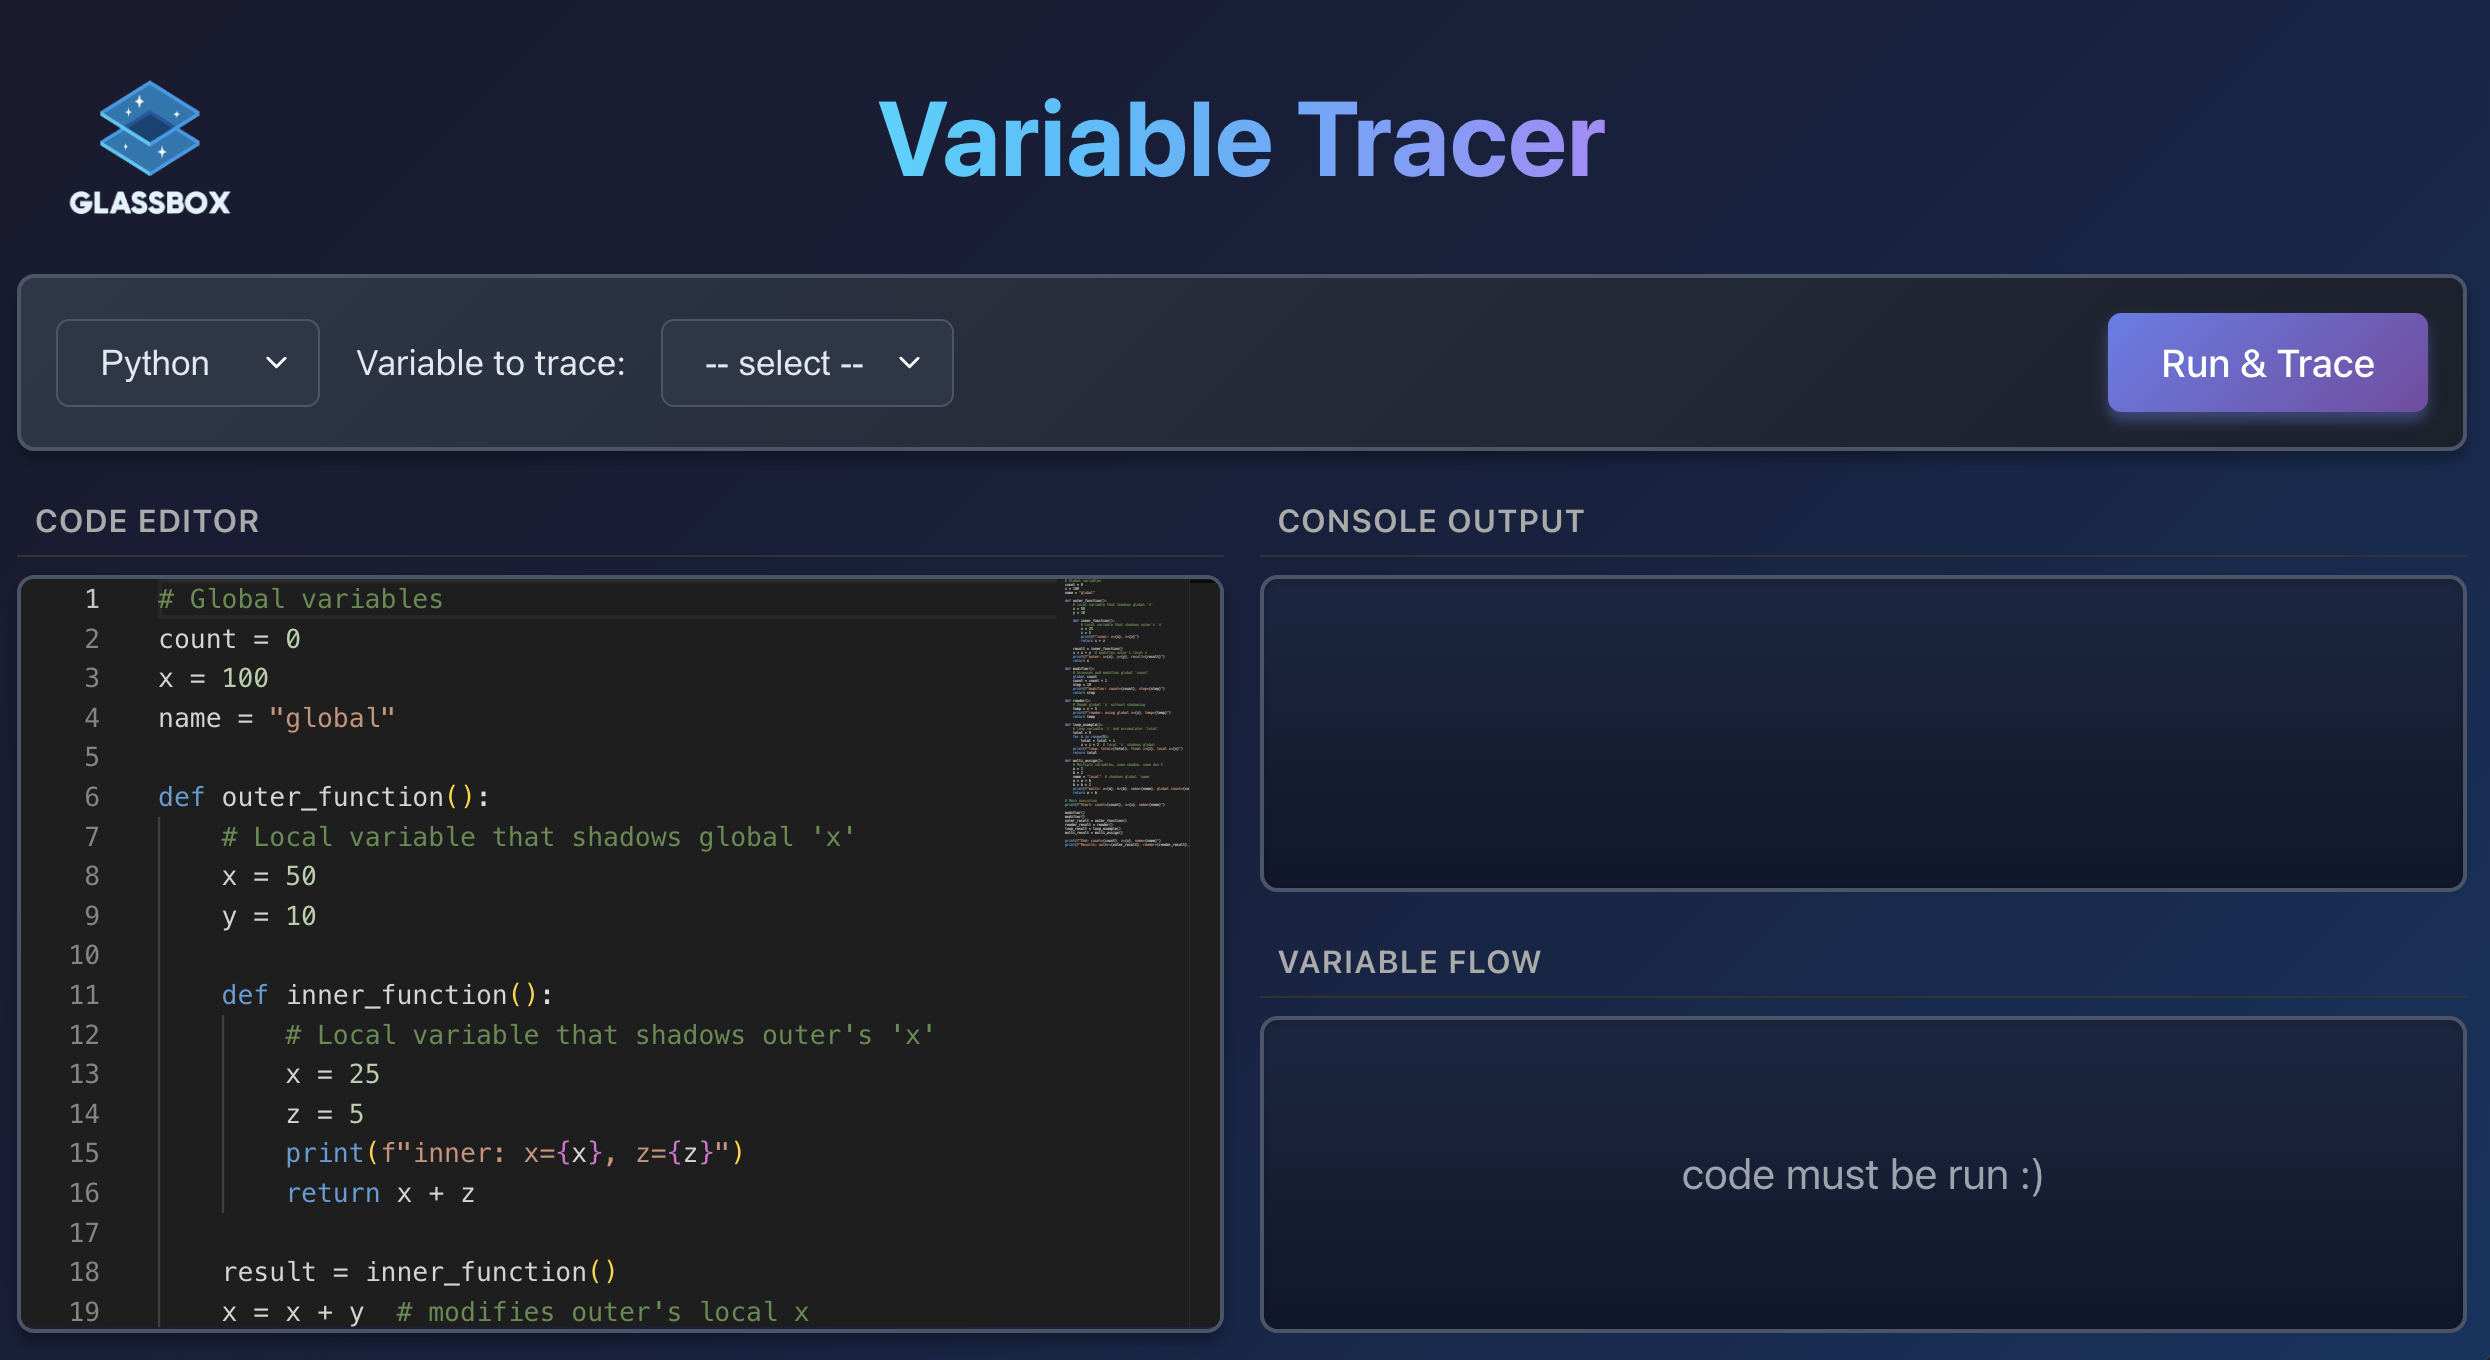
Landing page.
-
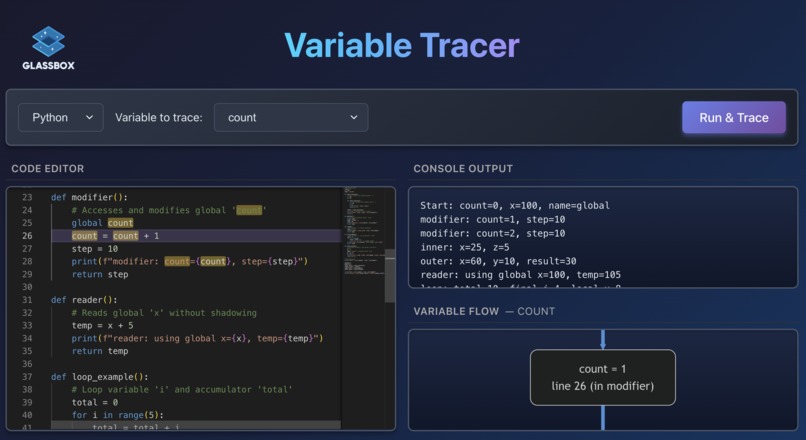
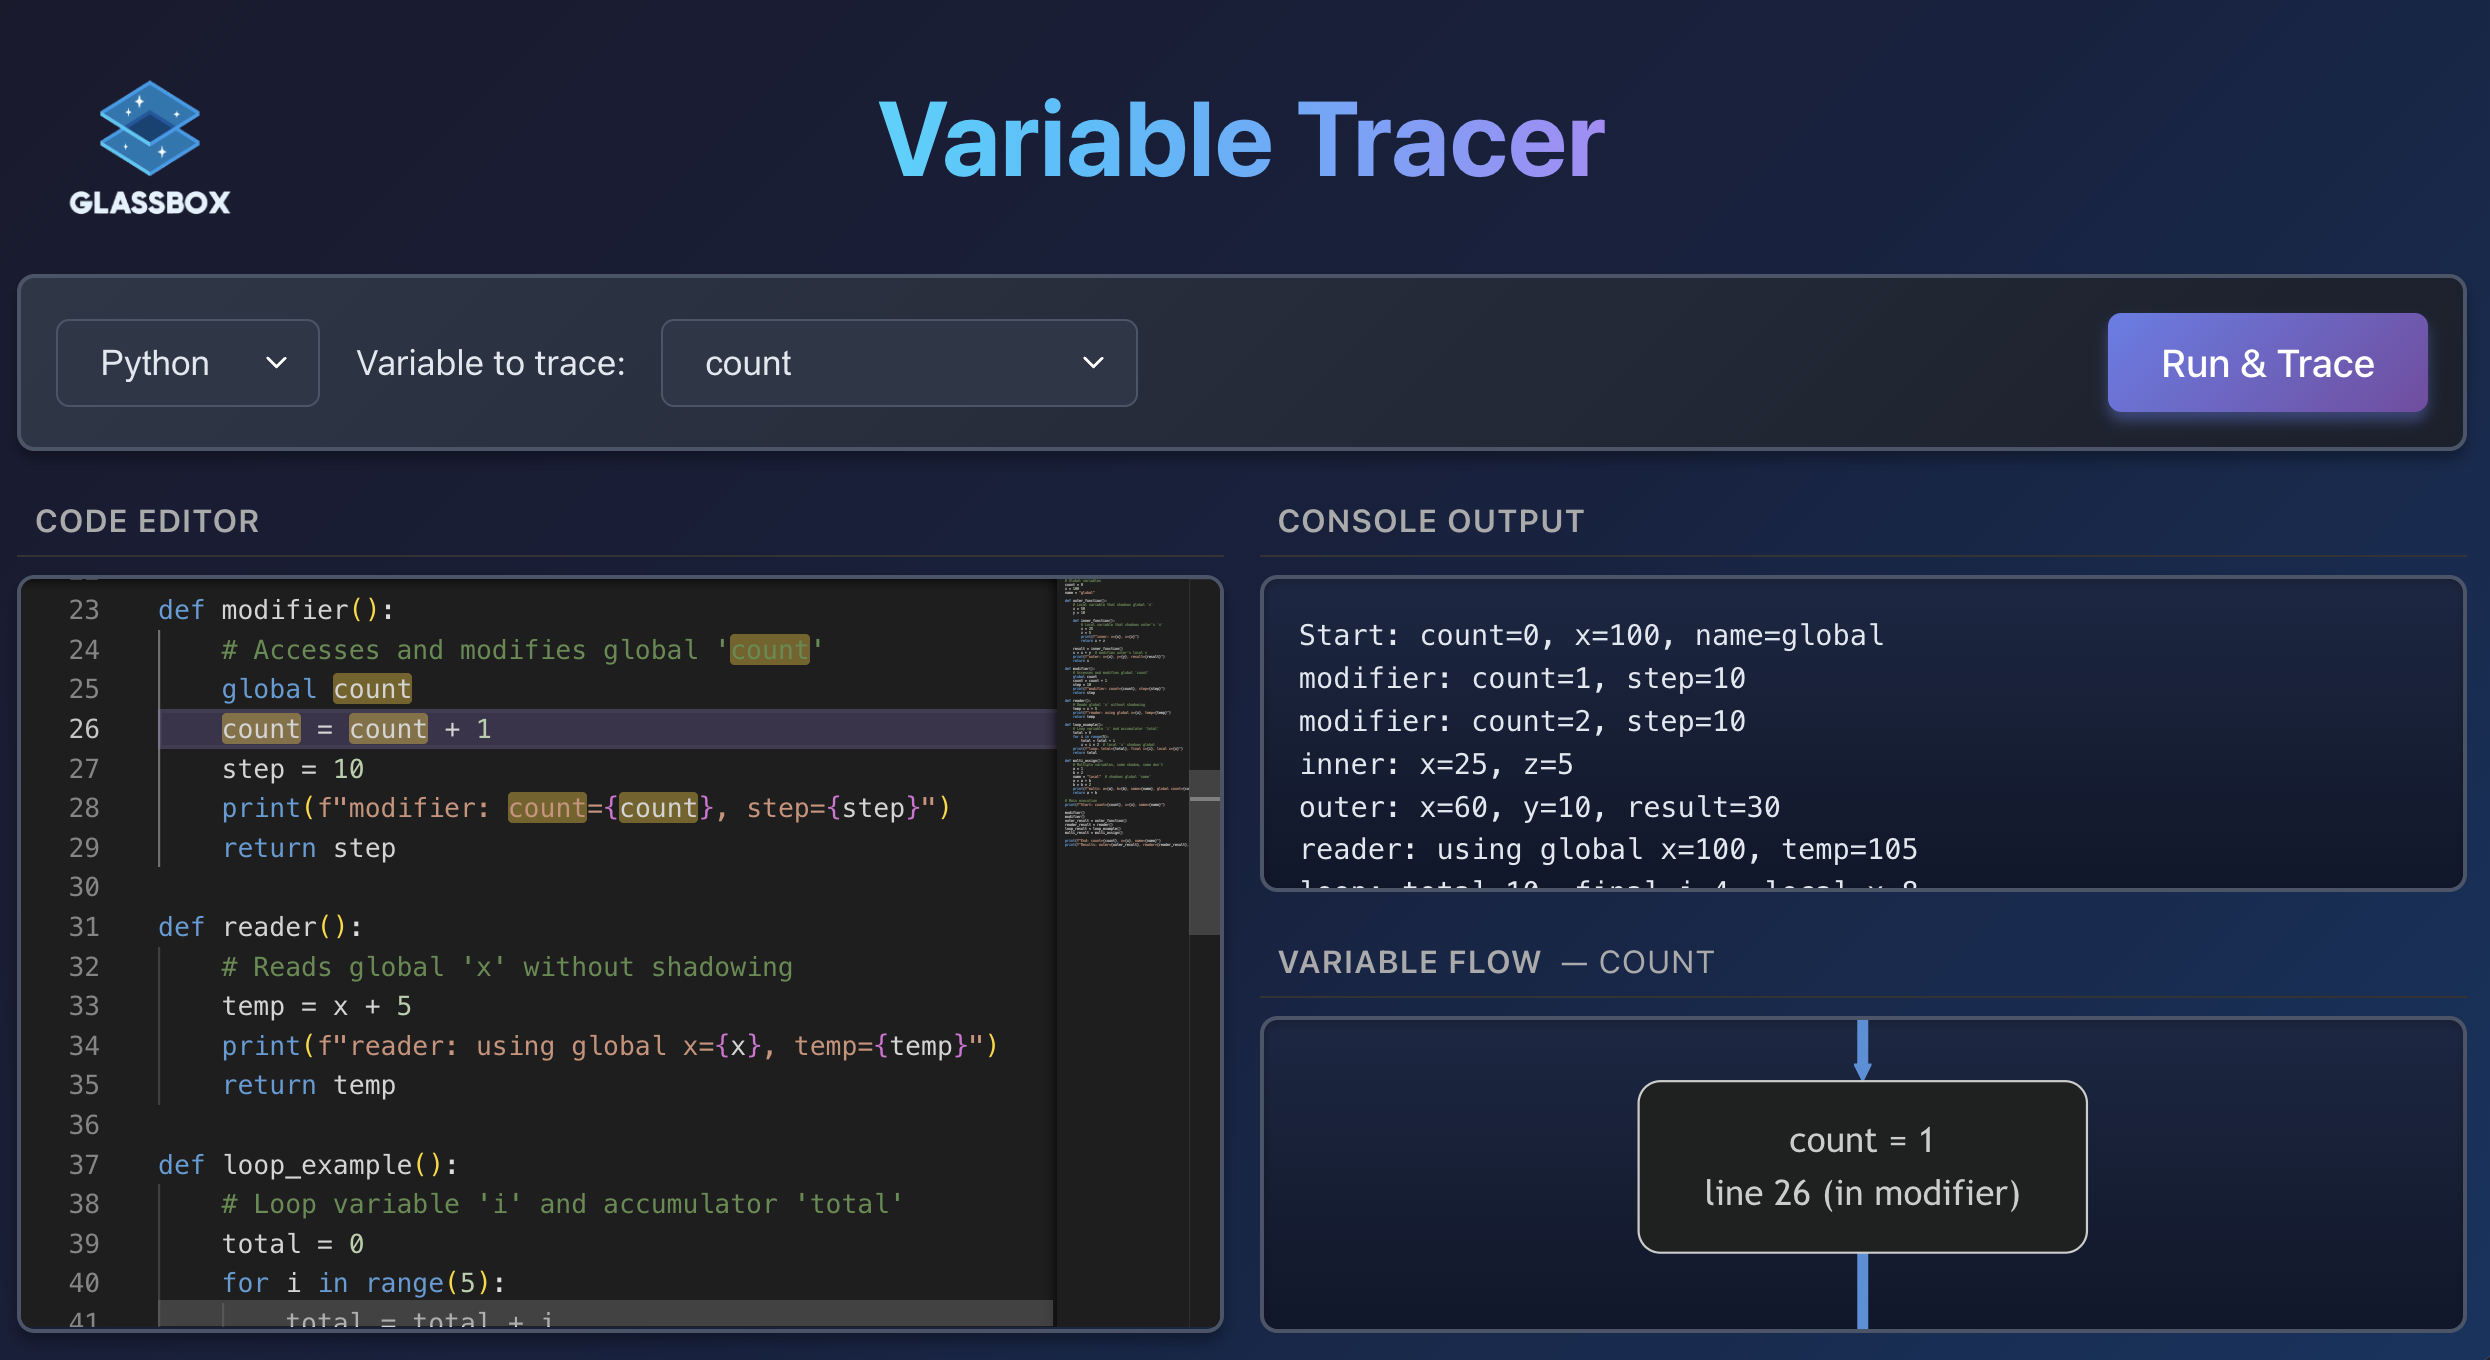
Highlighting the 'count' variable.
-
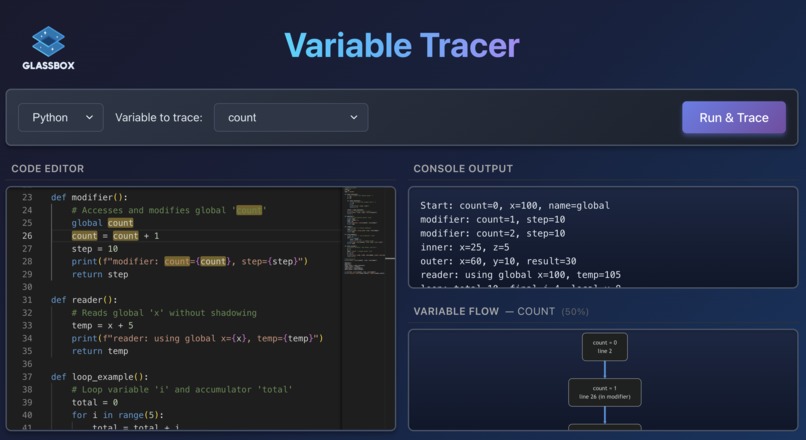
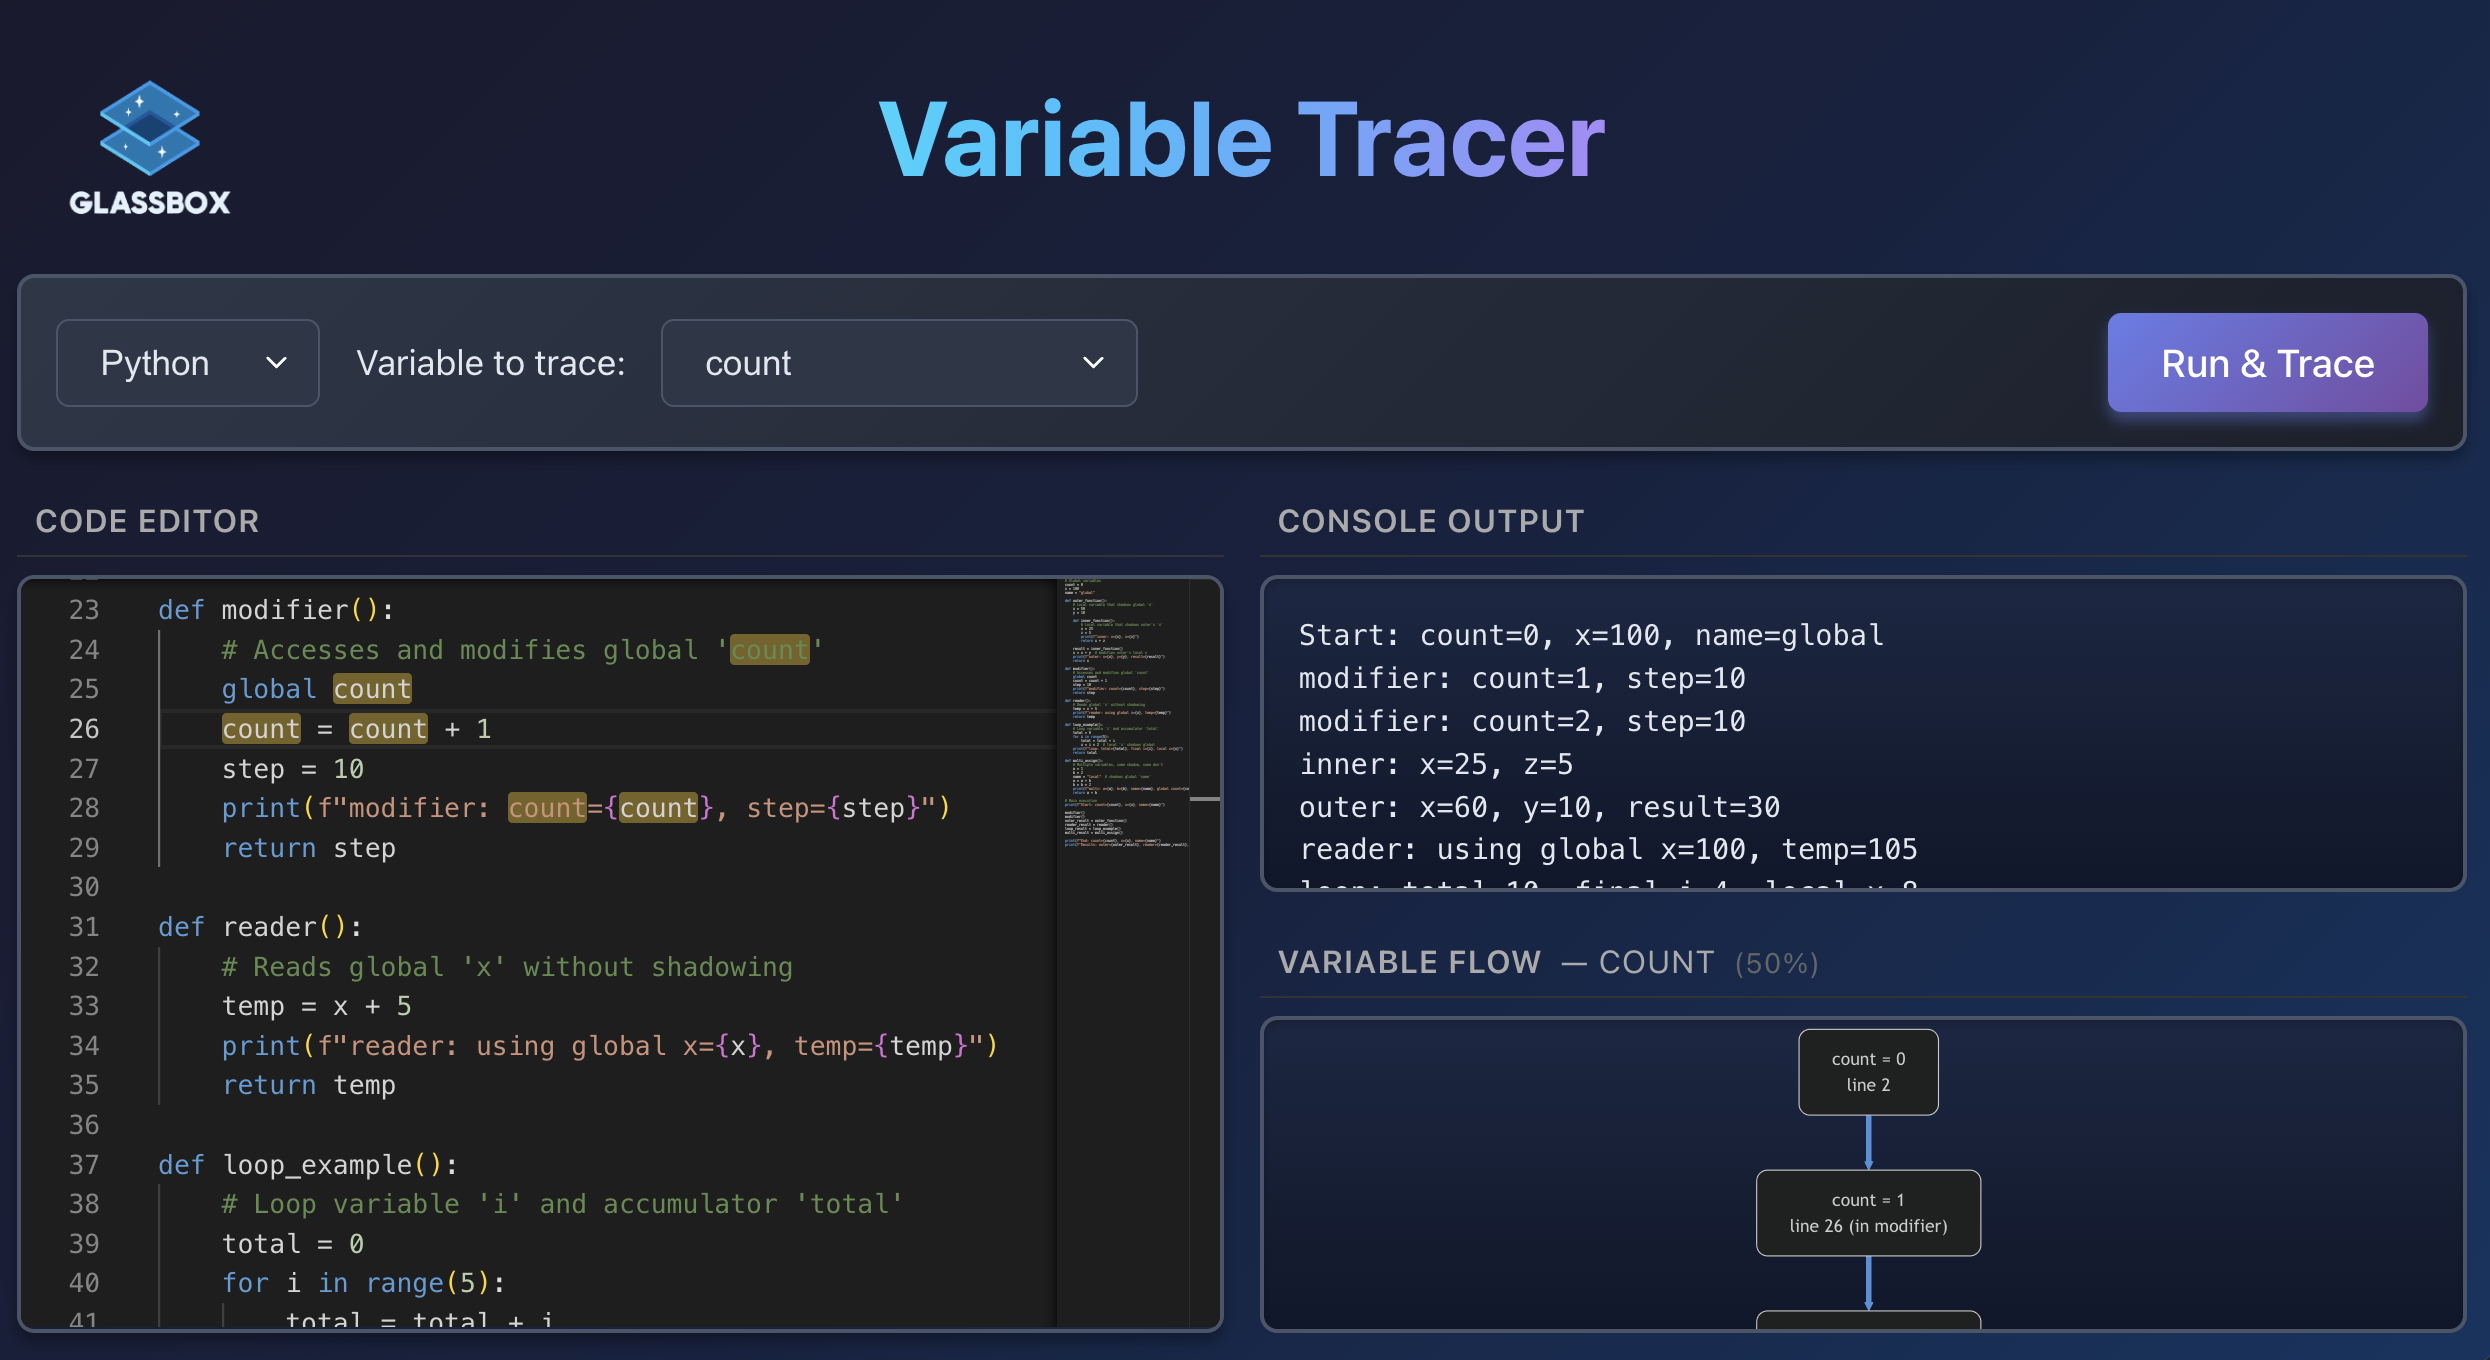
Zooming out the variable flow chart.
Inspiration
Debugging is an everyday problem for developers and computer science students. Some of the hardest bugs aren’t syntax errors: the code runs, but the logic is wrong. When that happens, it’s often unclear how values reached their current state, even if you roughly know where things start to go wrong. In practice, this leads to excessive print statements or stepping through code line by line, which quickly becomes slow and overwhelming as programs grow. While AI tools can sometimes help, they are not always reliable for understanding execution and often change the original code. As a team of computer science students, we repeatedly ran into this exact problem ourselves. We wanted a tool that doesn’t guess or rewrite logic, but instead shows exactly what the program does. That motivation led us to build GlassBox.
What it does
GlassBox is a web-based developer tool that helps programmers understand how variables change throughout program execution. It traces variable assignments and visualises the flow of values over time in an interactive diagram. Users can select or highlight specific variables directly from the code editor to focus on the parts of execution that matter to them.
How it works
Users write Python code in a Monaco Editor embedded in the browser. The code executes entirely client-side using Pyodide. During execution, a custom Python tracer built on sys.settrace captures variable assignments, scope changes, and runtime values. This trace data is then transformed into Mermaid.js flowcharts that represent execution as a clear, step-by-step timeline. React synchronises the code editor, variable selection, and diagram updates in real time, allowing users to instantly see how values evolve as they interact with the code.
Challenges we ran into
Python’s broad support for variable shadowing introduced tricky semantics when ensuring that only the intended variables were highlighted. To address this, we leveraged Python’s deep introspection capabilities through its frame, sys, and ast modules, selectively “un-parsing” lines of code to determine which variables were actually referenced.
We also experimented with traditional flowchart loops and nested boxes, but found that these approaches either obscured the history of variable changes or introduced confusing visual clutter. Ultimately, we determined that a linear timeline with repeated line numbers provided the simplest and most effective way to visualise execution flow.
Accomplishments that we're proud of
We’re proud to have built GlassBox as a fully functional, client-side web application with seamless integration between tracing, visualisation, and interaction. In particular, we’re proud of the intuitive user experience, where selecting or hovering over code immediately reveals how variable values evolve throughout execution.
What we learned
Through this project, we gained hands-on experience with several new technologies. We learned how to dynamically generate and render Mermaid.js flowcharts in a web application, and how to use Python’s sys.settrace to trace variable behaviour during execution.
What's next for GlassBox
There are two clear next steps for GlassBox. First, expanding support to additional programming languages beyond Python. Second, building a VS Code extension that brings in-editor variable tracing directly into developers’ existing workflows.

Log in or sign up for Devpost to join the conversation.