Inspiration
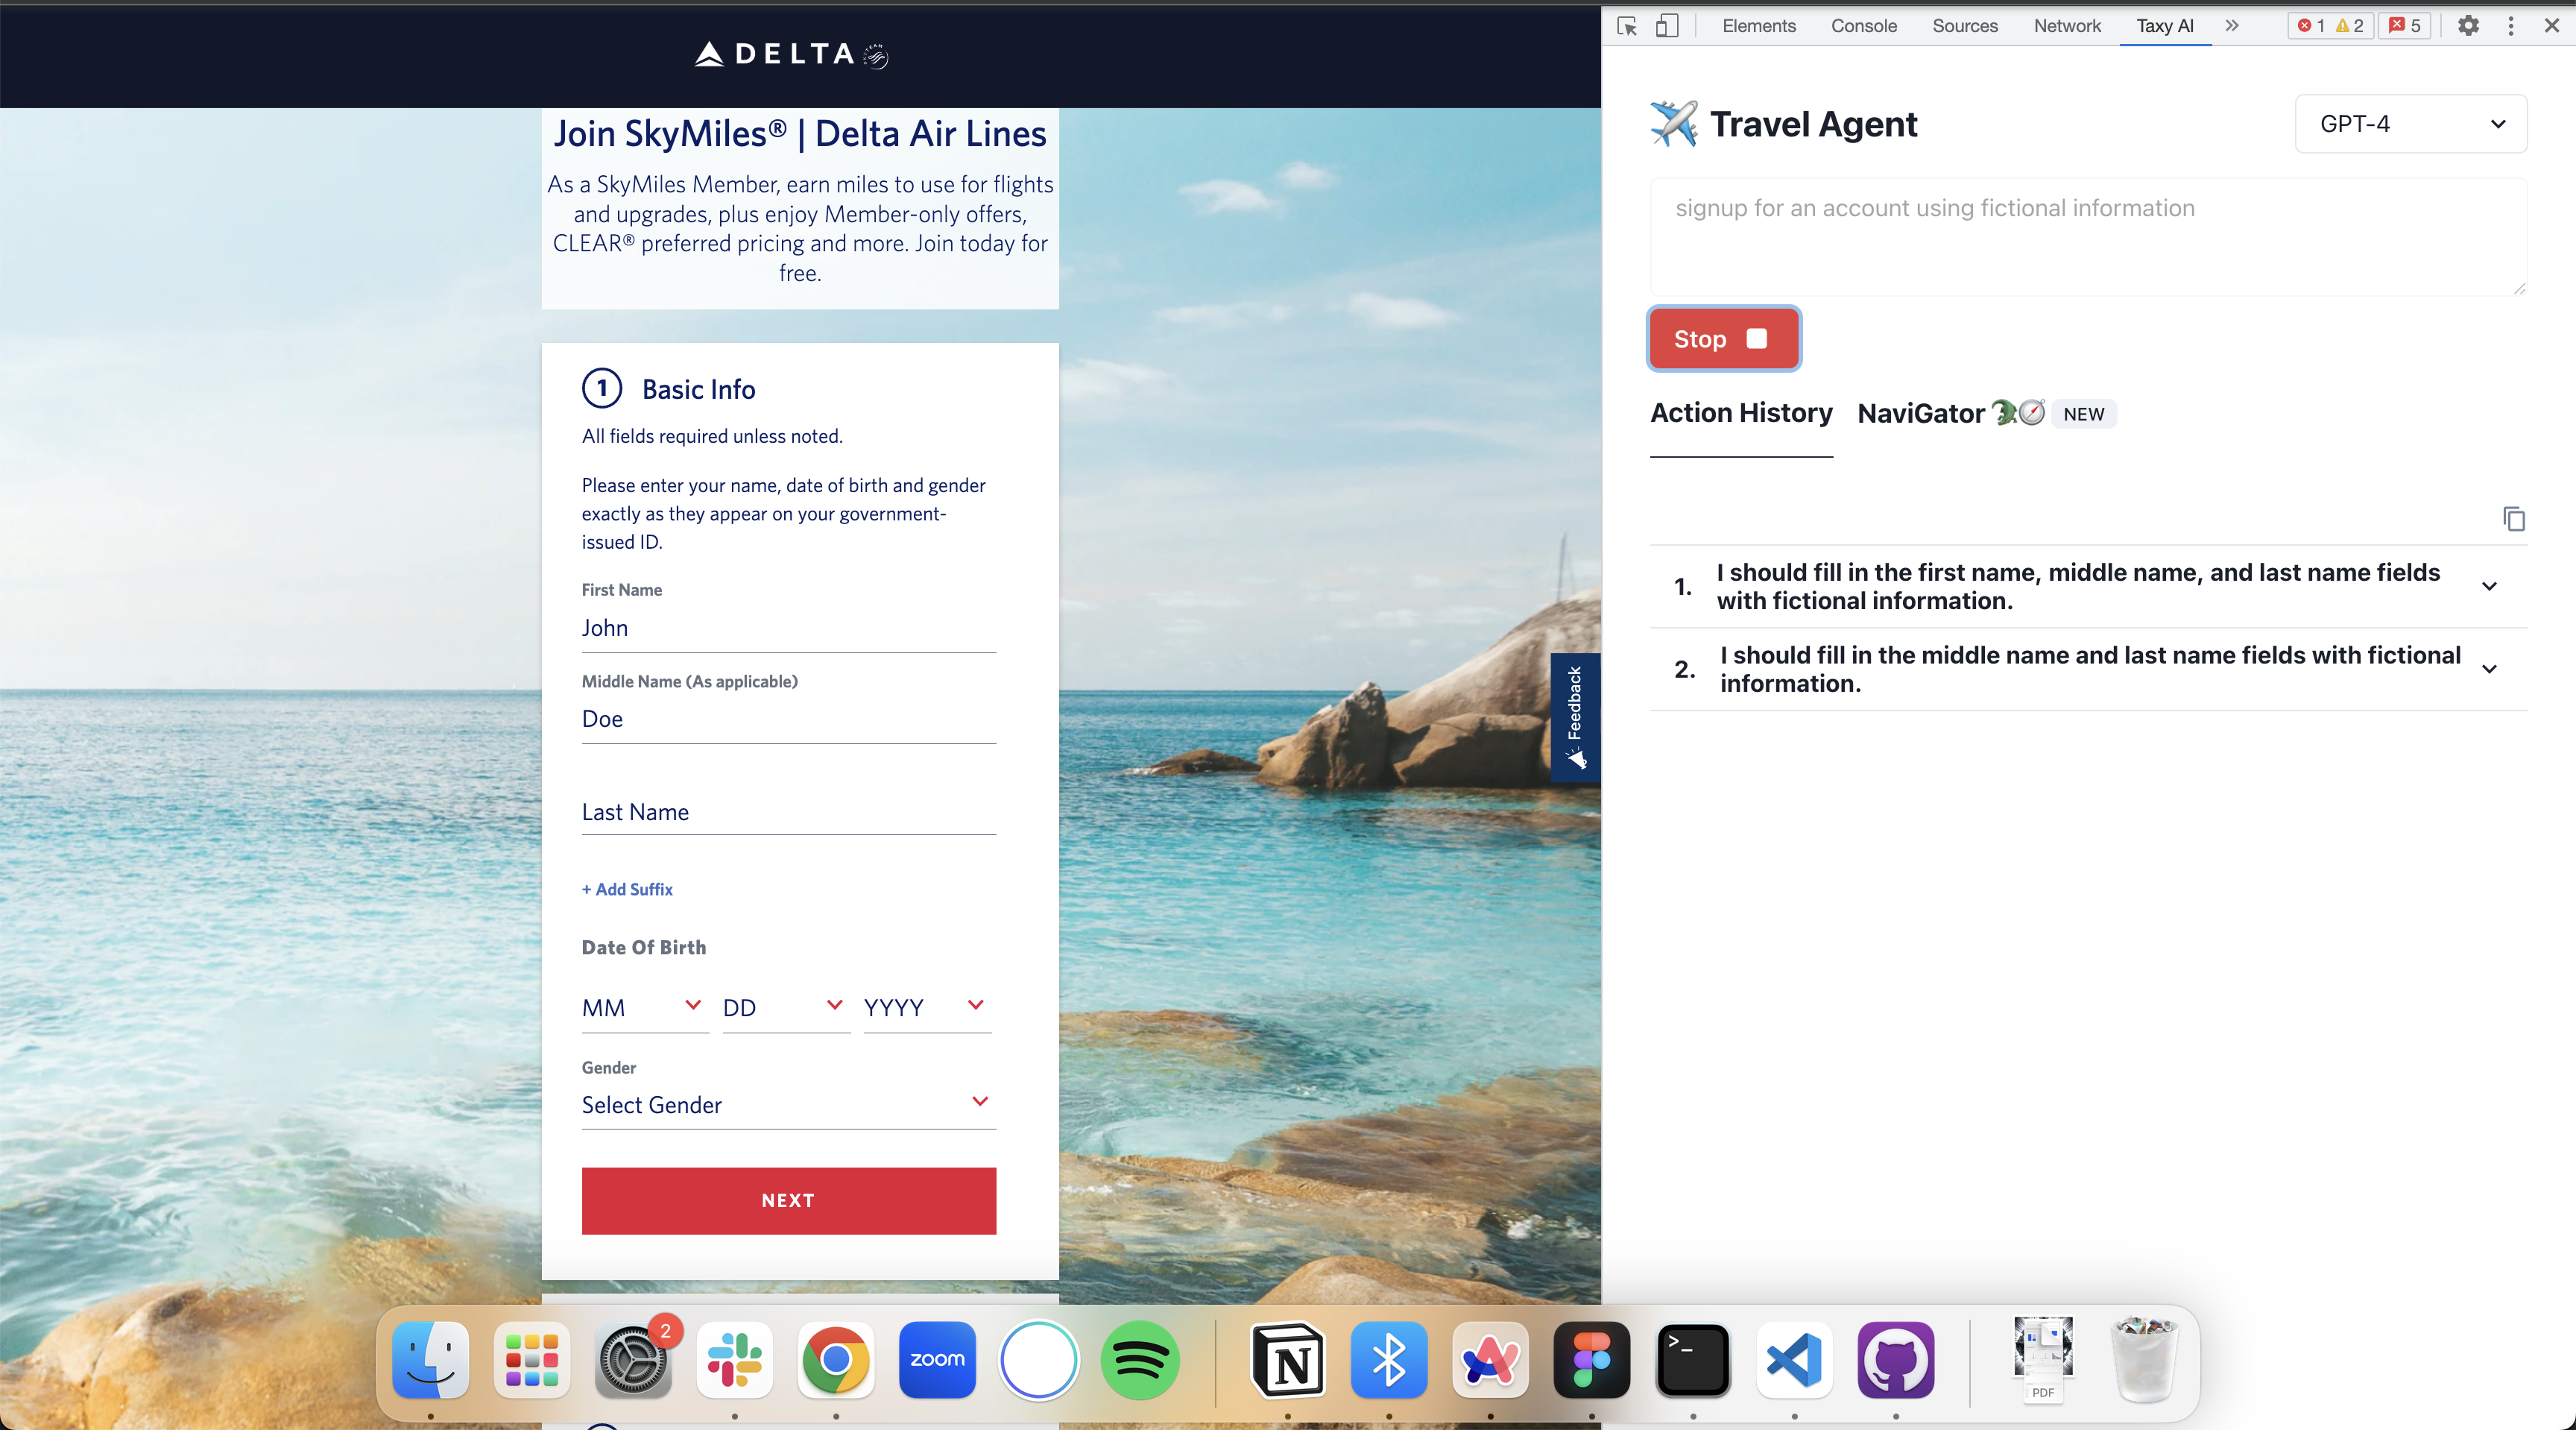
We originally wanted to build an agent that automatically signs up for frequent flier rewards numbers. However, we quickly realized that agents like those created from AutoGPT often get stuck in loops or error out, wasting precious OpenAI credits and time.
What it does
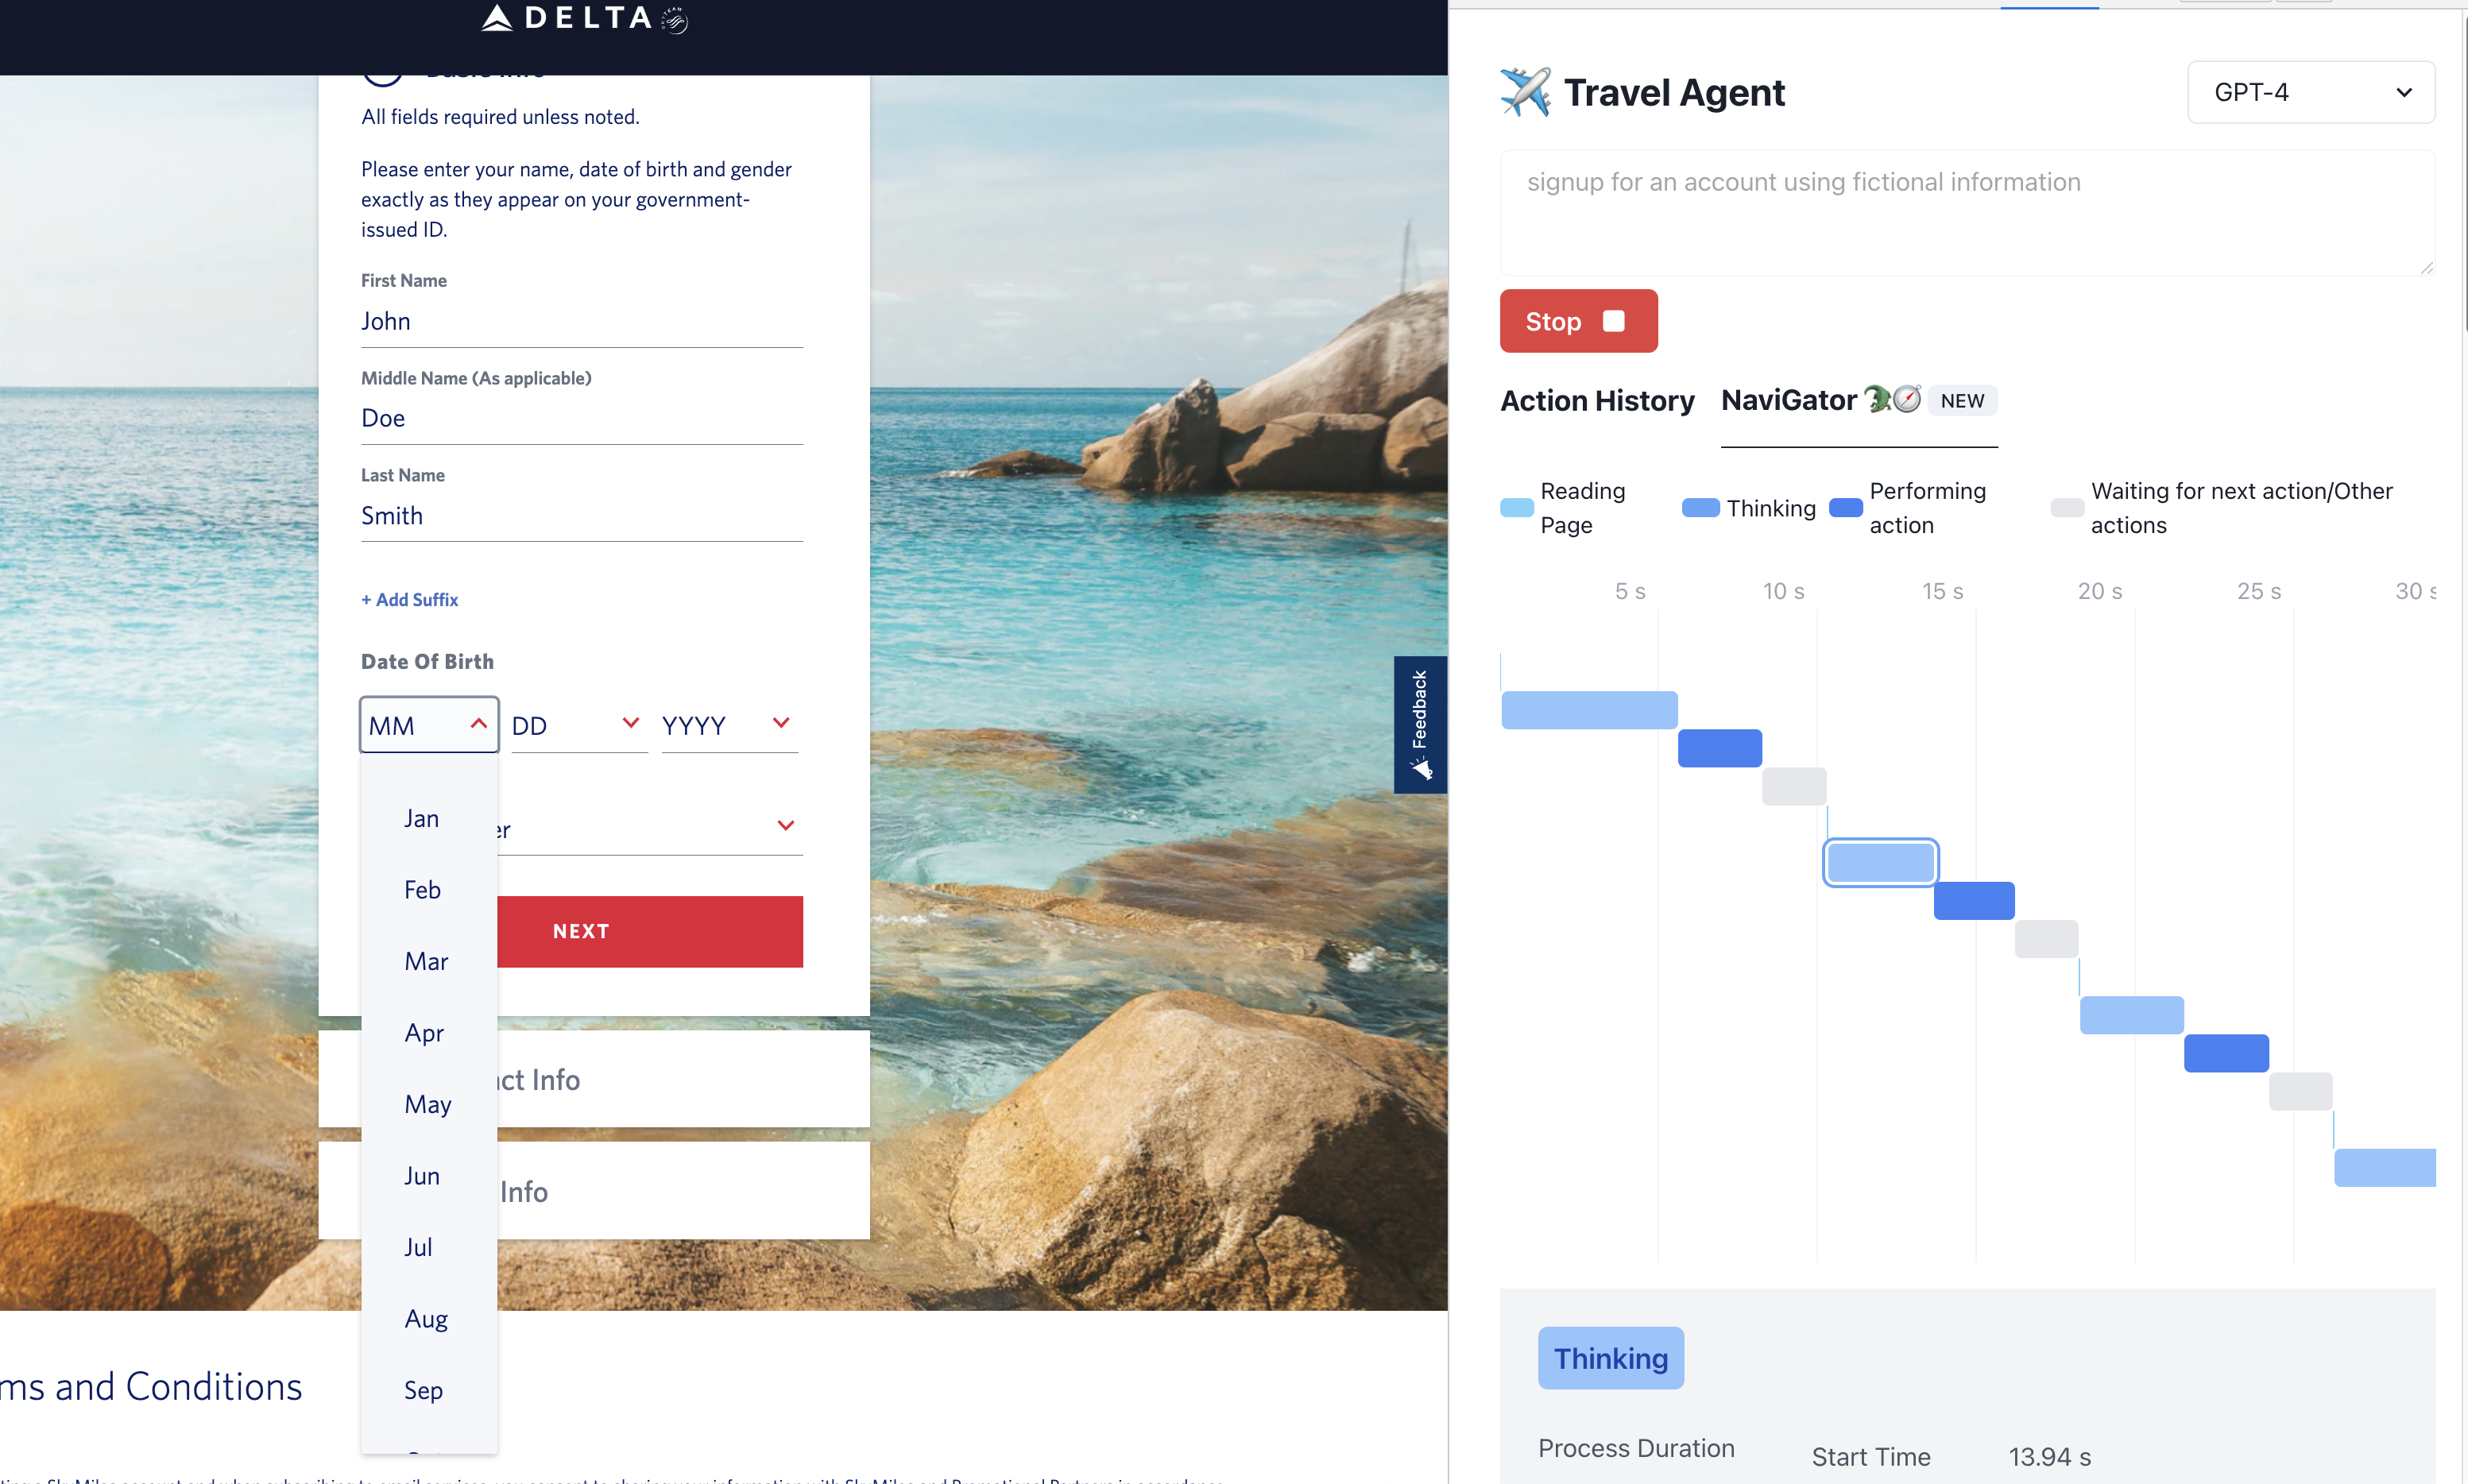
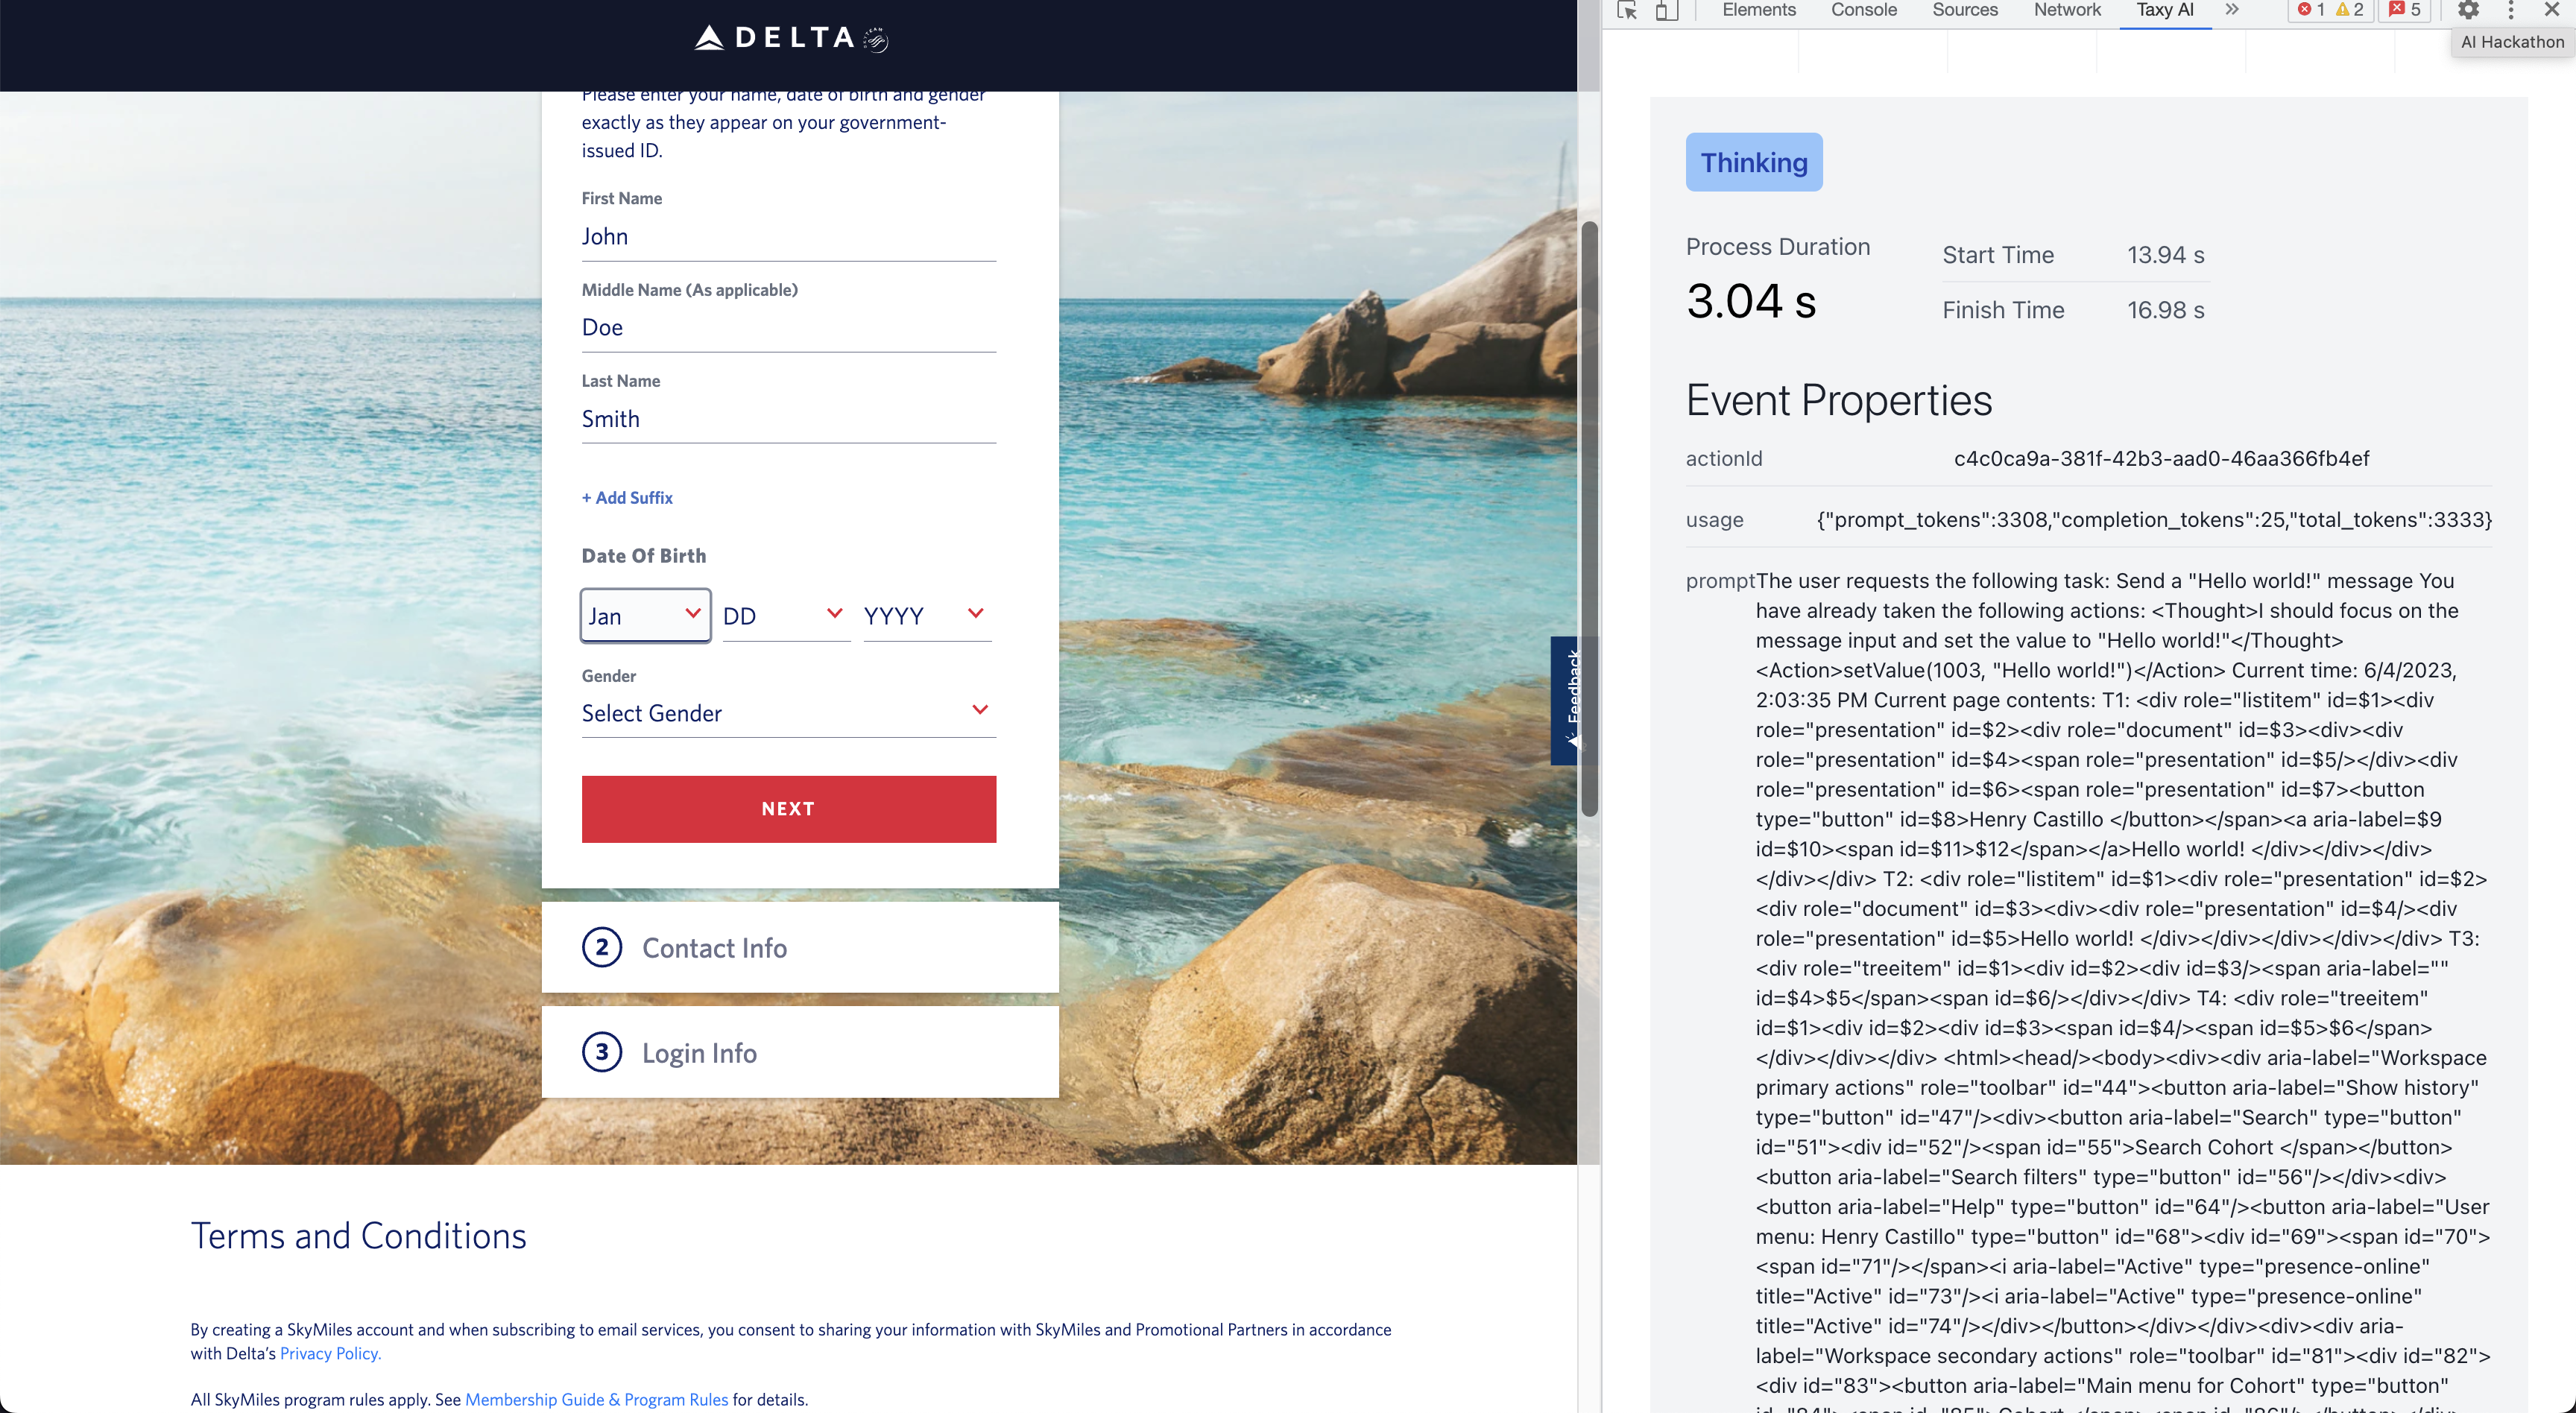
NaviGator monitors your agent as it goes through its workflow. It checks how many credits it uses, how long the agent takes to go through each event, the prompt that it is responding to, and more. While the agent is running, you can view the waterfall graph in the Chrome extension to visually see how long tasks are taking and also identify where it may be getting stuck.
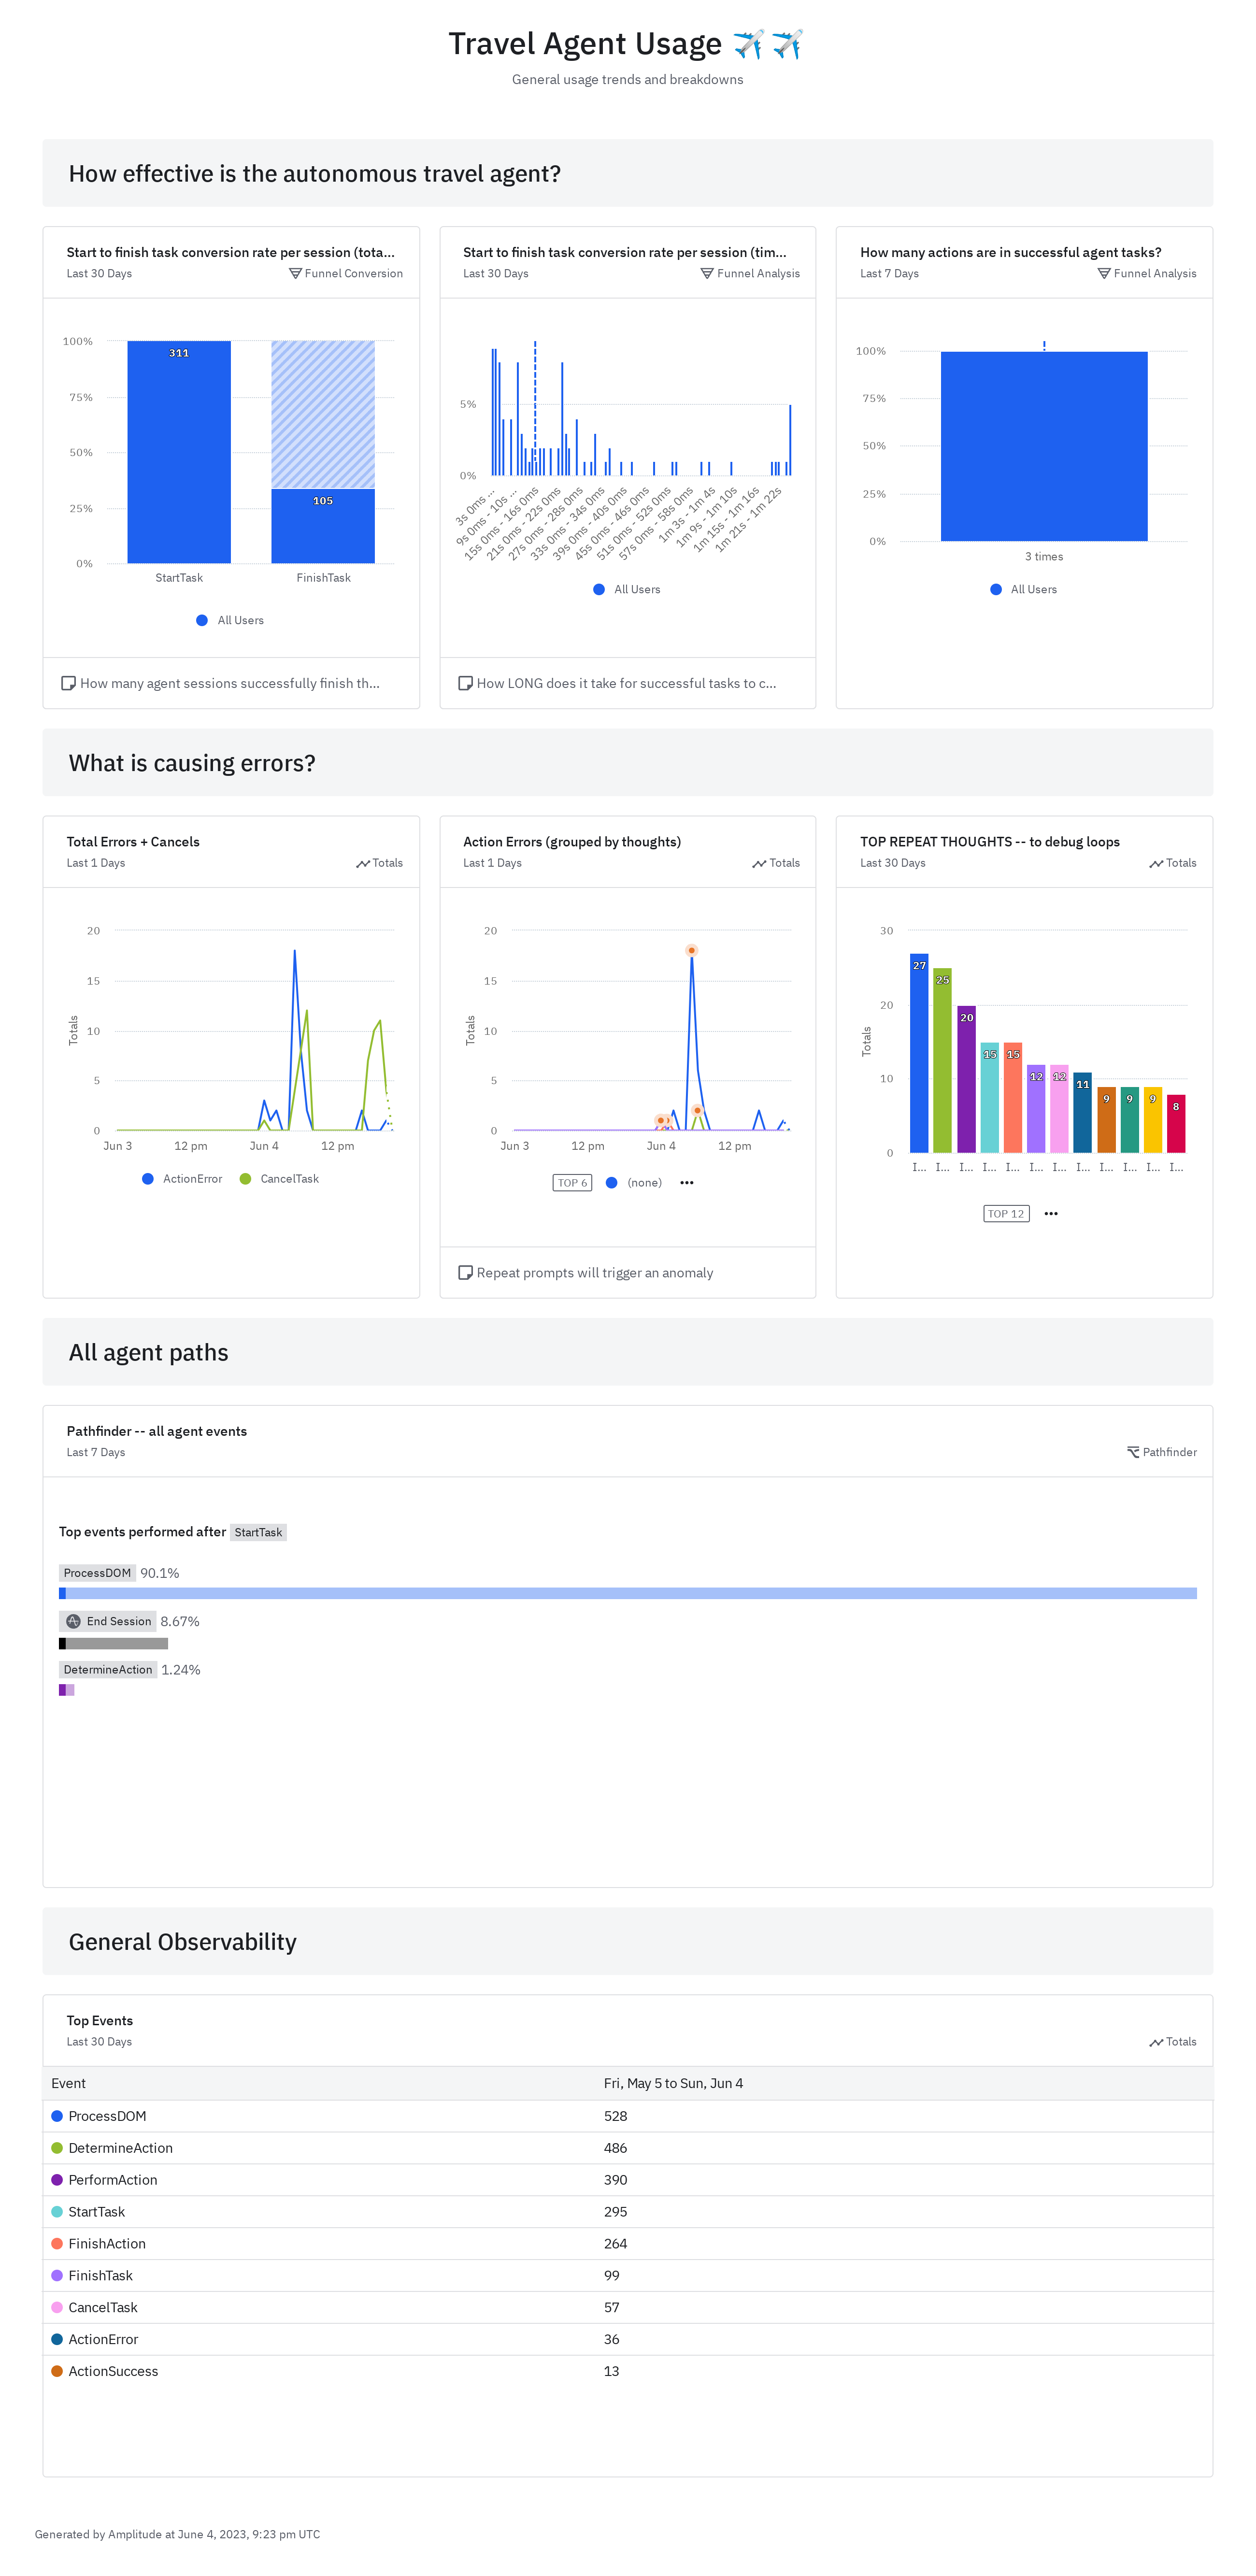
After the agent's workflow has been finished, you can view your OpenAI credit usage on New Relic's OpenAI dashboard. In addition, you can view an agent's journey per session and aggregate Sankey diagrams of paths that agents take through Amplitude. Finally, in LanceDB, you can look for specific task workflows using natural language queries and summarize workflows in a few sentences.
How we built it
First we wrote an analytics layer on top of Taxy AI (our agent of choice) that sends our information to Amplitude. We also added a custom waterfall graph on the Taxy AI UI that shows how long each event has been going on for. Finally, we add our trace information and OpenAI credit usage to New Relic's dashboard by using trace APIand OpenAI Observability tool
At the same time, we run our task history through OpenAI's embedding API and put the resulting vector and the original into LanceDB. This allows us to later query and describe our tasks workflows.
Challenges we ran into
Building a custom waterfall by far took up the most time. Taxy AI used a library that many of us were unfamiliar with and it took us a significant amount of effort to learn how to use it. In addition, learning to use LanceDB took a fair amount of tinkering.
Accomplishments that we're proud of
We think that being able to search for similar workflows through LanceDB is very cool. It allows us to debug an aggregate of workflows and could allow a company to collect information about their clients' behavior.
In addition, the Sankey diagram shows us a great amount of information. One really interesting fact we found was that only ~33% of tasks started end with a task finished. This means that the other 67% are either cancelled or end in failures.
What we learned
We learned about lots of different libraries we can use in the future and also different use cases for OpenAI, LanceDB, and Amplitude.
Built With
- amplitude
- lancedb
- new-relic
- openai
- python
- typescript


Log in or sign up for Devpost to join the conversation.