
Inspiration
Increasing political awareness
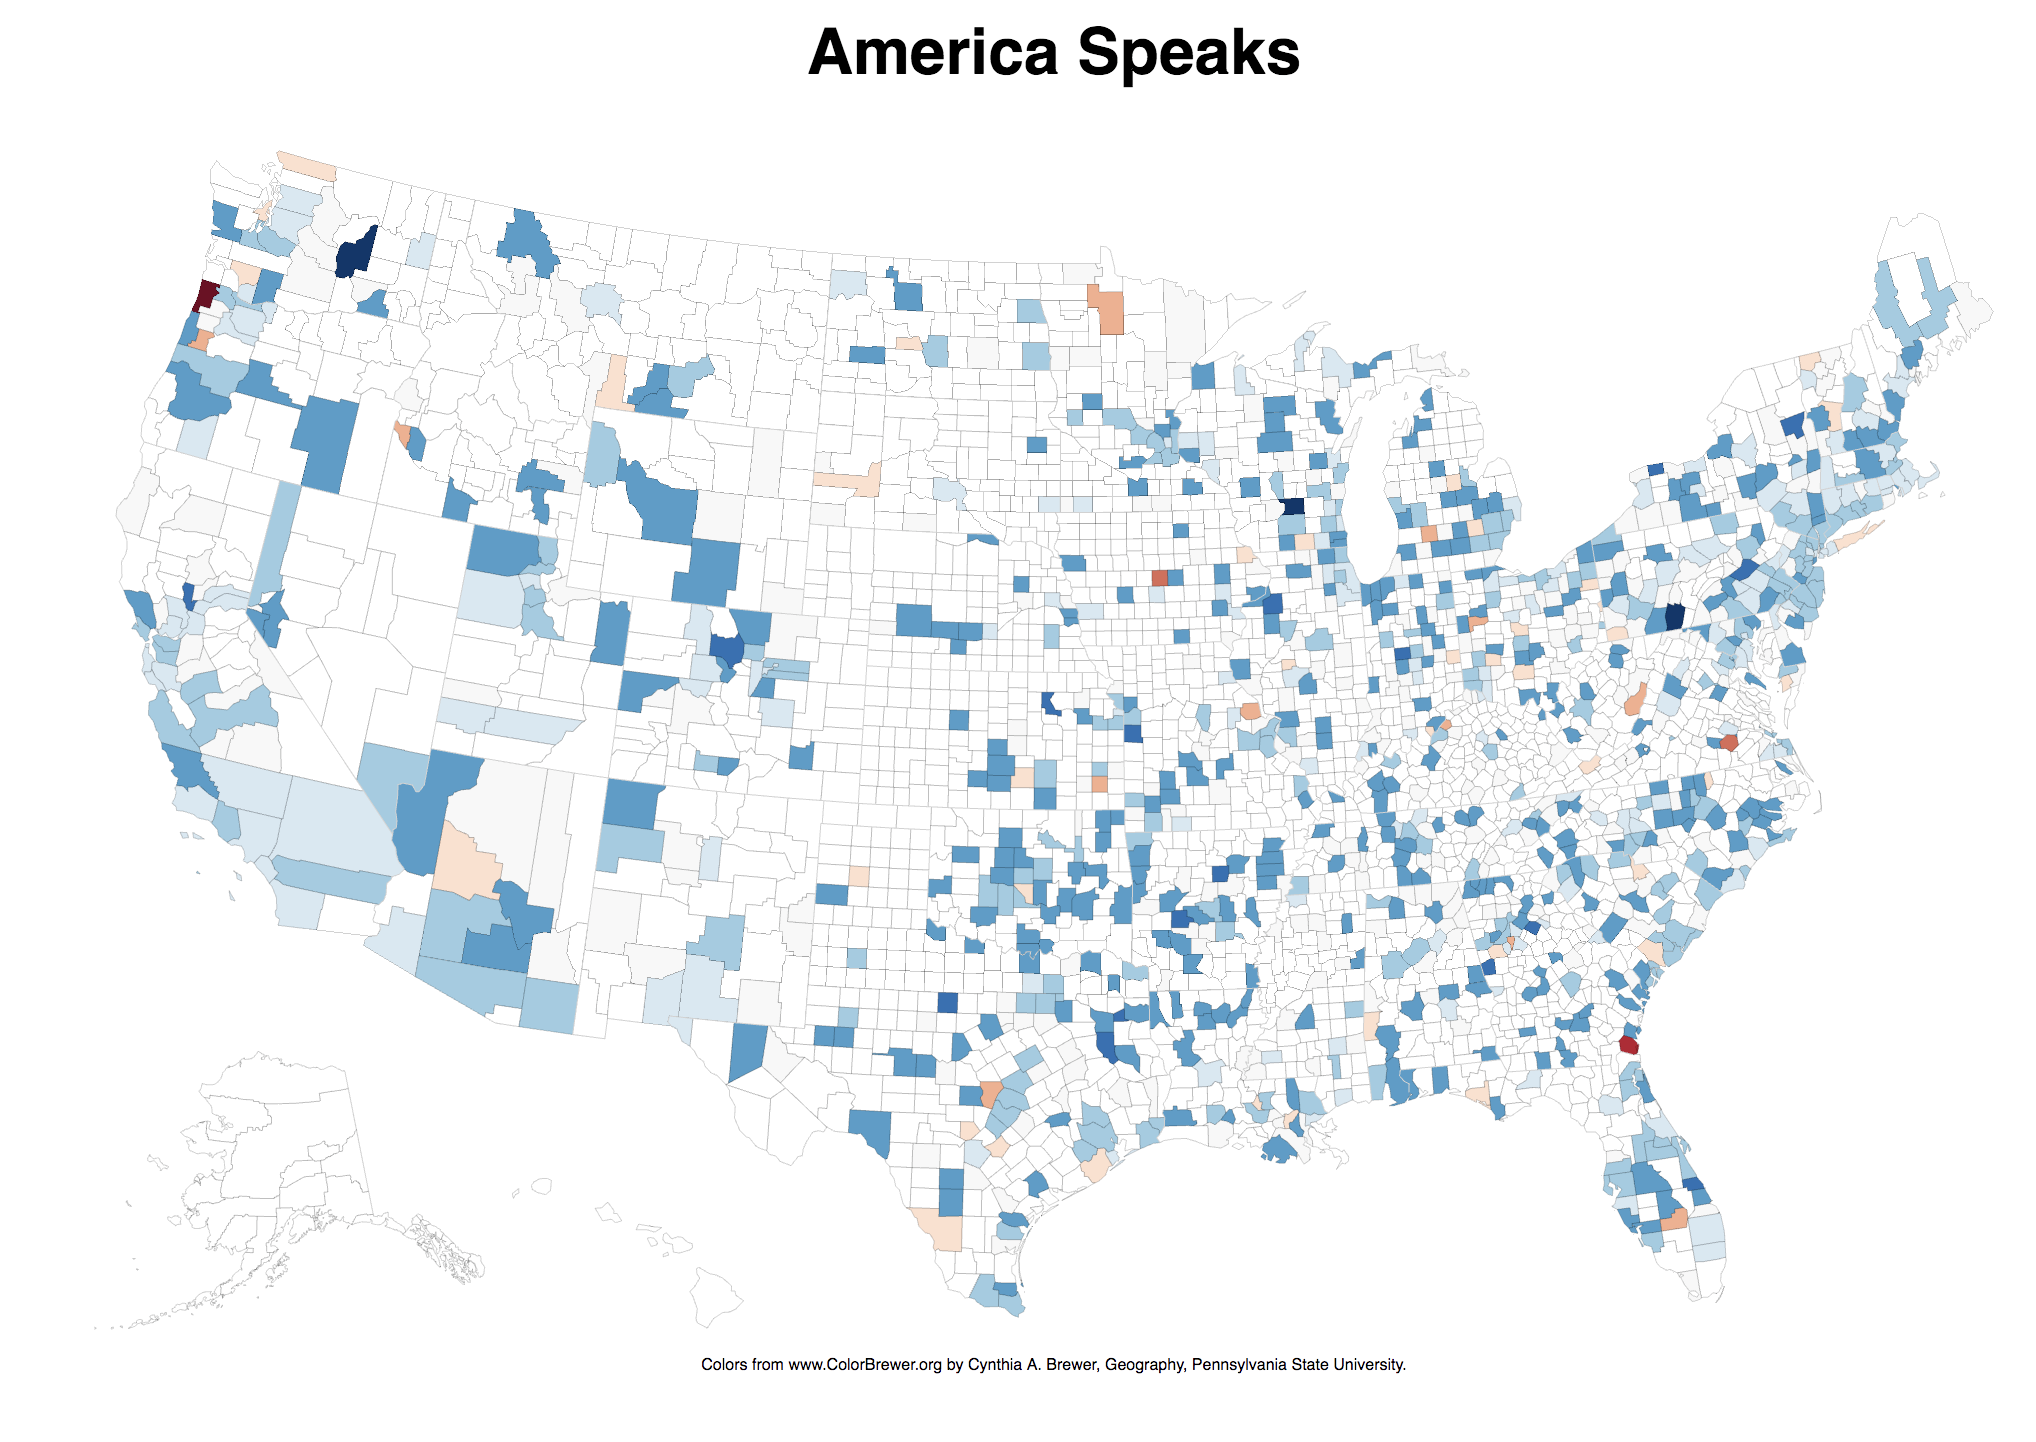
What it does
Visualizing sentiment across America via Twitter
How we built it
With the Twitter API, storing tweets in mongodb and displaying on a choropleth map
Challenges we ran into
- Locations in the US are hard, what even is FIPS?
- D3 Choropleth has bad docs
- Twitter throttling our requests
- Getting quality tweets is hard (filled with slang and tags)
Accomplishments that we're proud of
- Our DynamoDB is baller
What we learned
- Look at the API before the Hackathon
- Big data is hard to find
- Don't overthink shit
- There are a lot of tweets about Jobs and weather
What's next for Gladitiude
- We could expand with more visualizations
- More countries
- More data
- Integration with watson

Log in or sign up for Devpost to join the conversation.