-
-

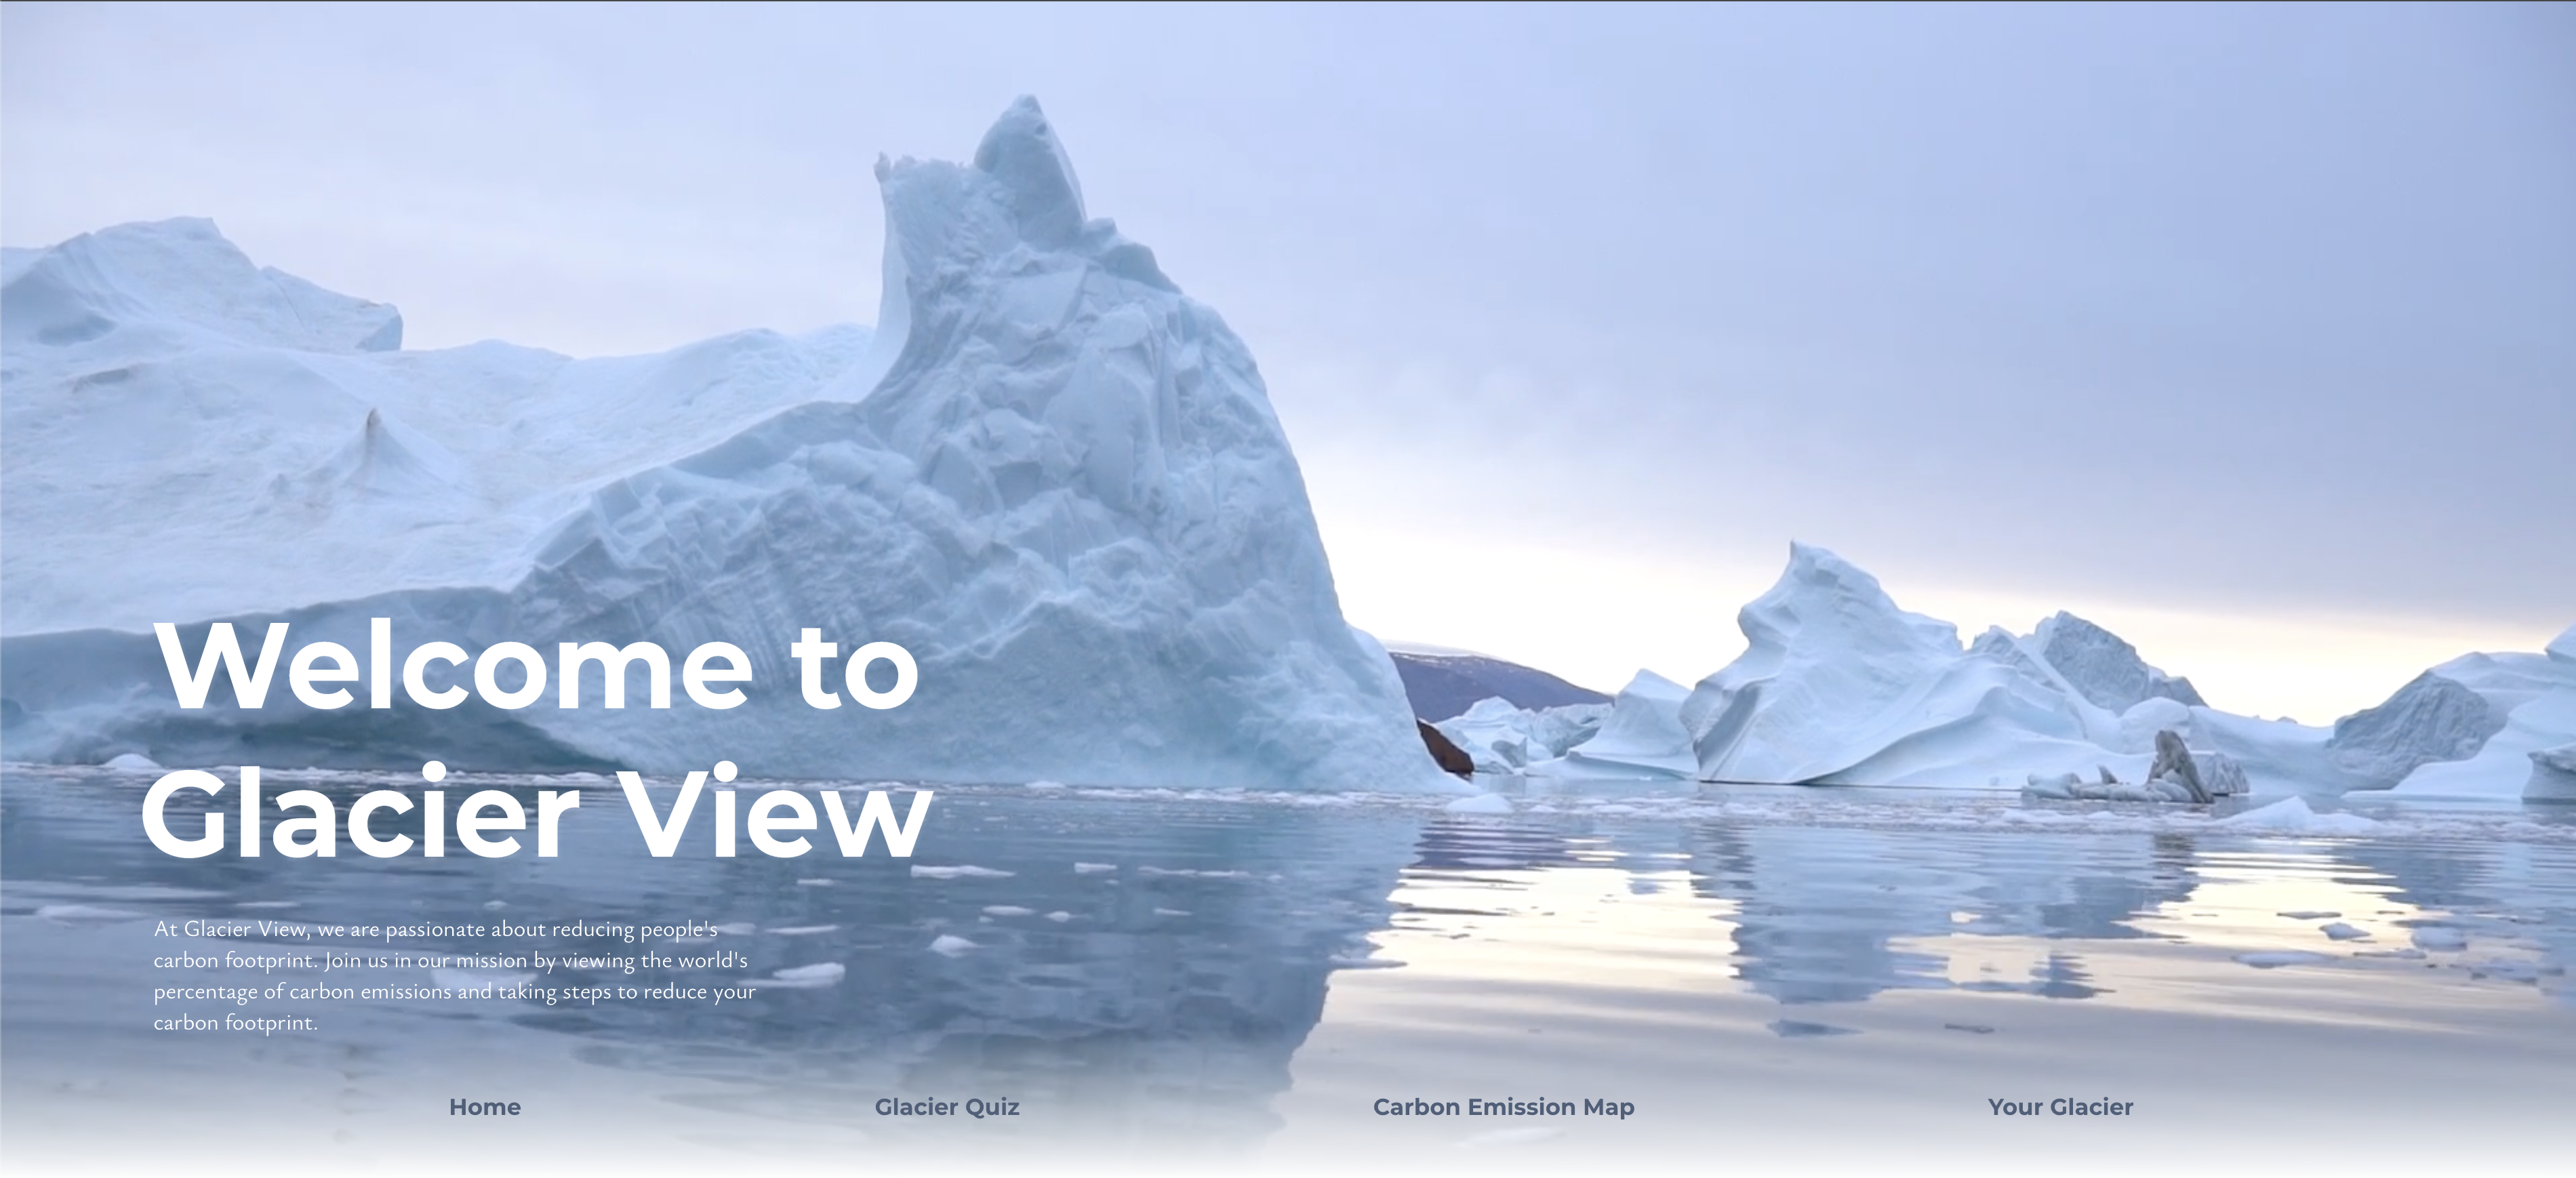
Project Homescreen
-
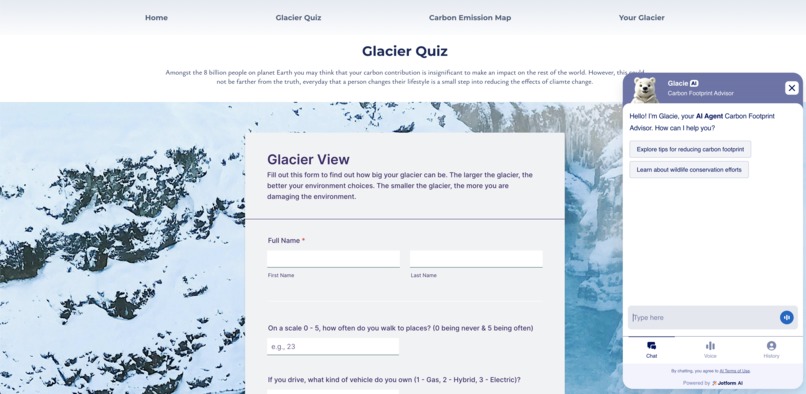
This view contains a quiz on the users carbon impact and provides a visual to the impact one person can have.
-
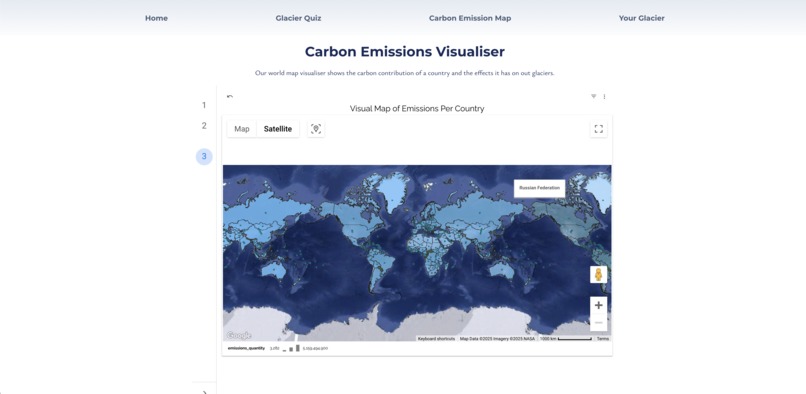
Our carbon emission visualizer shows the carbon emissions in different countries, as well as interactive charts and maps.
-
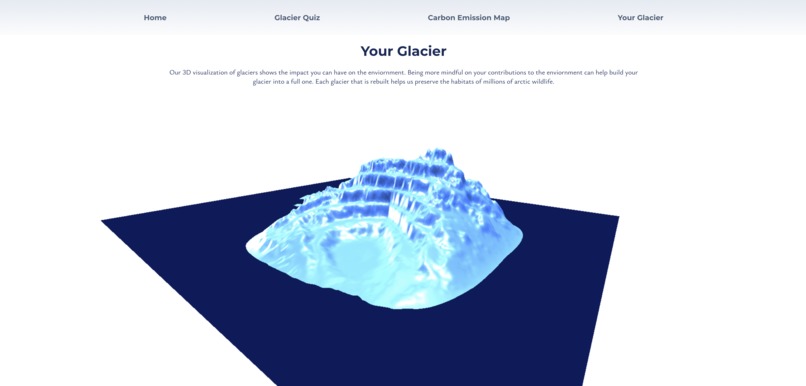
Our "Your Glacier" view allows users see the impact environmentally friendly designs can have.
-
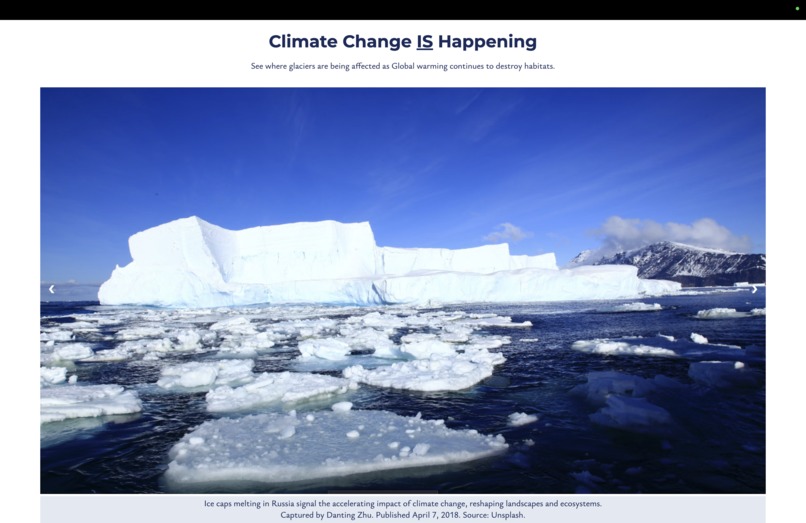
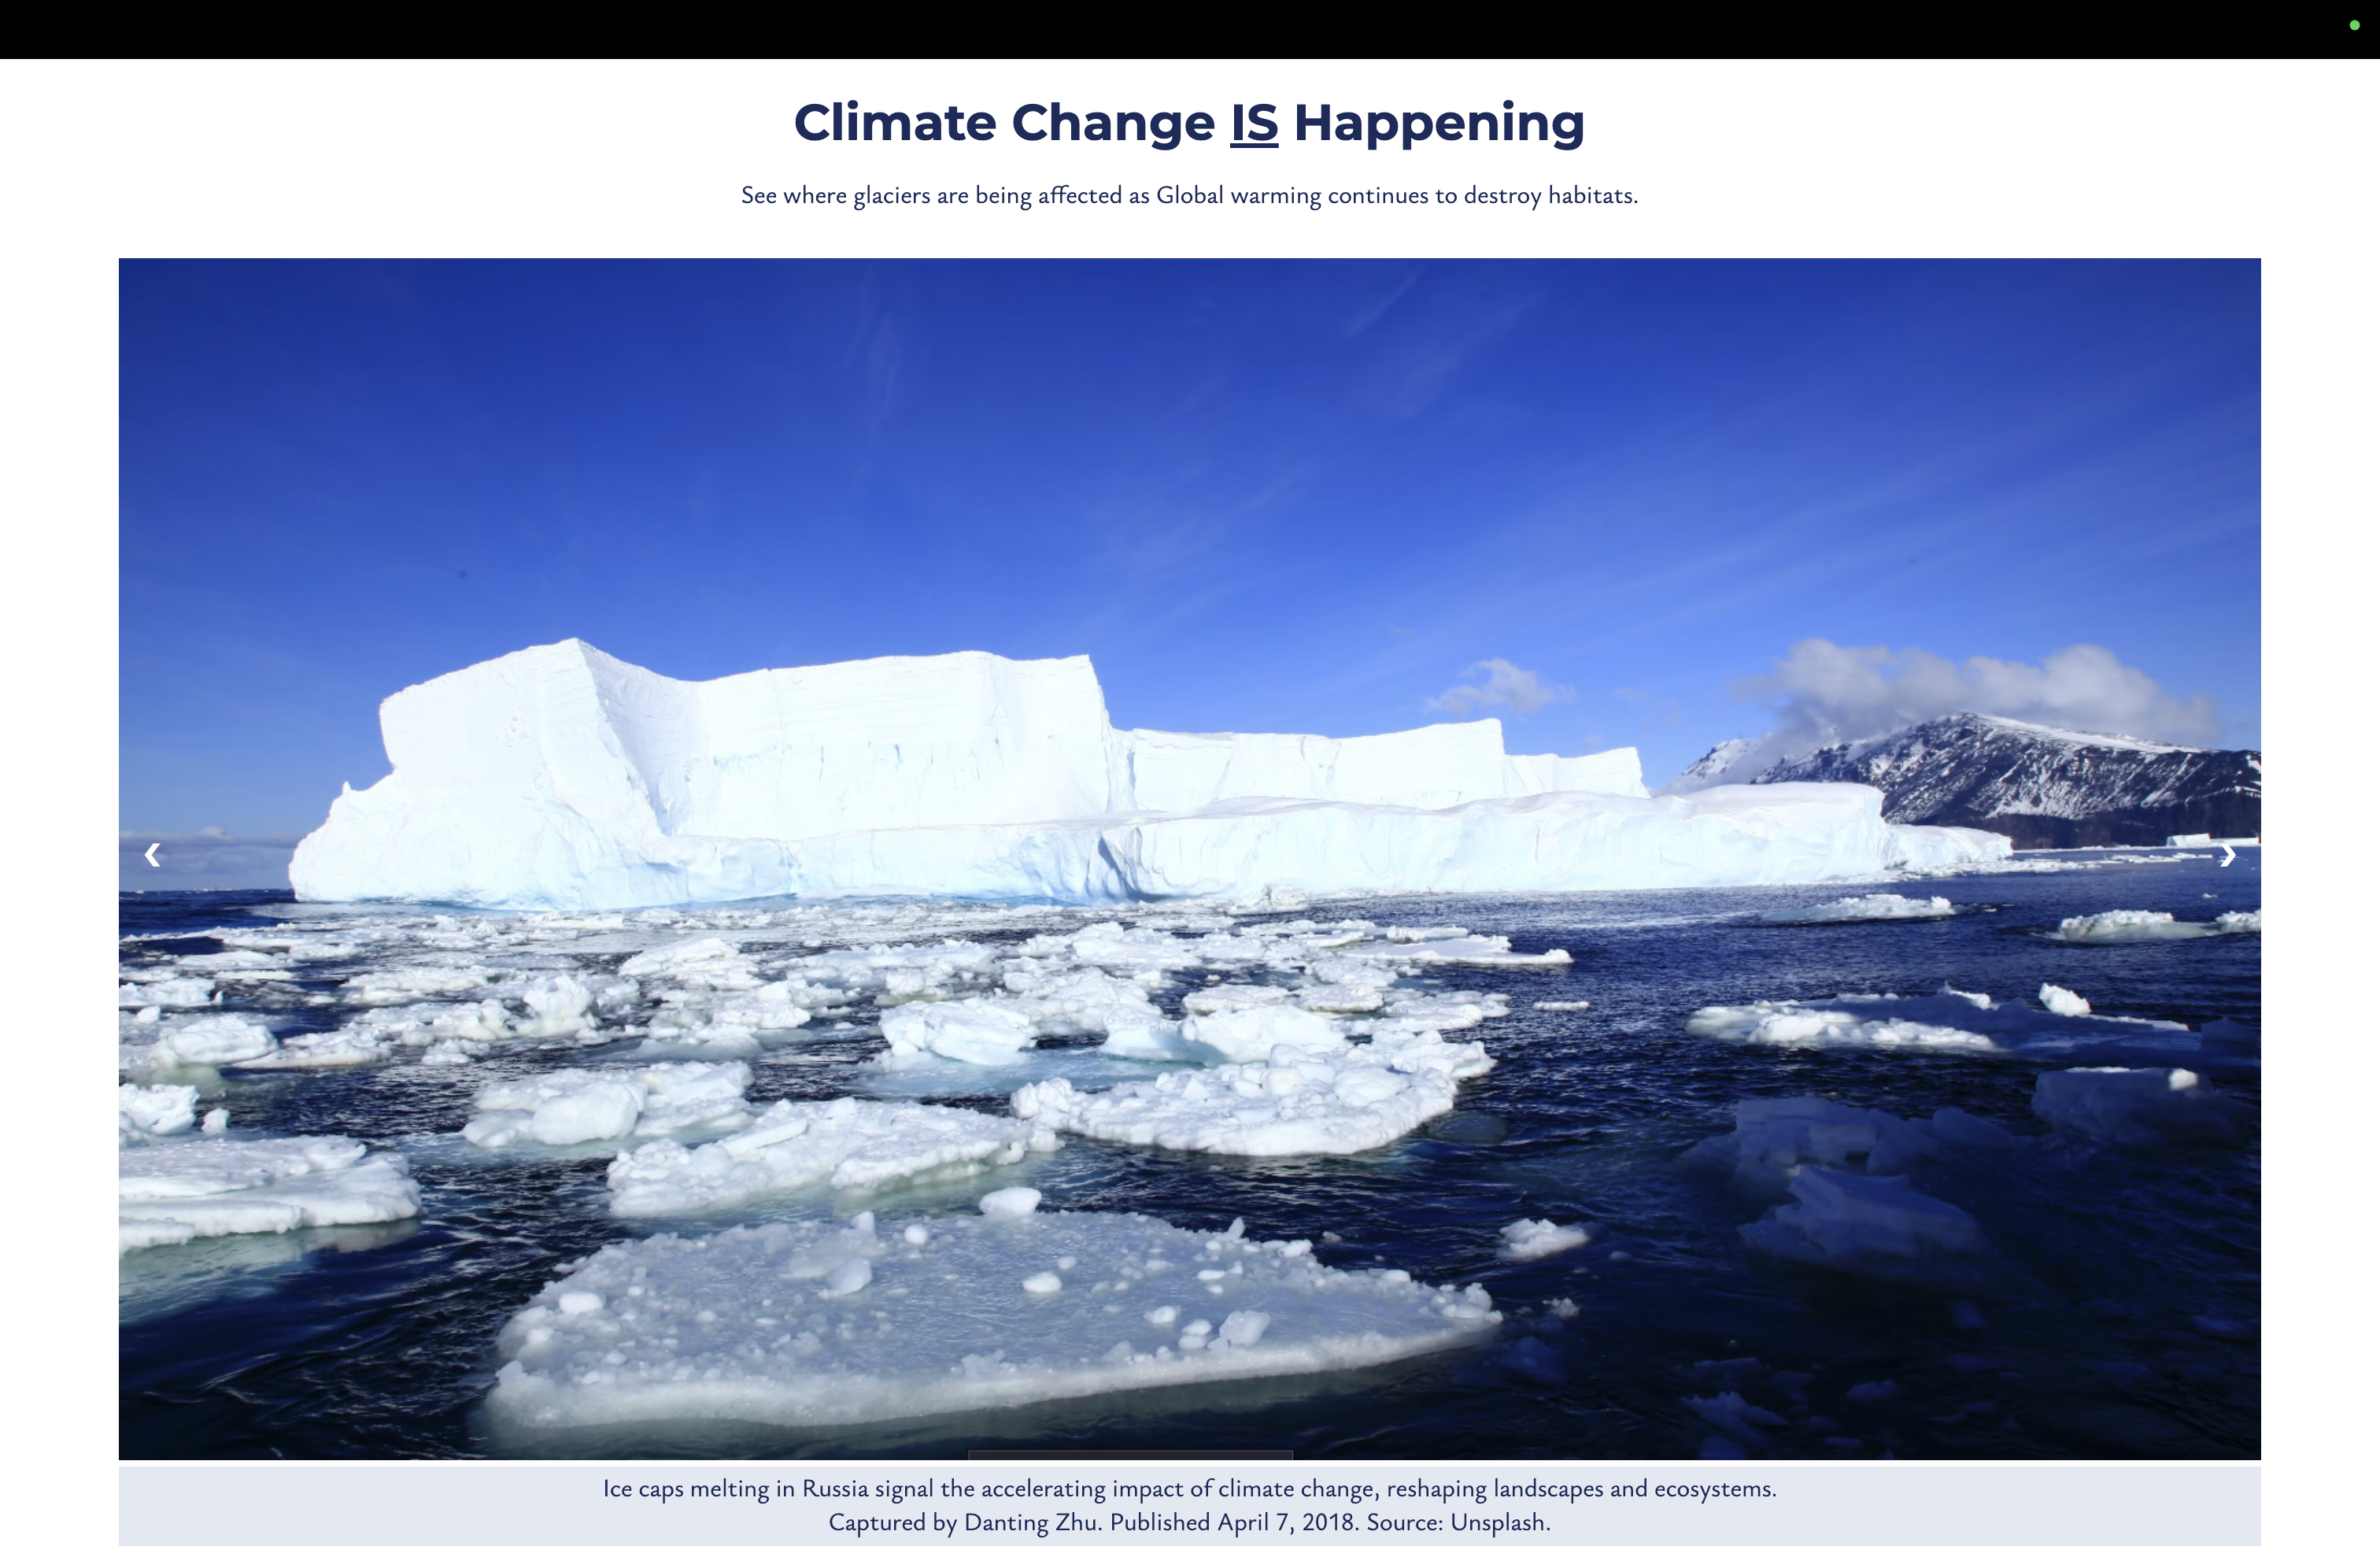
The gallery showcases the impact that global warming has had on our glaciers and wildlife.


Inspiration
We wanted to emphasize the impact our actions have not just on the future of humanity, but especially for the future of animals. We sometimes forget that we are not the only species being affected by Global Warming and Carbon emissions, and Glacier View attempted to fix this. Glacier View’s mascot is Polar Bear, showcasing how carbon emissions affect everyone, humans and animals alike.
How we built it + What it Does
We built Glacier View using a variety of skills as well as from external sources. The main website was made from HTML, CSS, and Javascript. Not only this, but this website features interactive charts and maps, allowing you to analyze where most of the Carbon Dioxide originates from and what countries have been contributing most to the decline in Glaciers. However, to achieve this we had to filter out the dataset to get rid of the null rows and irrelevant columns. We did this using the Pandas library and exporting our filtered dataset to LookerStudio. We then sent up the values for the dimensions, layer metrics, and data range dimensions. In addition, we used JotForm to train an AI agent on information about carbon emissions, carbon footprints, etc. We used mathematical equations to take the user's responses from the JotForm form and calculate the percentage of the user's glacier. A higher user glacier percentage signifies the user's small carbon footprint. Conversely, a lower user glacier percentage signifies the user's large carbon footprint and hence harms glaciers. To visualize the impact, we 3D modeled a glacier using Blender to add to the interactive aspect to our website.
Challenges we ran into
One major challenge was figuring out the correct mathematical equation to calculate the percentage of the user’s glacier. There was a lot of trial and error with this step. We also needed a way to store that value so that it could later be referenced in the “Thank You Page”. Another challenge we faced was creating the sliding gallery on the Home Page. We initially believed that there was an error in our HTML files but digging a bit deeper, we found out that the image files we downloaded were corrupt. In addition, the dataset used in Looker Studio initially did not have the names of countries, only the country codes. Unfortunately, Looker Studio does not accept these Country Codes so we needed a way to convert these to the actual country name. Another significant challenge was integrating our Blender 3D model into the website. We faced difficulties in rendering the model correctly in Three.js, ensuring it loaded properly, and optimizing its performance for smooth interaction. Debugging texture issues and adjusting lighting to match the scene also required extensive troubleshooting.
Accomplishments that we're proud of
We are proud of creating a fully functional interactive website that educates users on the impact of carbon emissions. Successfully integrating 3D models, AI-driven calculations, and dynamic data visualizations was a major achievement. Additionally, overcoming technical challenges such as data filtering, API integrations, and UI/UX design improvements contributed to the success of Glacier View.
What we learned
- Data cleaning and processing using Pandas
- Implementing interactive visualizations in Looker Studio
- Using JotForm for AI-based interactions
- Creating and integrating 3D models using Blender
- Troubleshooting front-end and back-end issues, particularly with HTML, JavaScript, and CSS
- The real-world impact of carbon emissions on glaciers and animal habitats
What's next for Glacier View
Moving forward, we plan to:
- Improve the accuracy of our AI agent’s calculations by refining our mathematical model
- Expand the dataset to include more real-time carbon emission statistics
- Develop a mobile-friendly version of the website for better accessibility
- Introduce a leaderboard feature where users can compete to lower their carbon footprints
- Implement a donation feature to support conservation efforts for Arctic wildlife


Log in or sign up for Devpost to join the conversation.