-
-
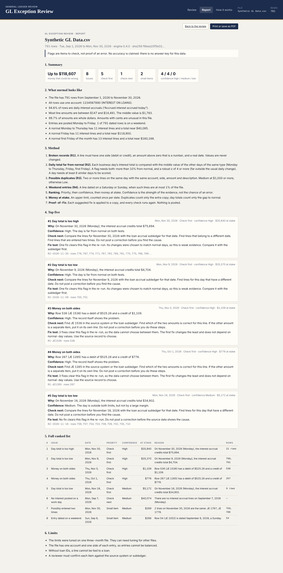
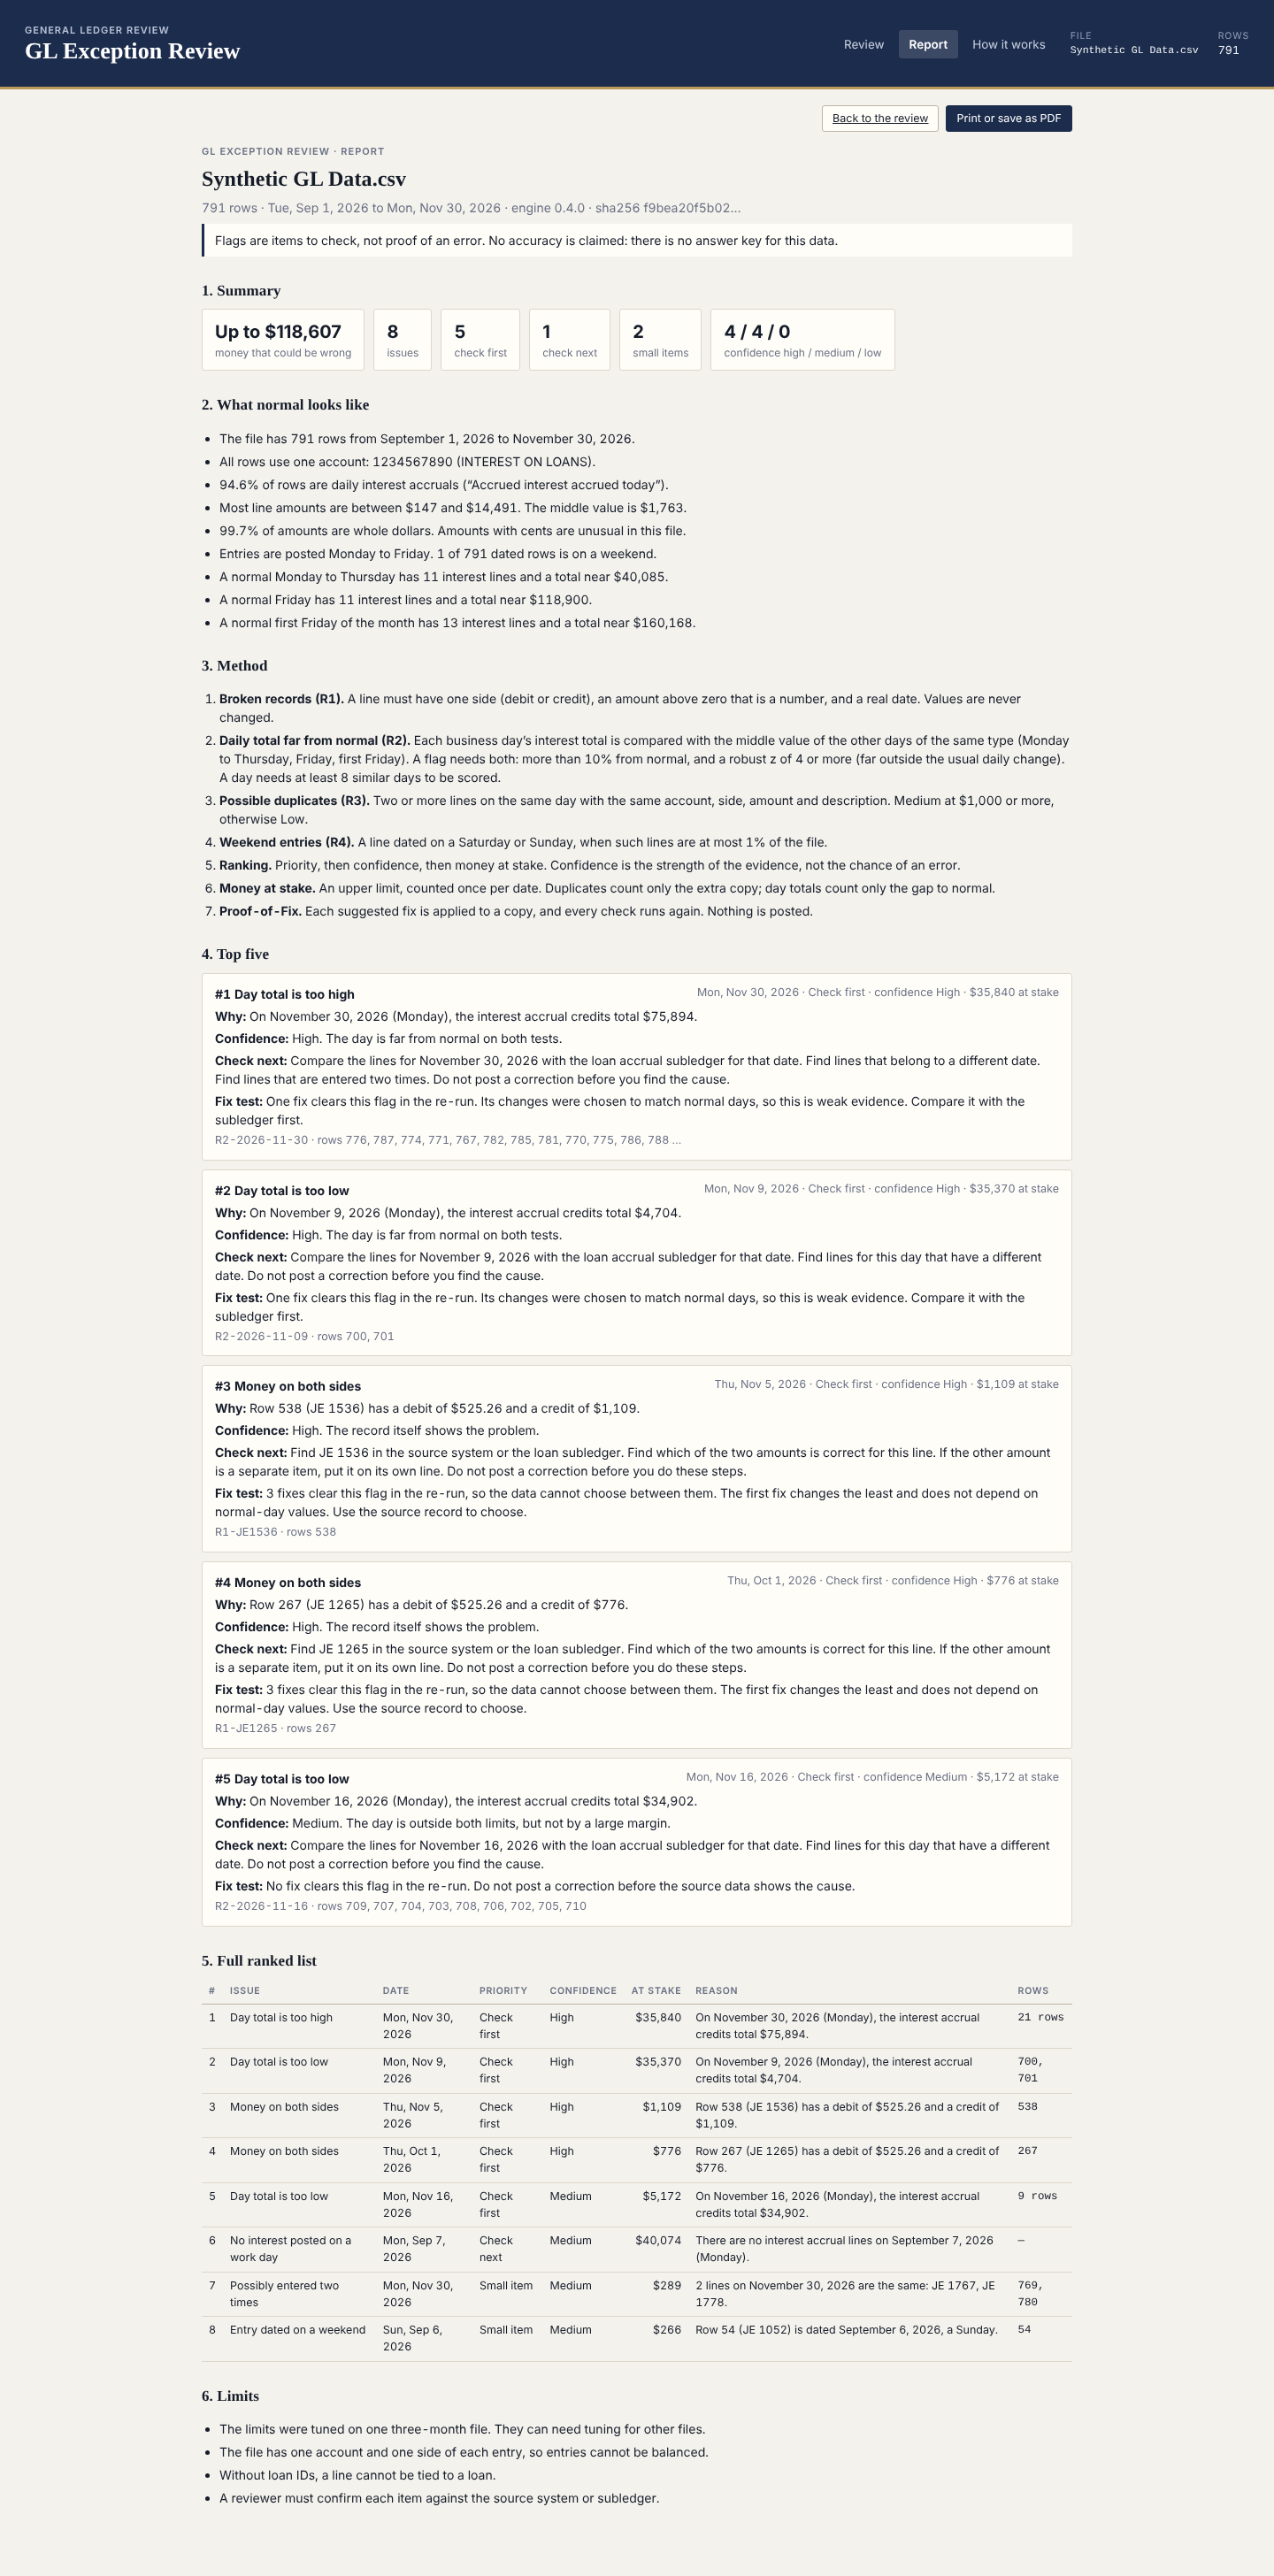
here is what a downloadable report
Inspiration
Spotting an unusual entry in a bank's general ledger usually depends on someone happening to notice it. The Emerging Track case said it plainly: there is no defined, repeatable method for what counts as "normal," so two reviewers can catch, or miss, different things.
The problem is real. A Gartner survey of 497 people in controllership (July 2023) found that 18% said they make a financial error at least daily, and 59% said several a month. These figures are self-reported, but they show how often errors happen when teams are stretched.
We wanted to replace "happens to notice" with a written method that anyone can follow, repeat and check.
What it does
You load a ledger export (CSV, TSV, Excel or OpenDocument). The tool flags days and lines that don't fit, and ranks them. Each issue shows:
- a plain-English reason and a confidence level (High, Medium or Low) with a one-line reason
- the most money the issue could put in the wrong place, counted once per date
- a short list of next steps, such as "Compare the lines with the loan accrual subledger"
Proof-of-Fix is our main addition. It tests each proposed correction on a copy of the ledger and re-runs every check, so a reviewer can see what the fix clears and what it leaves wrong. Nothing is ever posted.
How we built it
1. Profile the data. The file has 789 rows over three months. Fridays post about 3 times more interest than Monday to Thursday, and the first Friday of the month about 4 times more. So we compare each day only with days of the same type.
2. Define "normal" with simple math. For each day type, the normal total is the median of the other days. A typical swing is the median distance from that middle, scaled by 1.4826 so it compares to a standard deviation. We use the median because one bad day cannot stretch it.
$$m = \operatorname{median}(x_1,\dots,x_n), \qquad s = 1.4826 \cdot \operatorname{median}\left(\,|x_i - m|\,\right)$$
A day is flagged only when it is far from normal and also material:
$$z = \frac{x - m}{s}, \qquad \text{flag if } |z| \ge 4 \ \text{ and } \ \frac{|x - m|}{m} \ge 0.10$$
For November 30, the day total is USD 75,894 and the normal total is USD 40,054. That gives z of about 47.1, and the day is 89.5% above normal.
3. Four checks. Line integrity (money on both sides, zero amounts, bad dates), day totals, duplicate lines, and weekend entries.
4. Rank and explain. Issues are grouped by date and ranked by priority, then confidence, then money at stake. Every number in the text is checked against the record.
5. Stack. A Python engine that uses only the standard library, so the same code runs in the browser through Pyodide. The review console is a static Next.js site. Browser results match the Python results. We wrote 161 engine tests and 42 browser checks. The engine uses no AI: fixed rules decide every flag. We used Claude to help profile the data, write code and write tests, and we packaged a reusable Claude skill that runs the engine on a new month of data.
Challenges
- The AI was confidently wrong four times. It said every Friday has the same large line (first Fridays differ), that a JE
Built With
- claude
- css
- html
- javascript
- netlify
- next.js
- node.js
- playwright
- pyodide
- pytest
- python
- react
- typescript
- webassembly

Log in or sign up for Devpost to join the conversation.