-
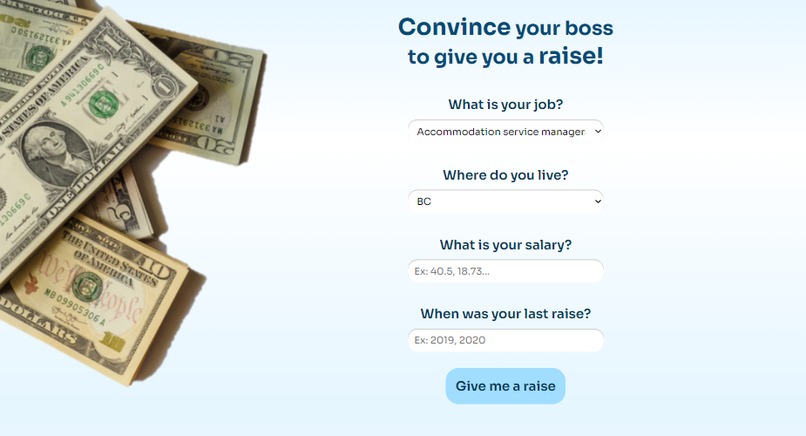
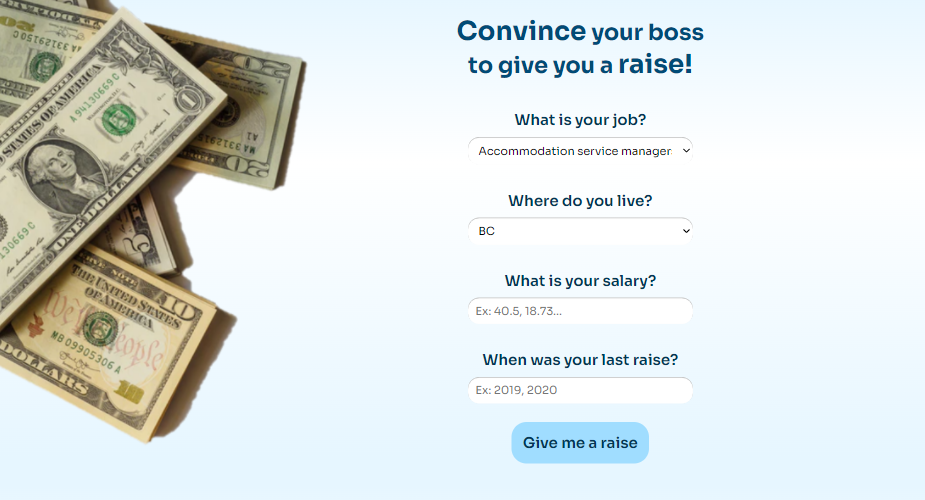
"Give me a raise!" landing page
Inspiration
The current employment crisis inspired us to side with the working class and give them arguments and confidence to fight against their capitalist exploiters.
What it does
We developed an app that will help you obtain a raise. Our app includes many useful features such as finding the salary range and median salary in your area, how your salary compares taking into account the inflation in the past few years, and how your salary compares next to other locations in Canada by visually placing them on a map.
How we built it
For the frontend, we used HTML, CSS and some Js to populate the dropdown menus on the landing page. We made our web app responsive by using grid properties. Also, the user’s inputs are restricted to valid inputs only. For example, the app will prevent negative salary or a decimal number for the year. And since all input fields are required, it will ask the user to input something if he forgot to do so.
For the backend, we used python to scrape the data from a government excel spreadsheet. The code extracts the list of possible jobs as well as the list of locations in Canada. Next, it extracts the minimum, maximum, and median salaries for a given job title and location. It can also extract the salary ranges for a particular job for all locations. Taking the median salary for each location, it places a scaled circle on how it compares to the other locations on a map of Canada. The location of the circle is determined by obtaining the lateral and longitudinal coordinates from google map’s API and transforming them into pixel coordinates so they can be placed on our image. The app also collects data from the previous year for inflation to help you know how much your salary should have grown since your last raise according to inflation trends.
To link the frontend to the backend, and to make our project as easily accessible to the user as possible, we created a web app using google cloud services and flask. It allows us to easily combine python and HTML/JS, but also to share with you the current version of the website: link for you to try out by yourselves. It even works on mobile for that extra user-friendliness !
Challenges we ran into
Geometry is a pain, and so is merging code. Finding data was not that easy and preprocessing was not fun either.
Accomplishments that we're proud of
Having a super user-friendly UI (that works on mobile :00), having reliable data that we summarized in simple and visual ways.
What we learned
We learned how we can use google api to build a dynamic map.
What's next for "Give me a raise"
What's next would be getting more data, for more countries, increasing speed performance, adding a tracking of salaries evolutions over time and links to job offers that have better pay.

Log in or sign up for Devpost to join the conversation.