-
-
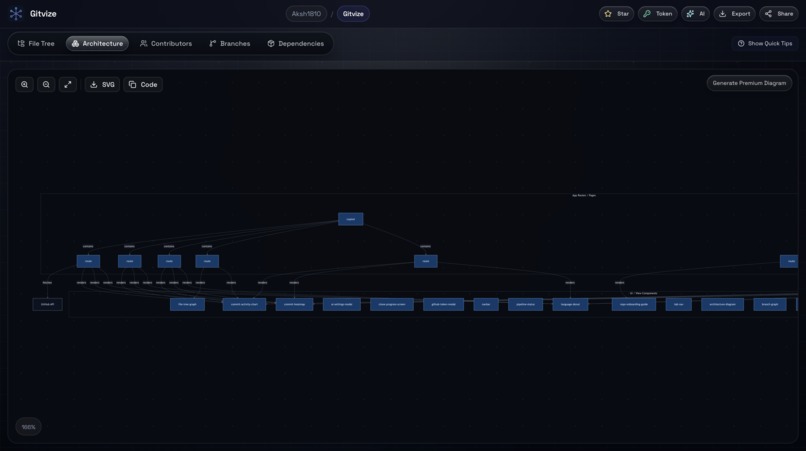
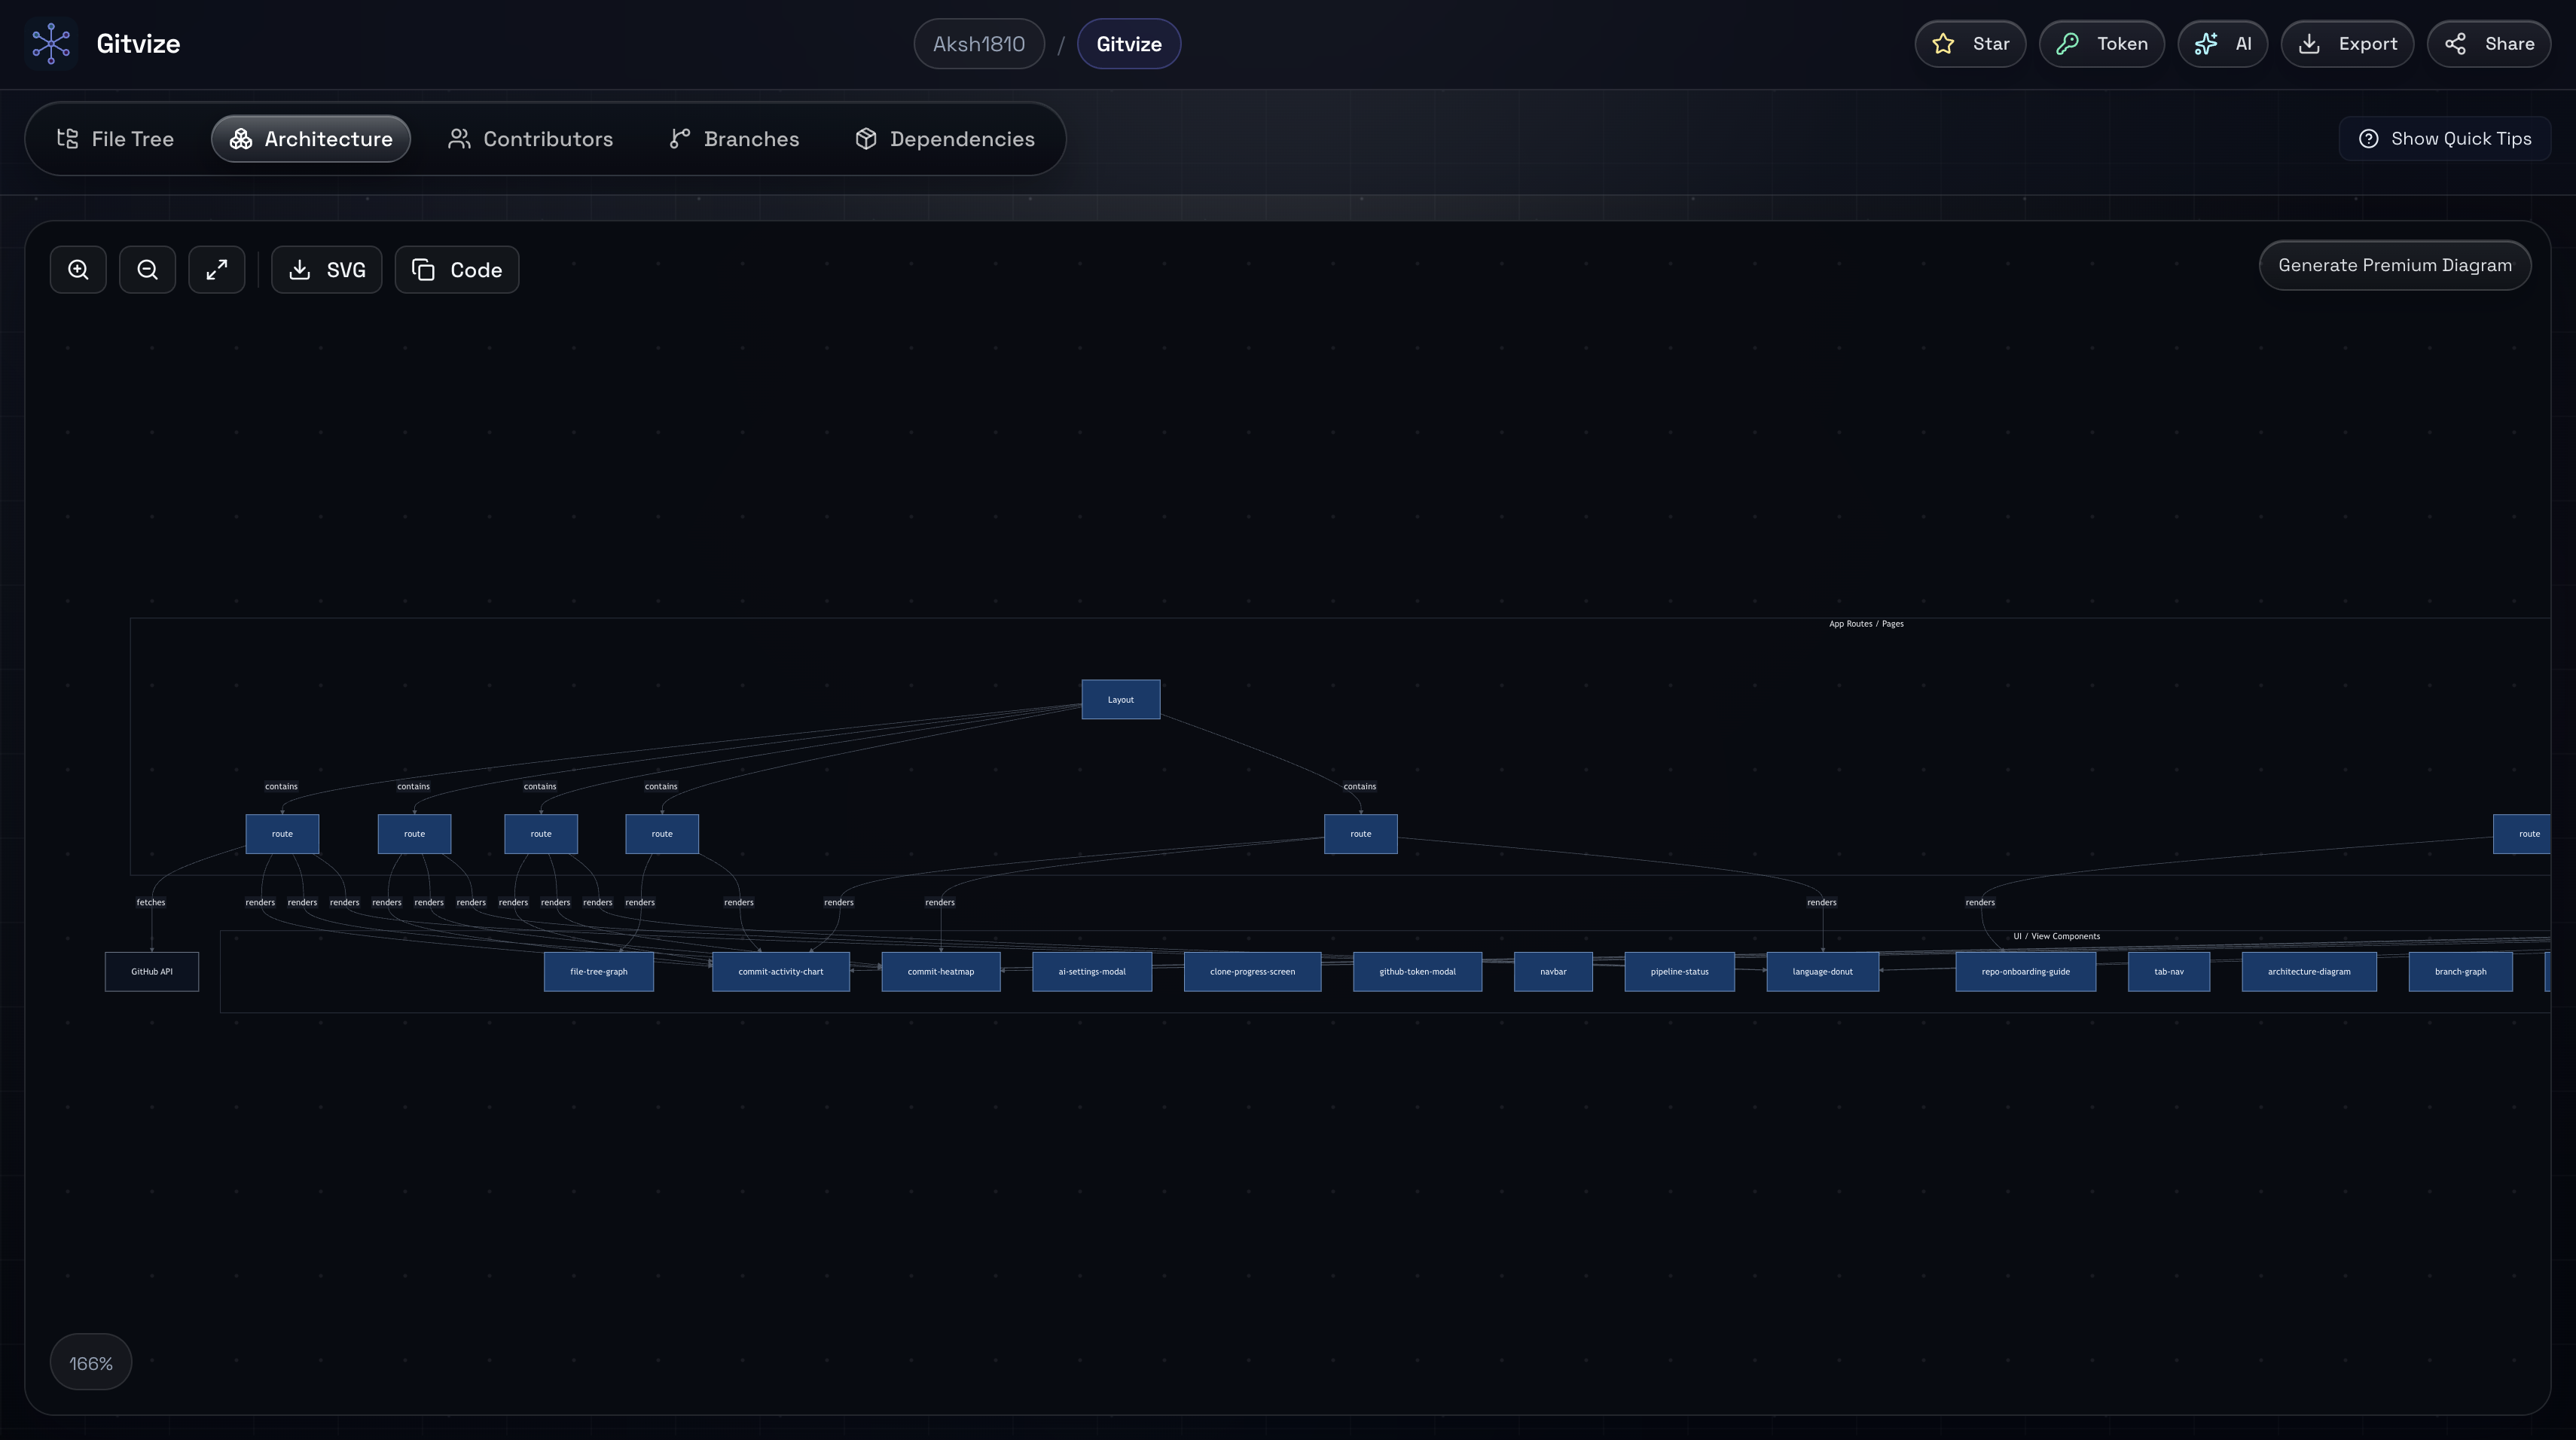
Architecture Diagram
-
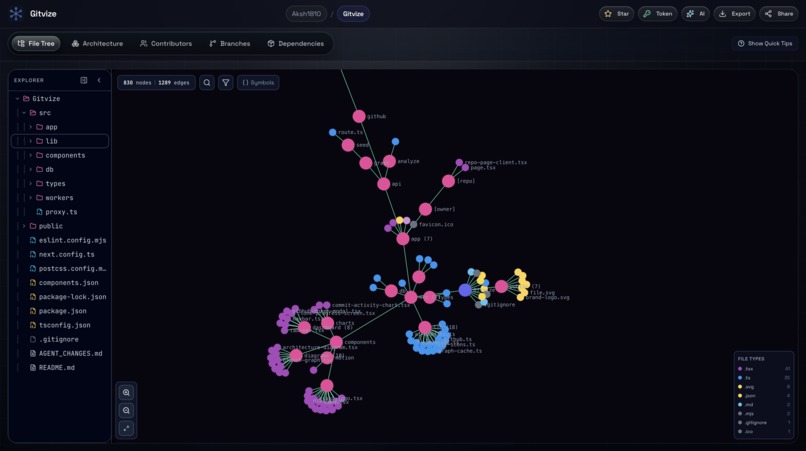
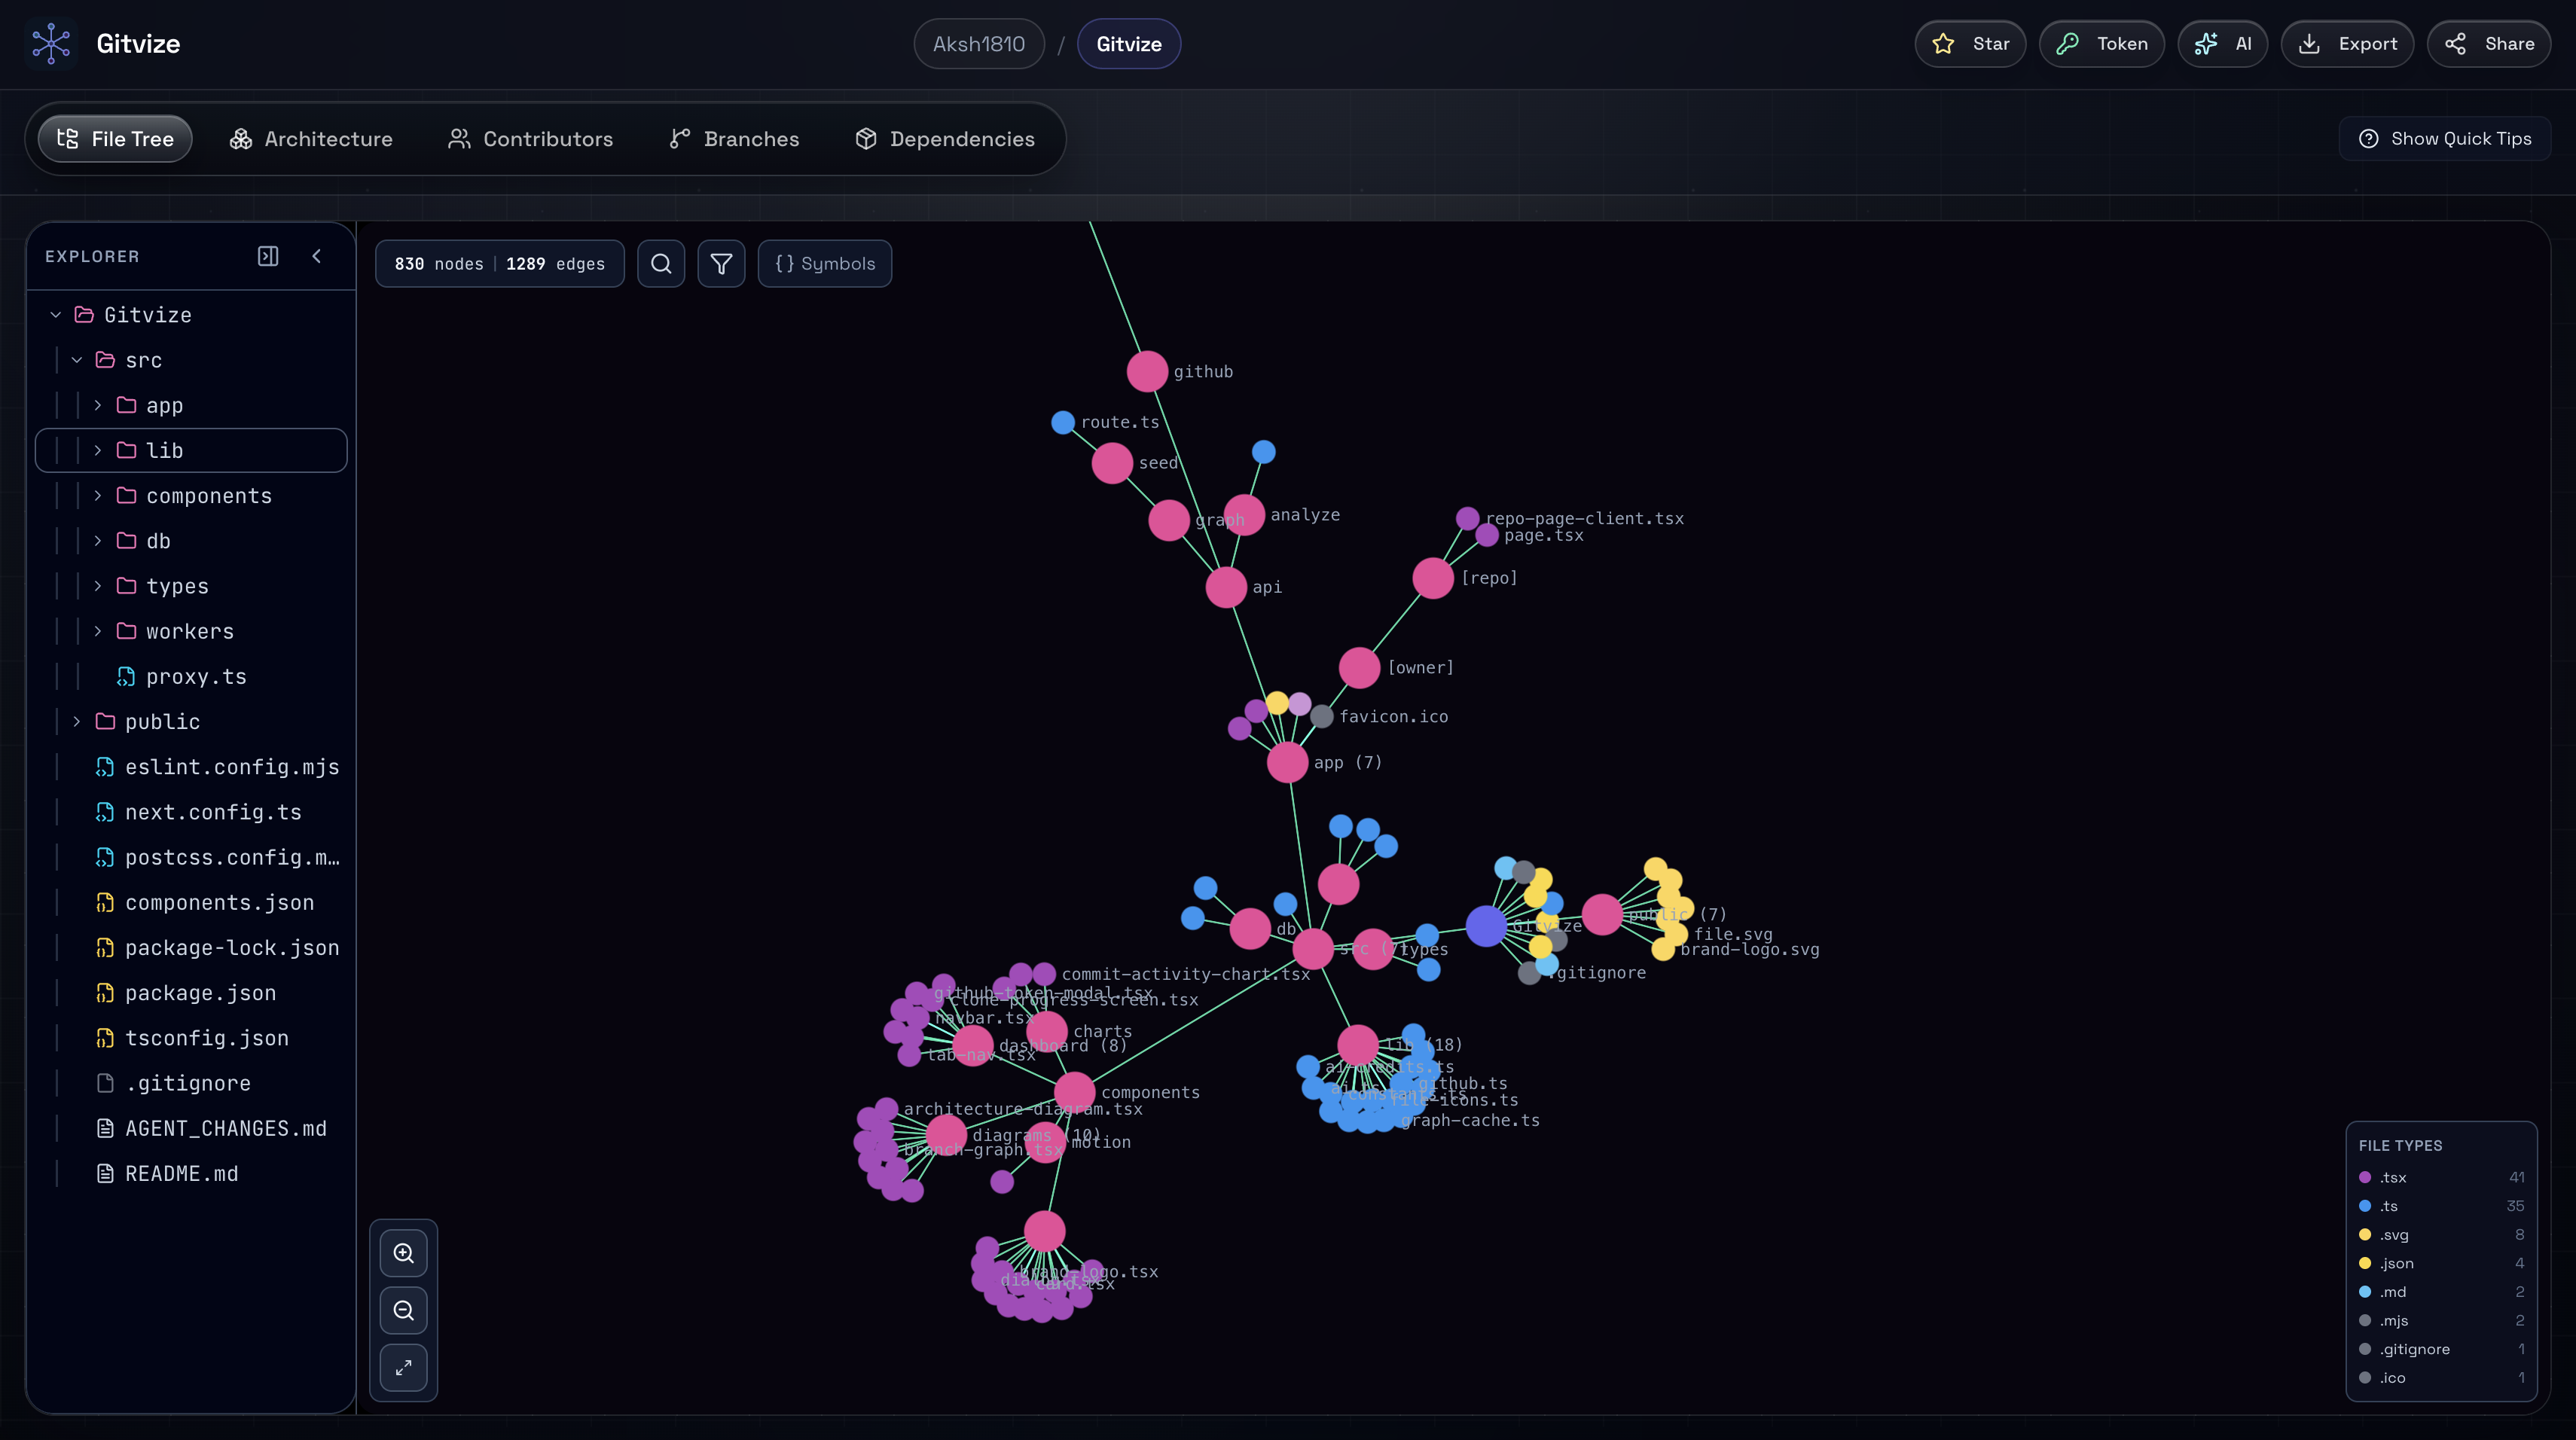
File Tree Graph
-
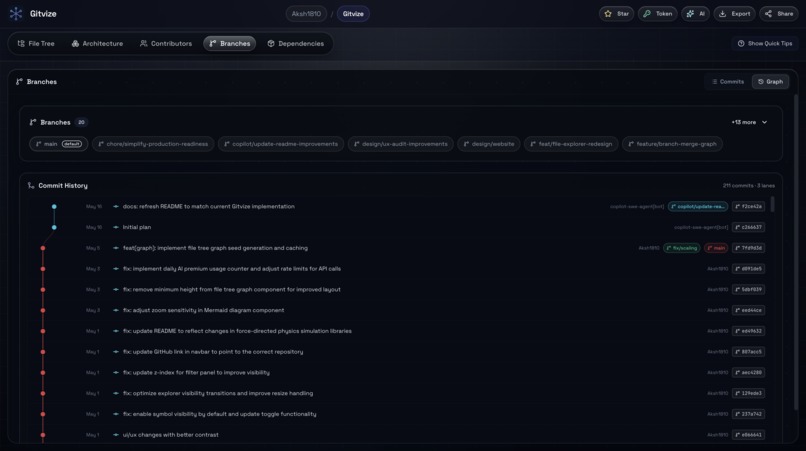
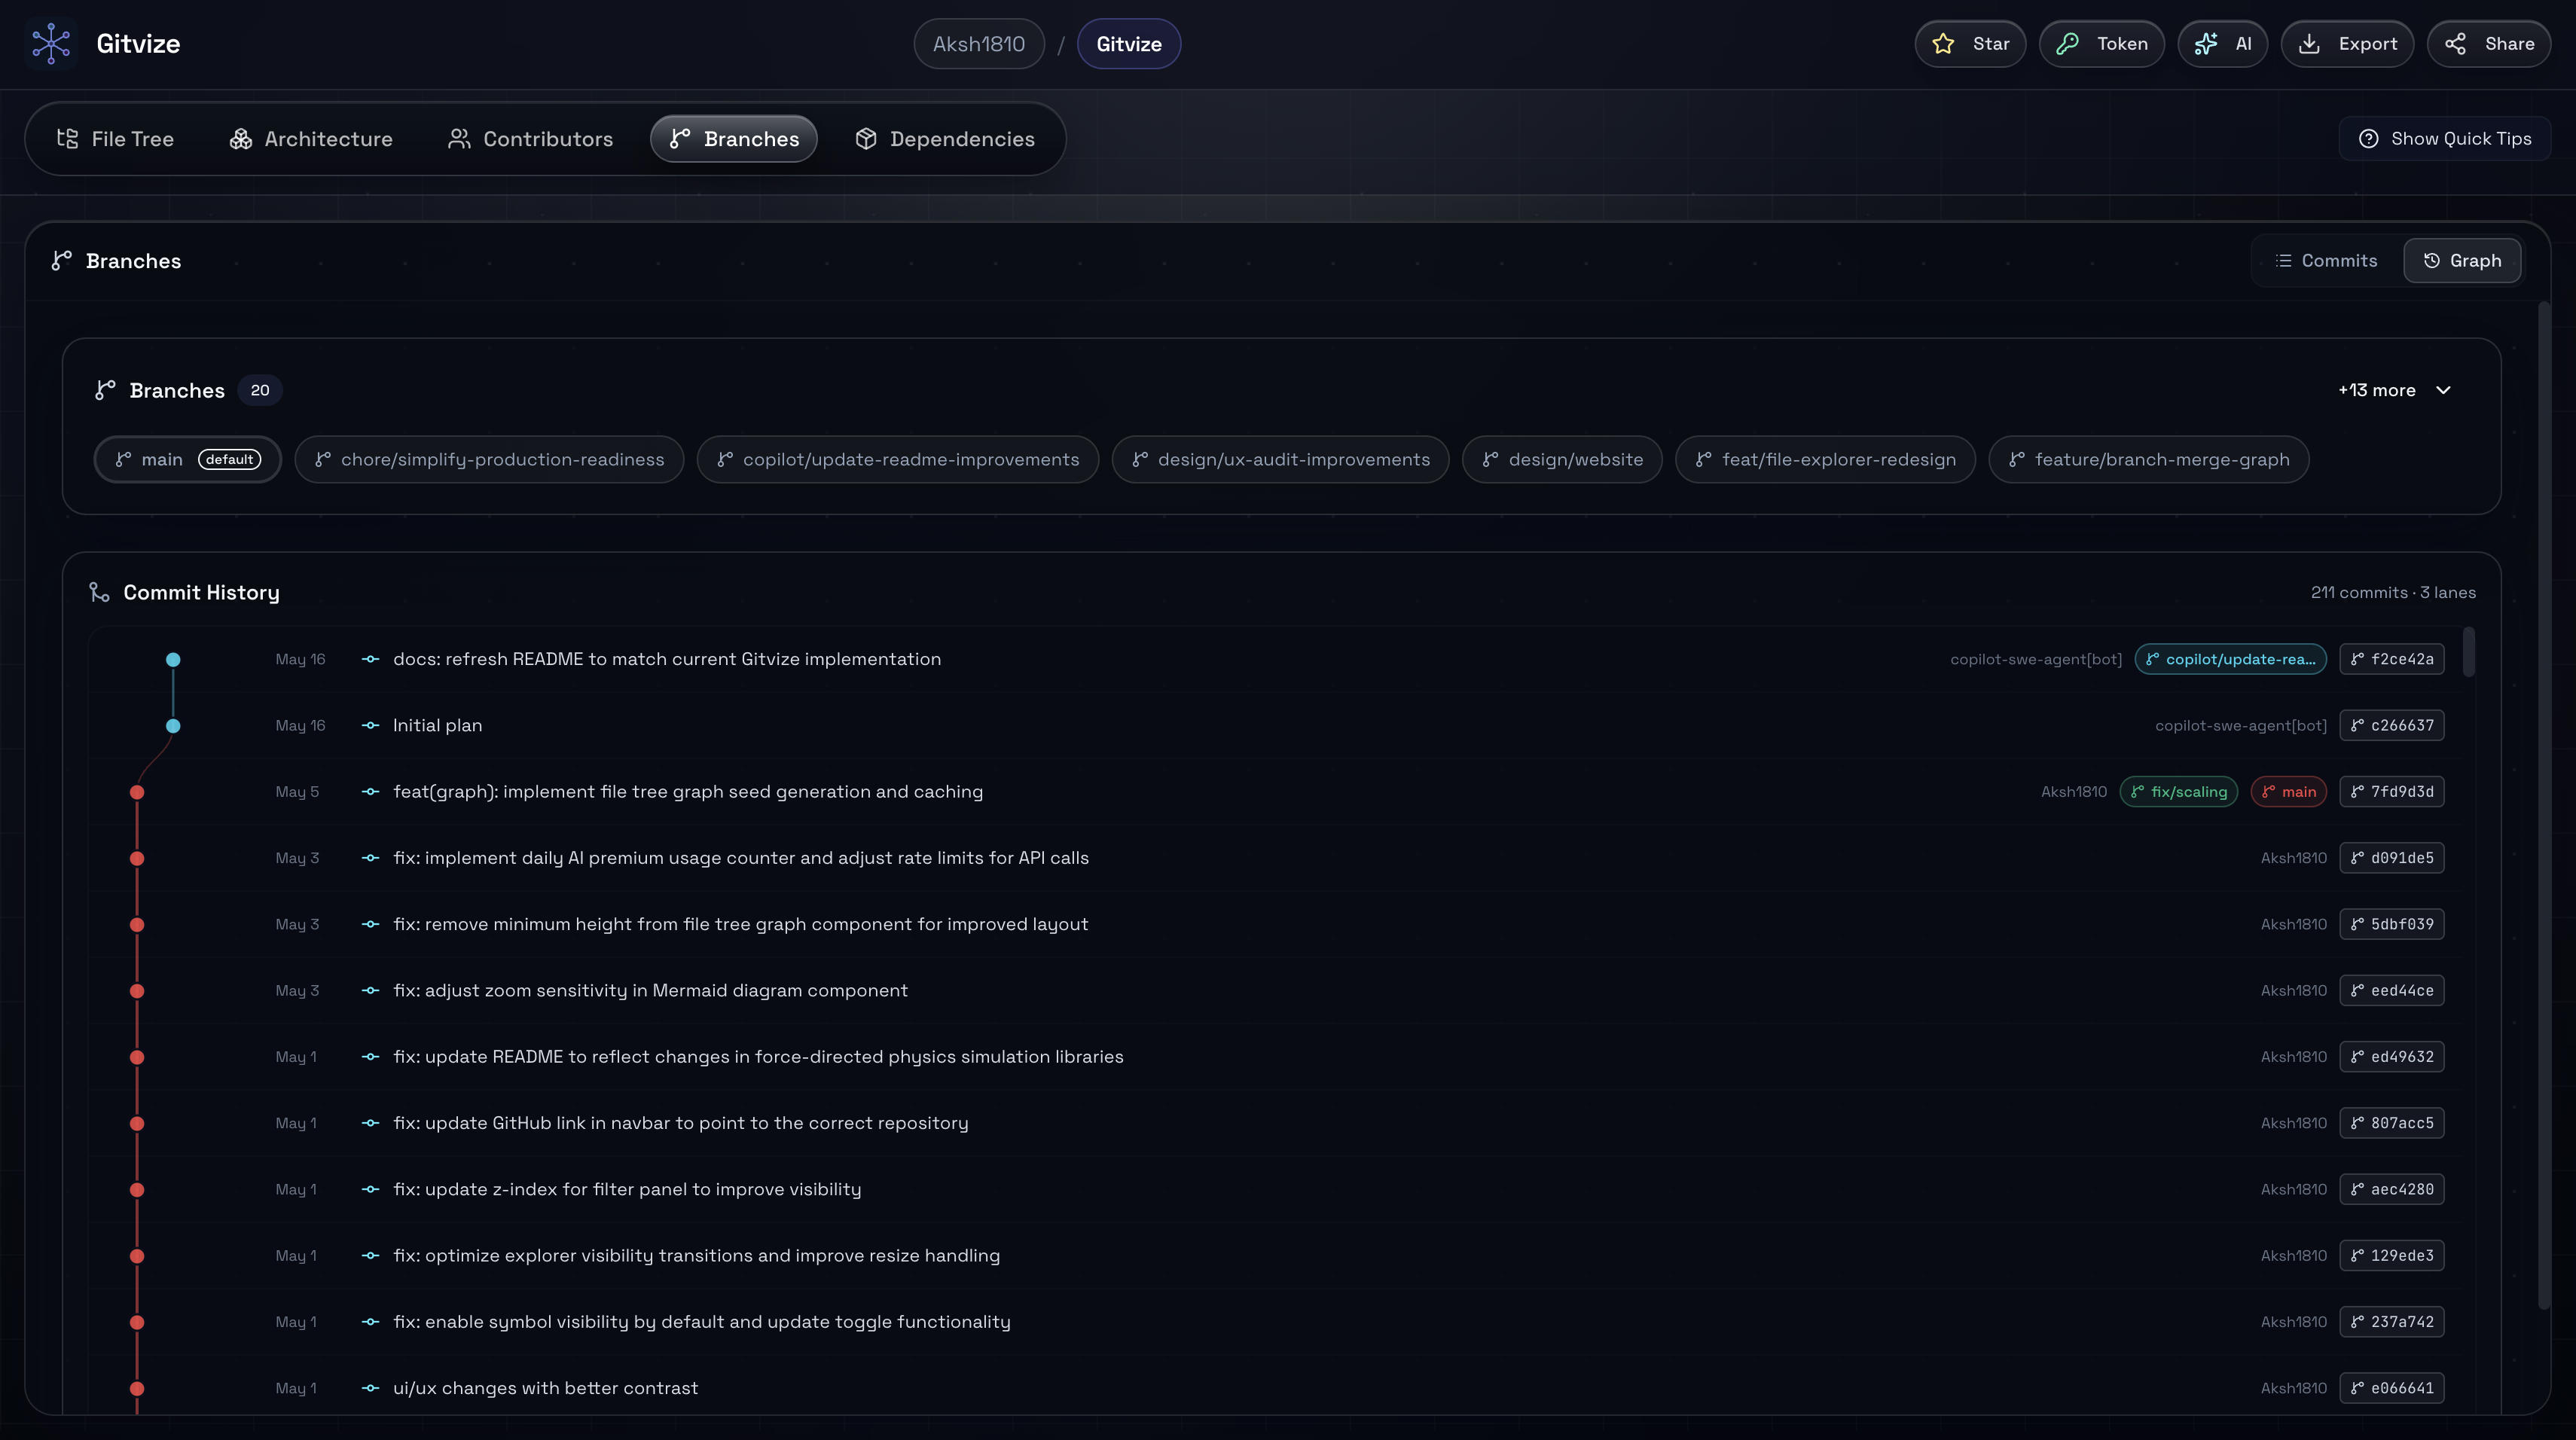
Branch History
-
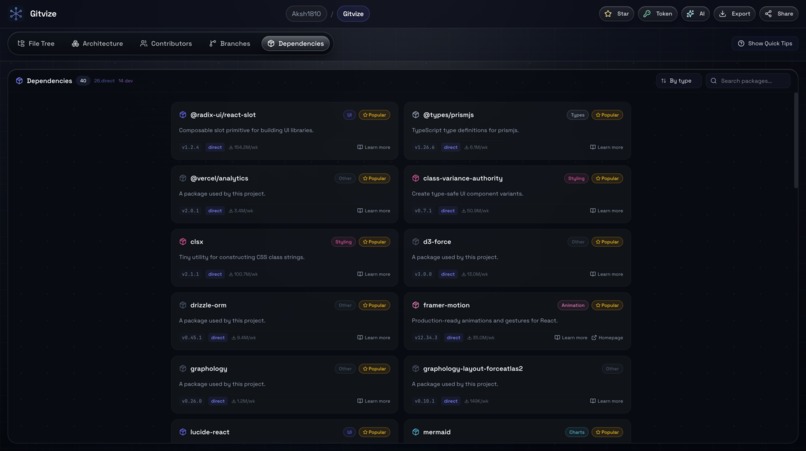
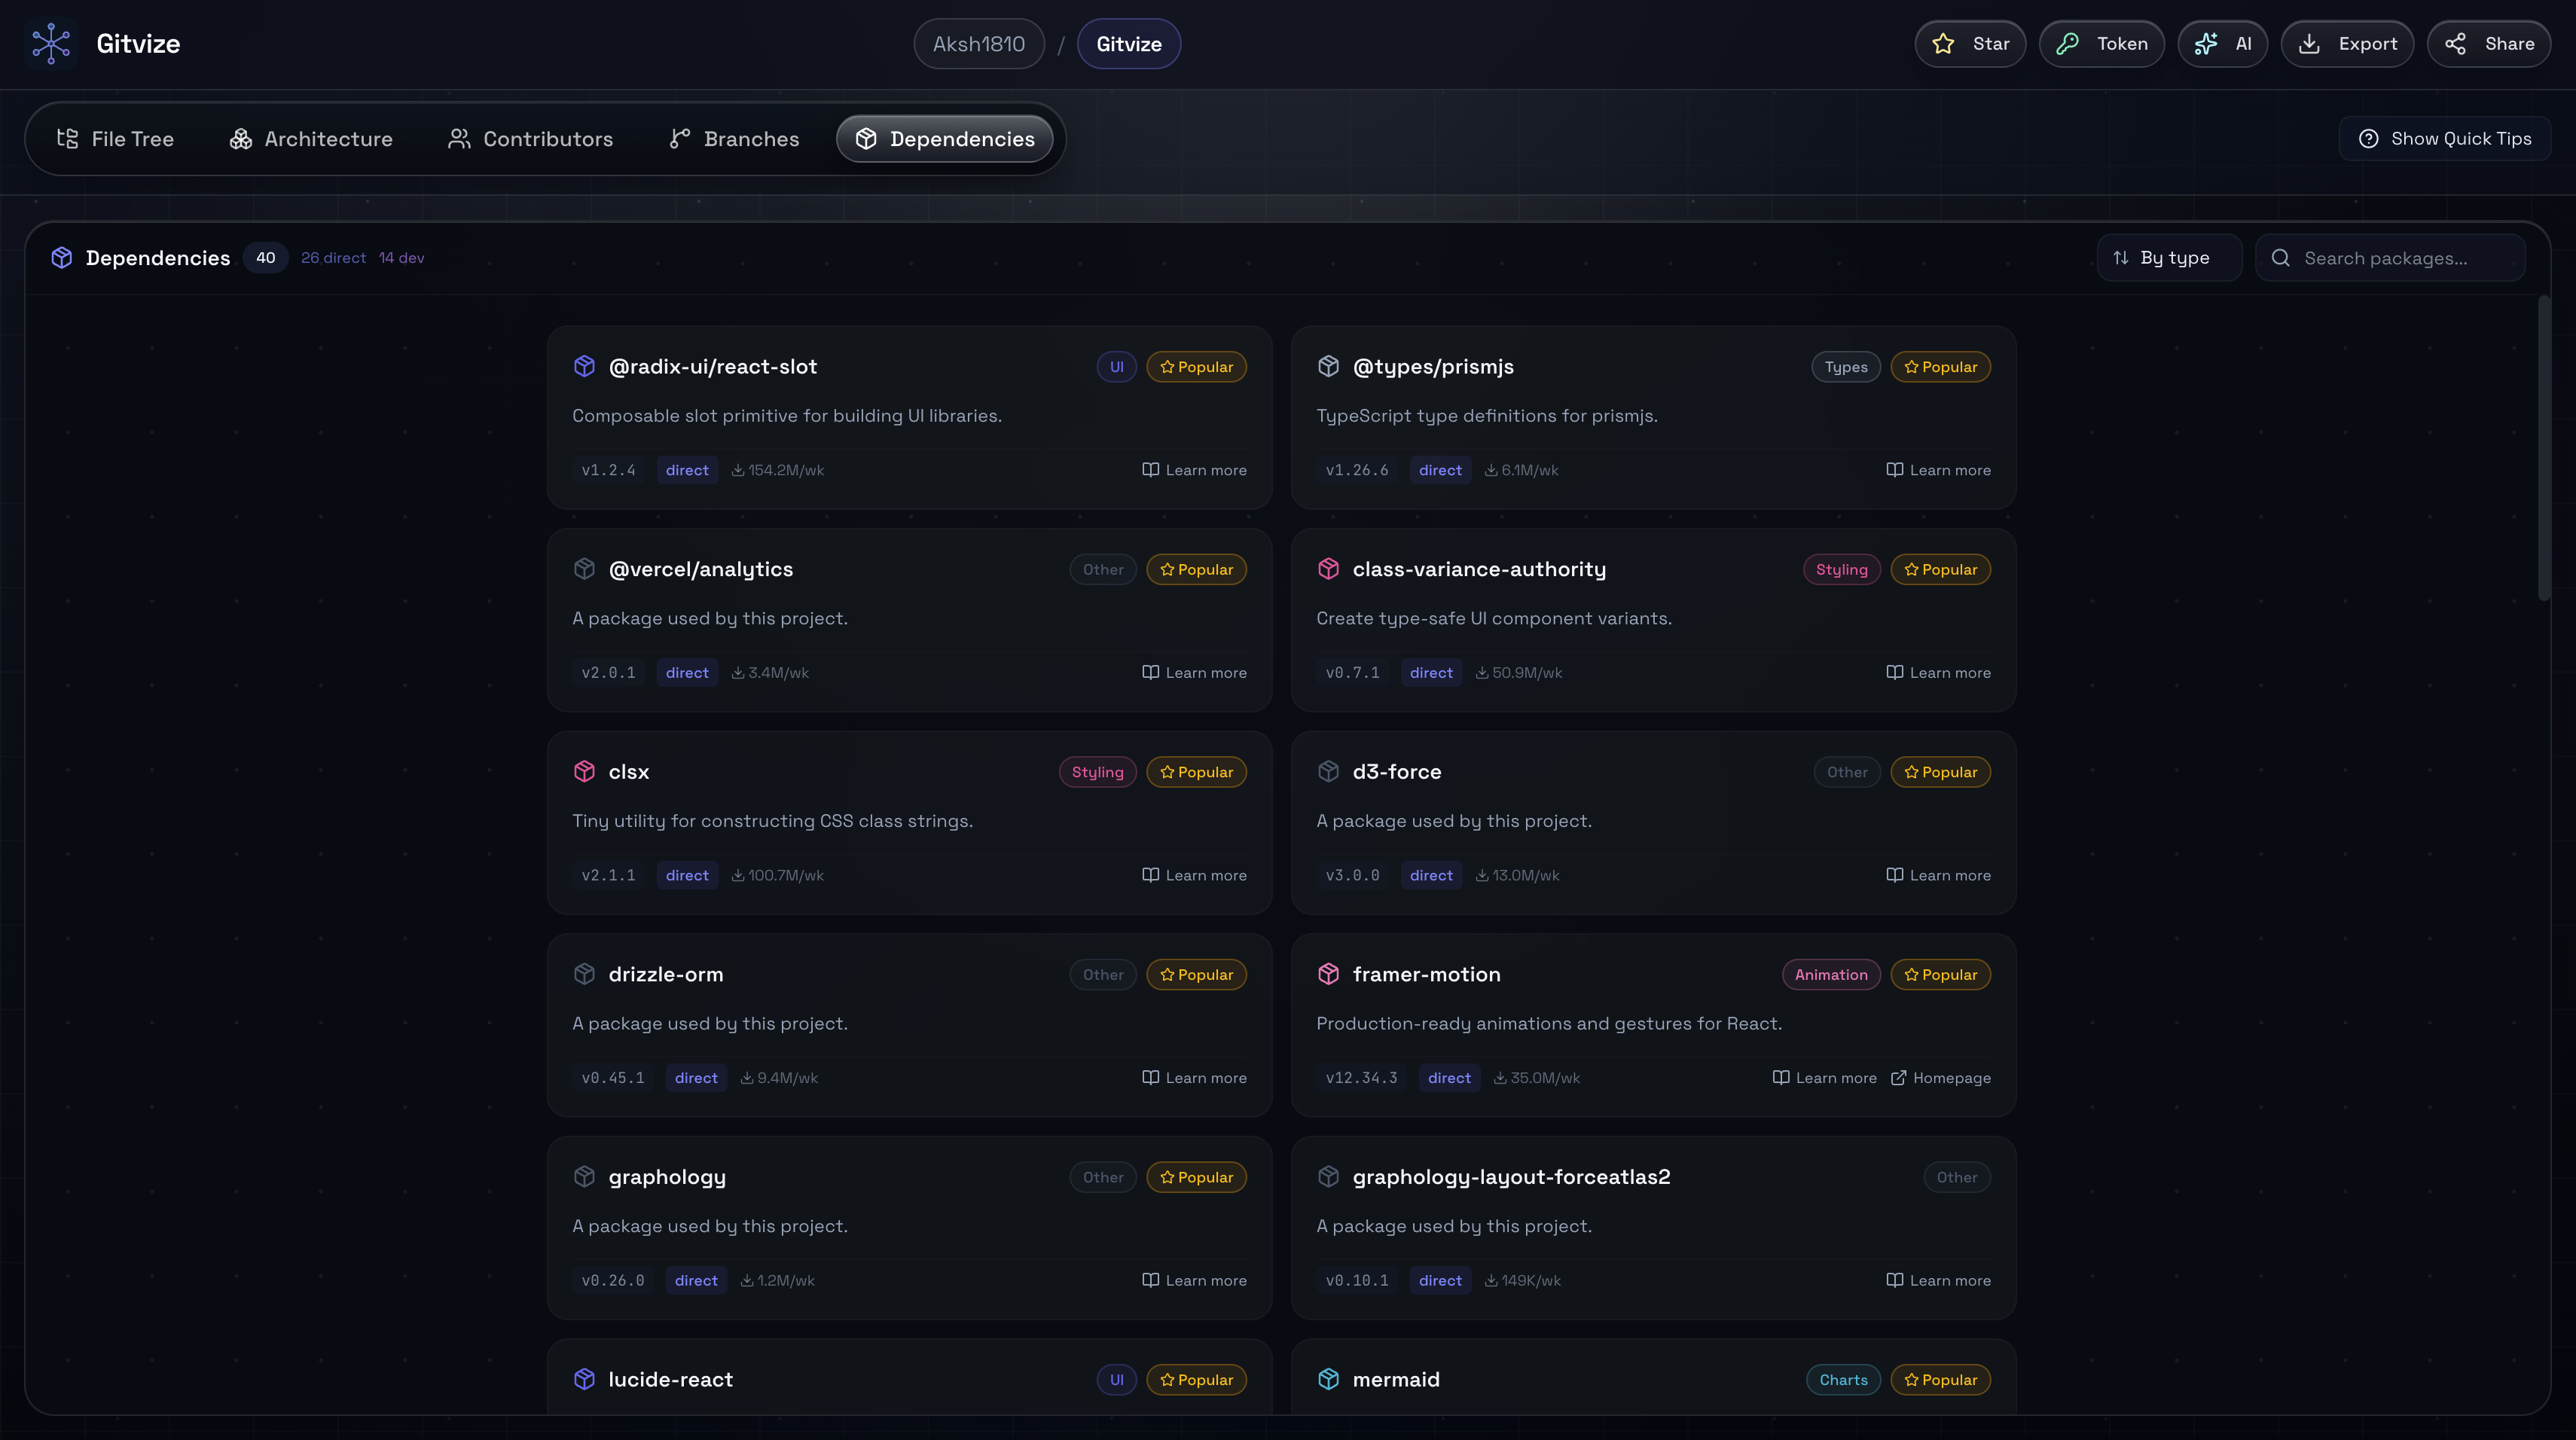
Dependencies List
Inspiration
Reading a new codebase is painful. I'd spend hours just trying to understand how files connected before writing a single line. I wanted a tool that made that first 10 minutes instant.
What it does
GitVize takes any GitHub repository and renders it as an interactive force-directed graph. You can explore file structure, see dependencies, filter by directory, and understand how a project is organized — visually, in seconds.
How I built it
Built with Next.js 14 (App Router), TypeScript, and Pixi.js with d3-force for the graph rendering. GitHub API handles repo data fetching, PostgreSQL + Drizzle ORM for caching, and deployed on Vercel.
Challenges I ran into
Performance was the biggest challenge. Early versions using Cytoscape and then React Flow collapsed on repos with 200+ nodes. Migrating to Pixi.js with a WebGL renderer and tuning the d3-force simulation parameters made large repos actually usable.
Accomplishments that I'm proud of
Getting smooth 60fps rendering on repos with 300+ nodes. The filter UX that lets you drill into specific directories without losing graph context.
What I learned
WebGL rendering is a completely different mental model from DOM-based approaches. Also learned a lot about GitHub's rate limits the hard way.
What's next for Gitvize
Dependency graph visualization (imports/exports), contributor heatmaps.
Built With
- d3-force
- drizzle-orm
- github-api
- next.js-14
- pixi.js
- postgresql
- posthog
- typescript
- vercel

Log in or sign up for Devpost to join the conversation.