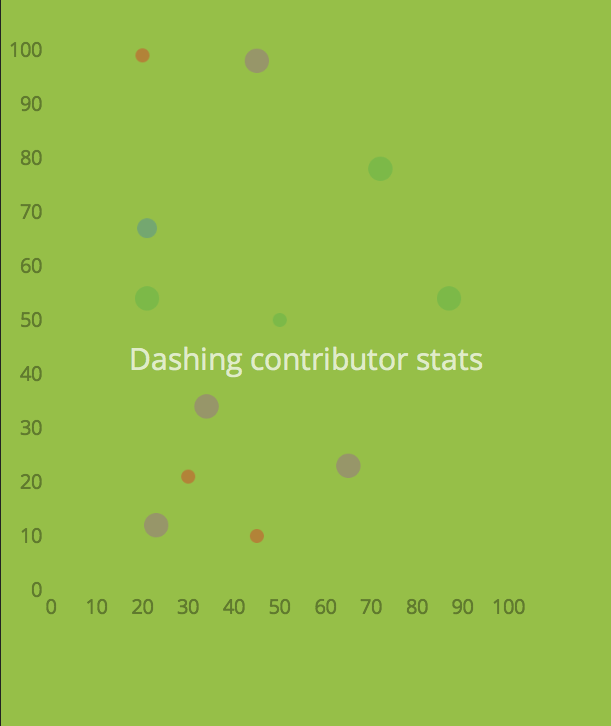
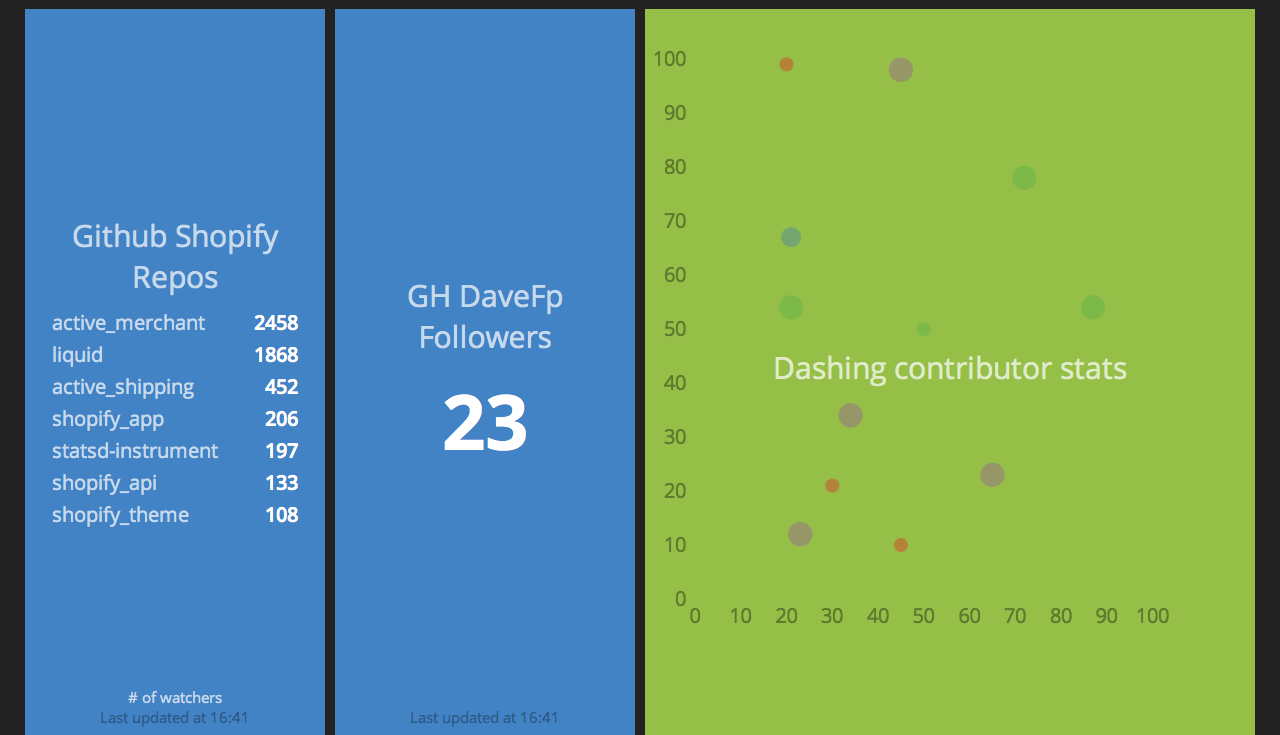
The bubble graph widget depicts 4 dimensional data in form of a bubble graph. In this particular example contributor stats from a github repo are represented. The bubbles in the graph represent the contributors. The x-axis represents the number of commits, y-axis the commitsize(number of lines deleted or added) and the radius of the bubbles represent the age of the contributor (based on the first commit made).
Updates

Leave feedback in the comments!