Inspiration
Our inspiration for this project came from EOG resources itself who gave a create theme that was an analogy to real world systems used like oil and gas operations. That really helped us understand the prompt as well as simplify a more complex problem. Additionally for the UI dashboard interface, we got the inspiration from other websites specifically dribble and tailwind UI, from these we wanted to make similar sleek and professional looking dashboard that fit the theme of Cauldrons.
What it does
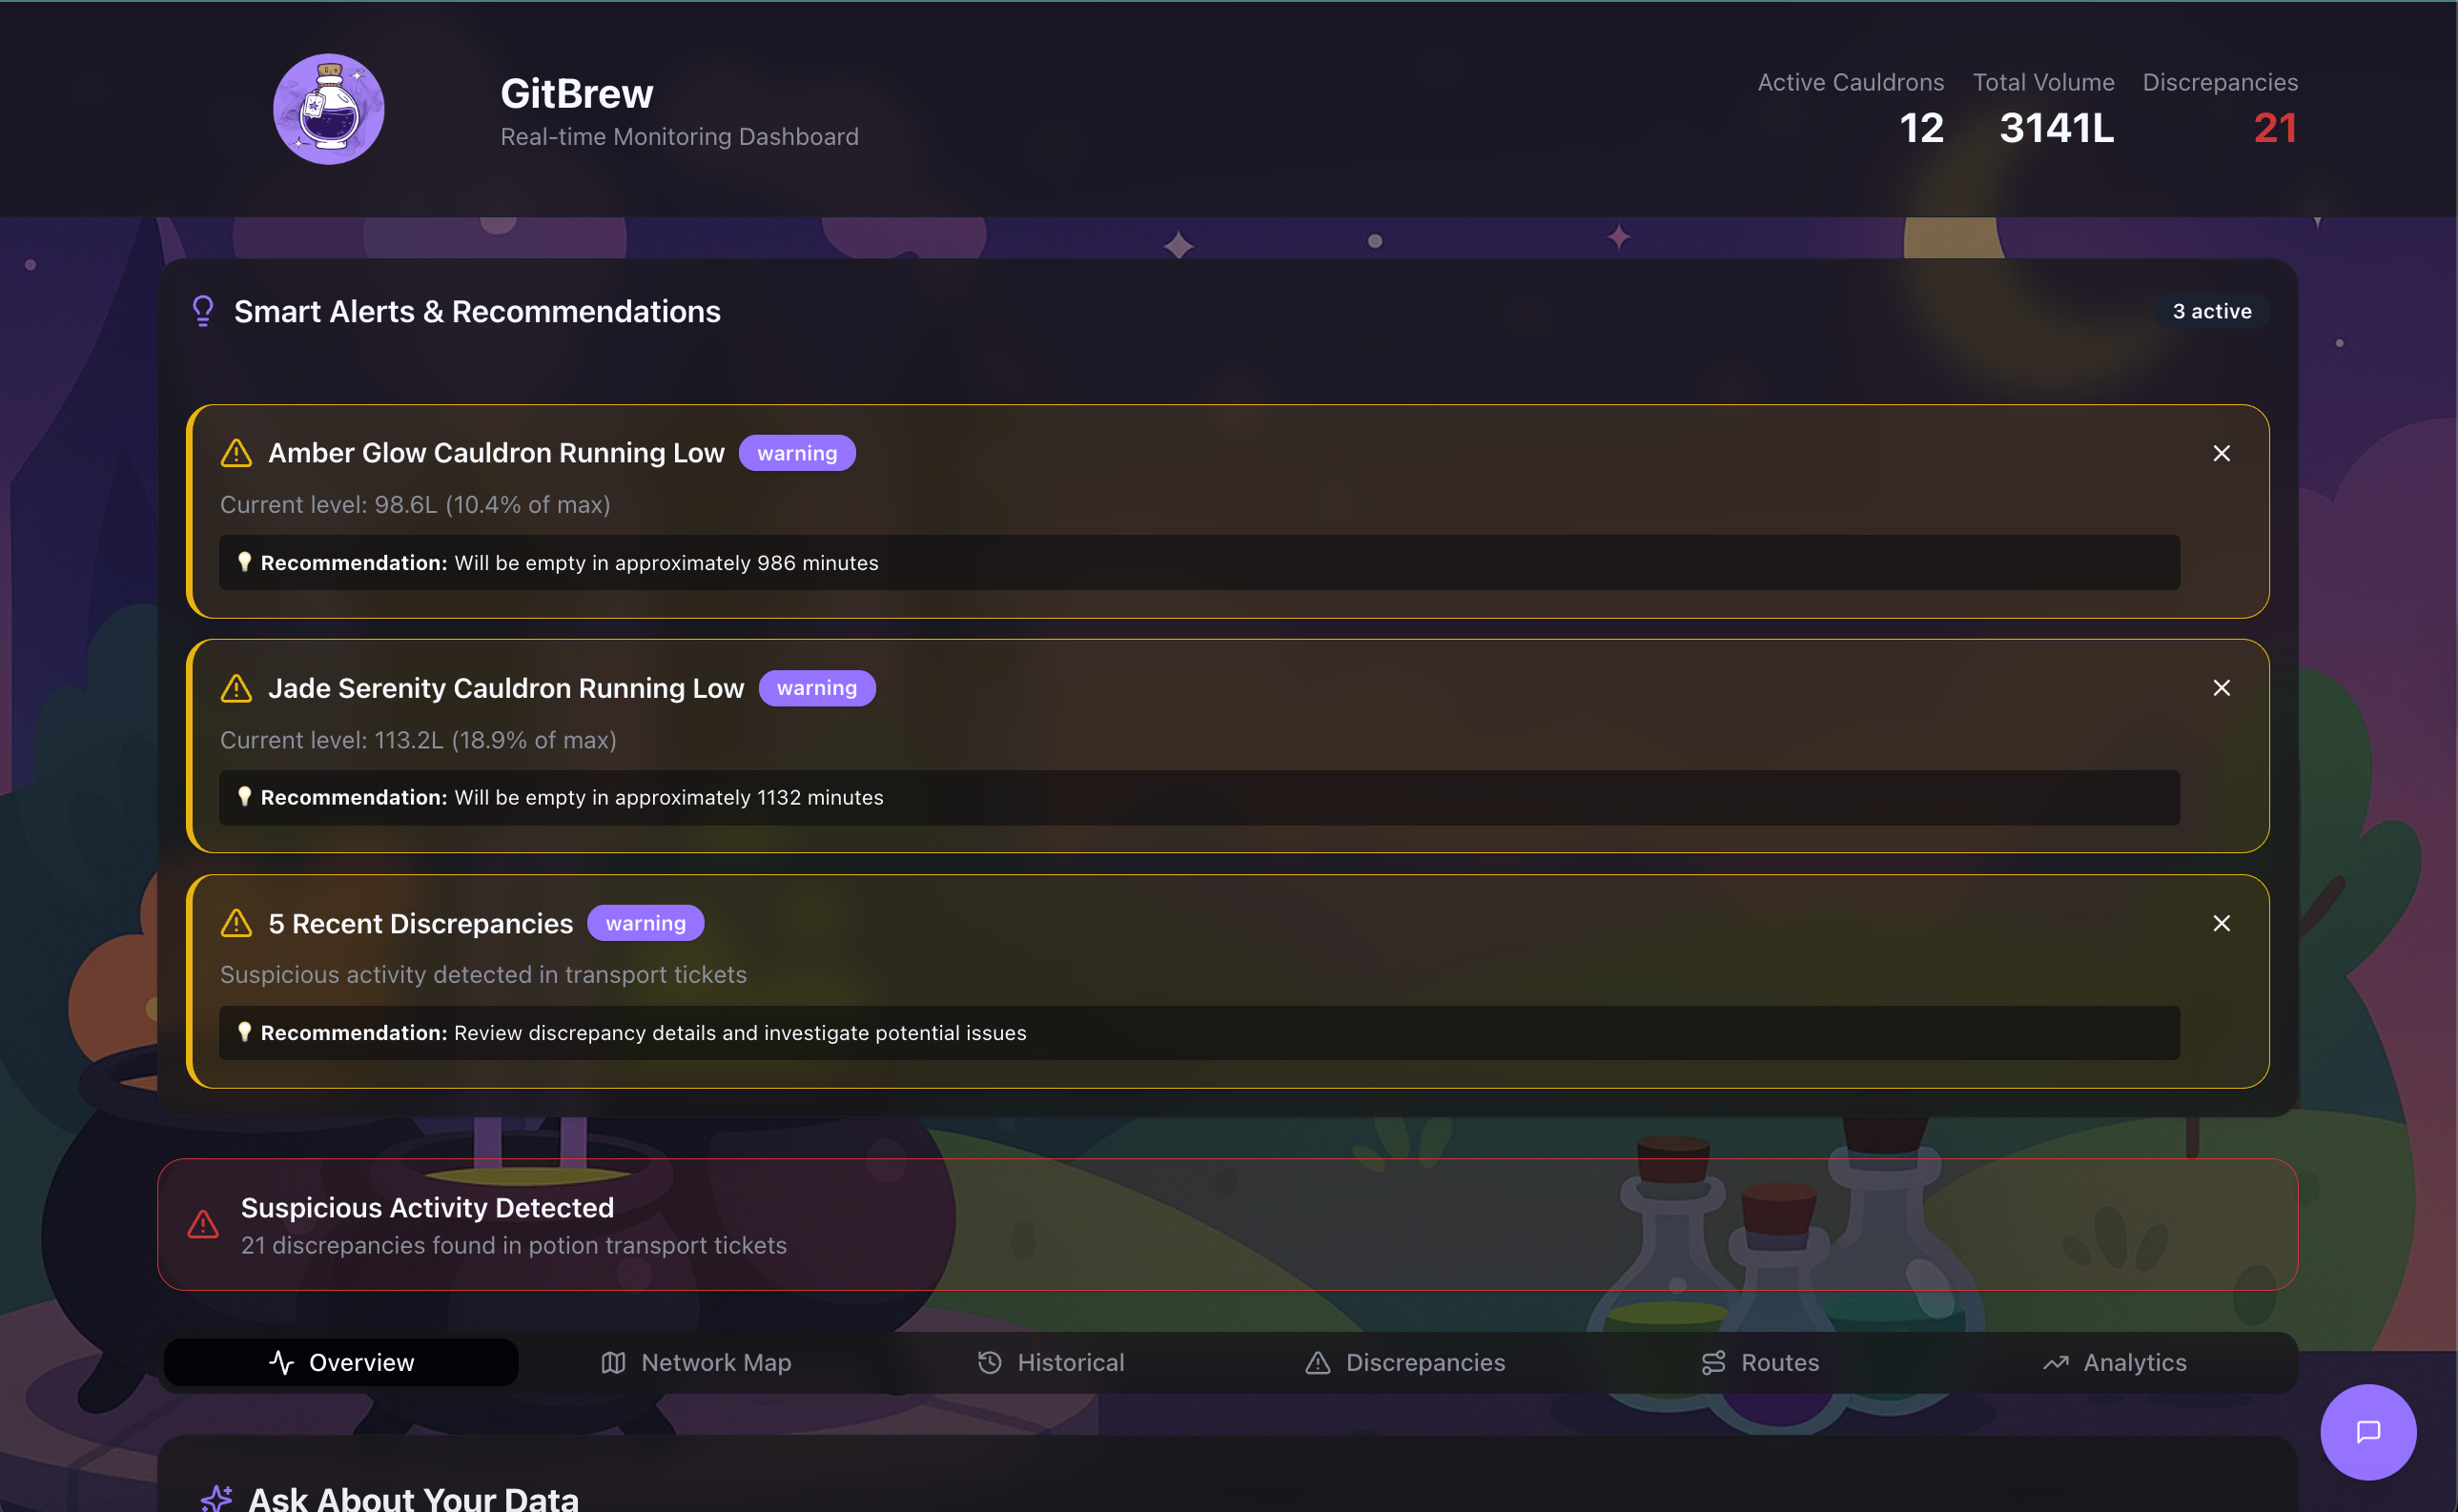
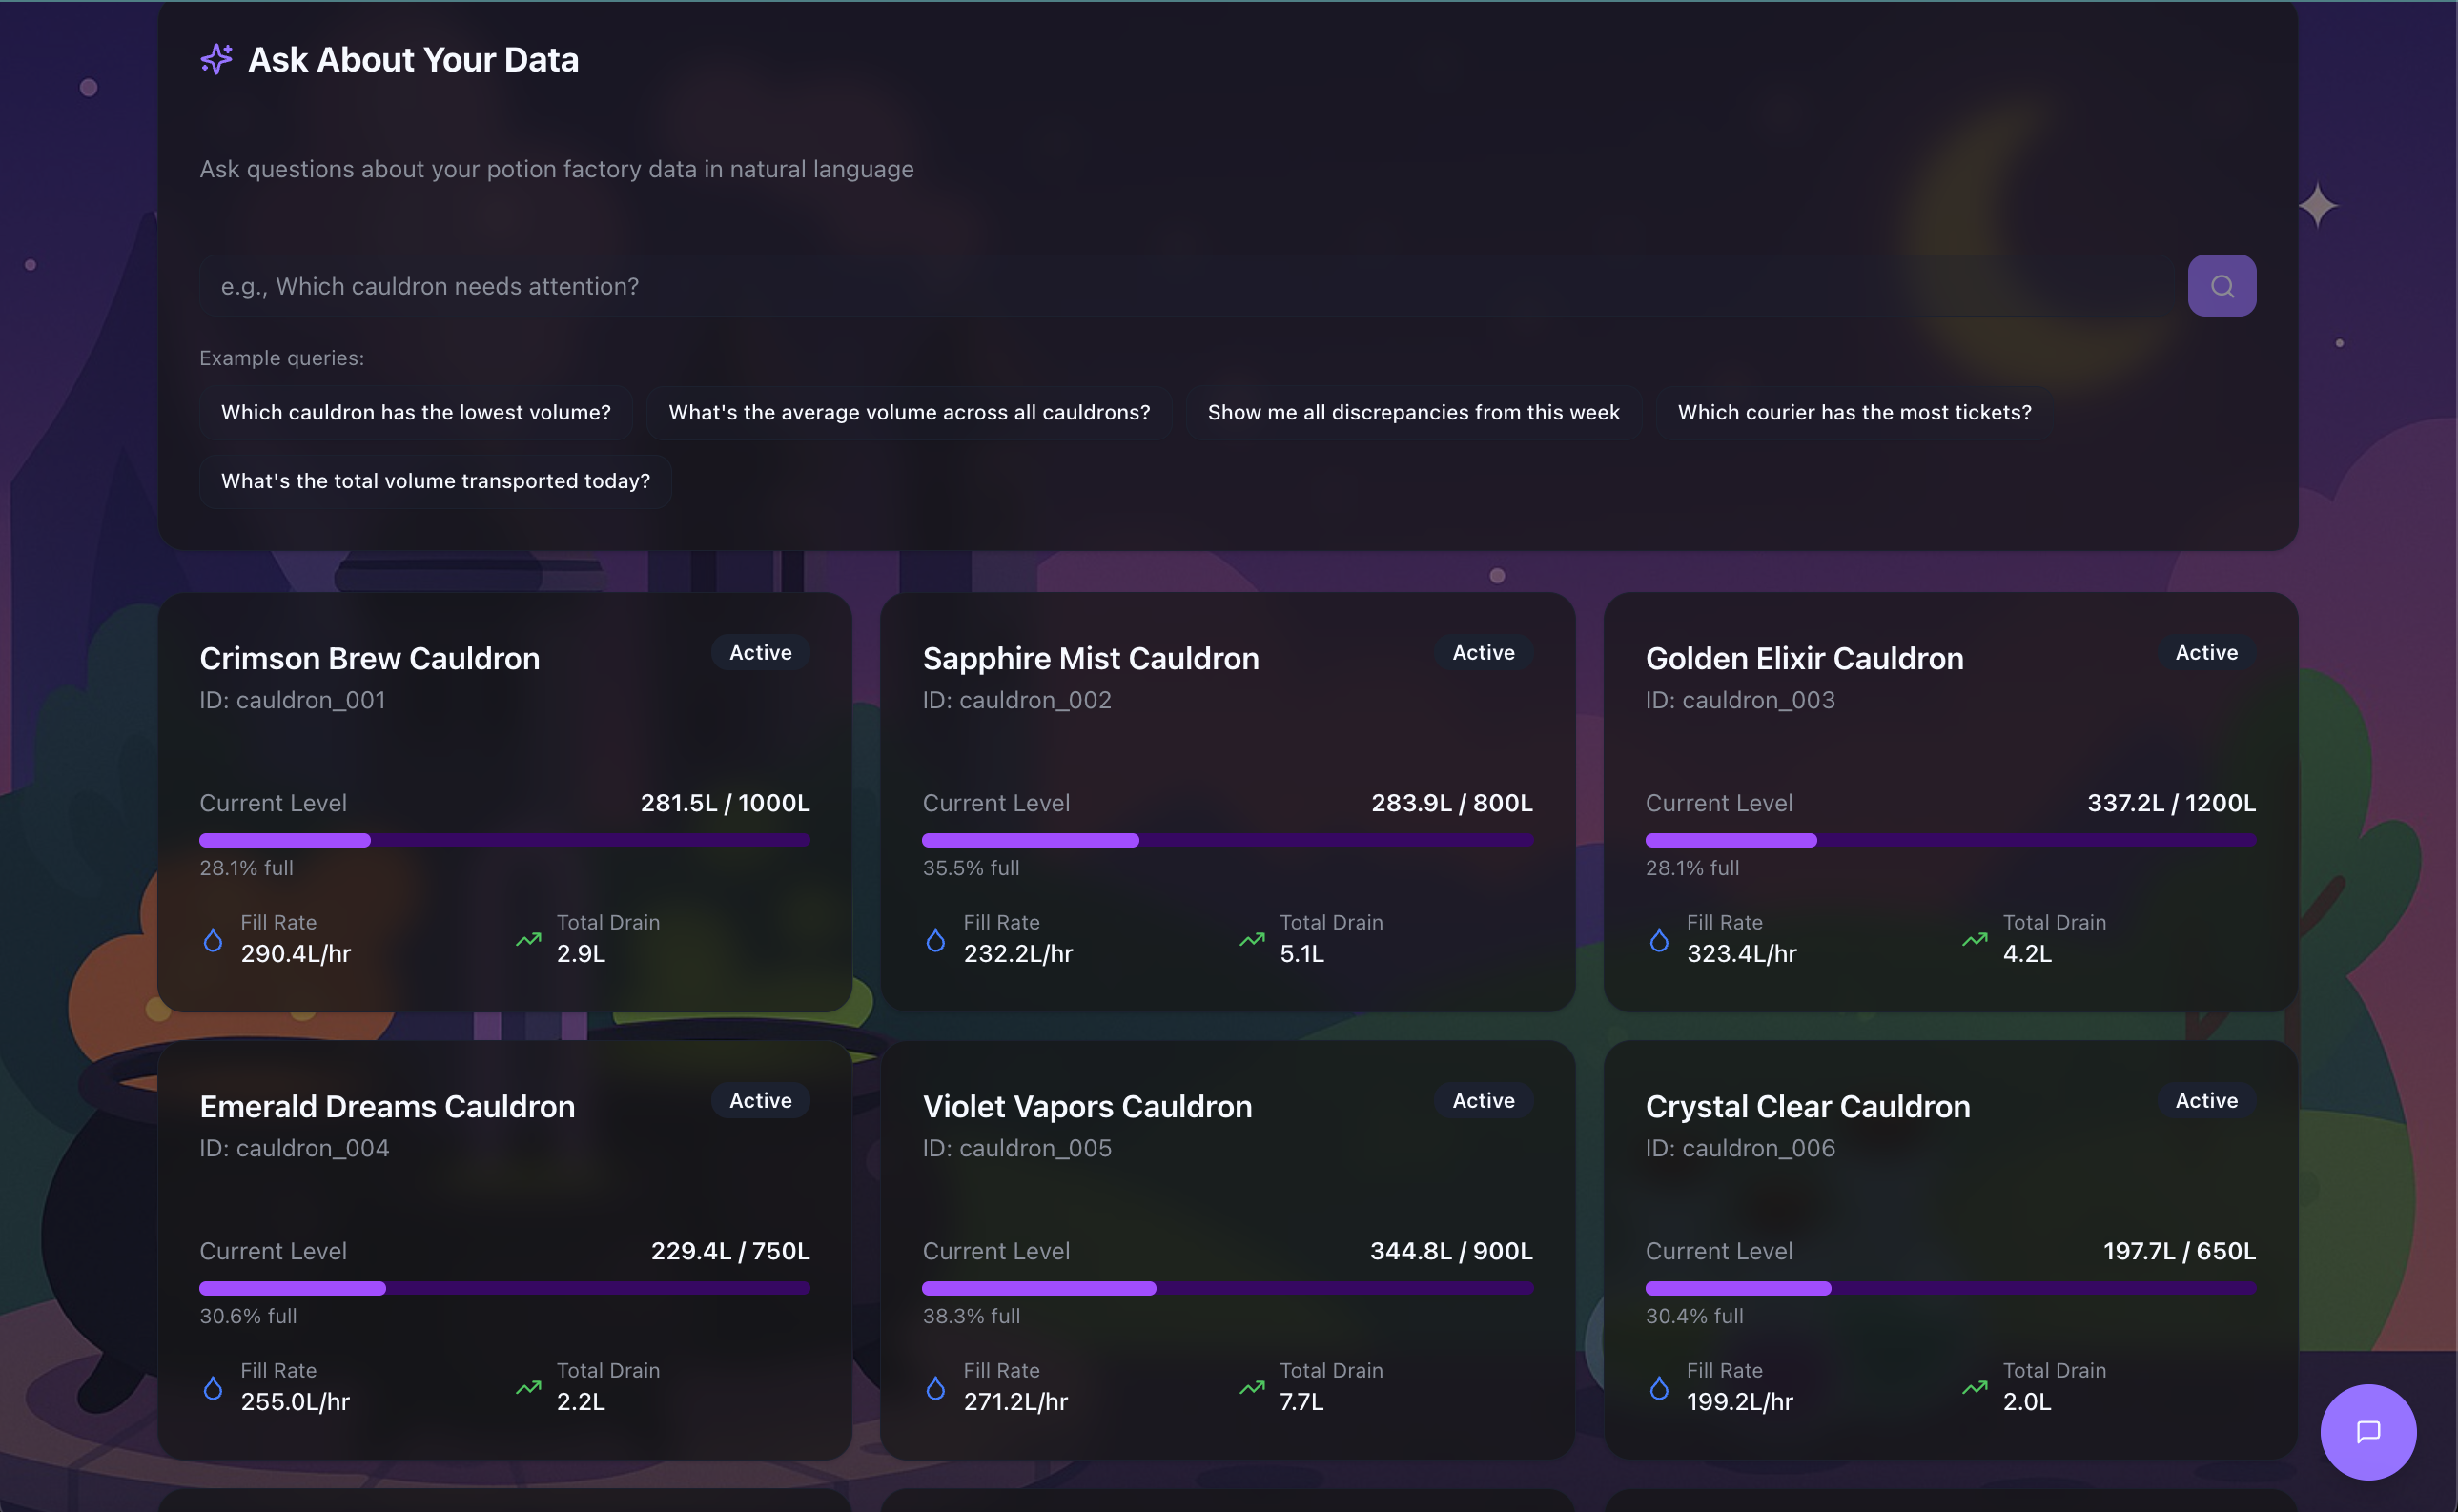
Our project is a real time monitoring dashboard that tracks the levels and movement of of potions across multiple cauldrons in a simulated Factory system. It correlates any cauldron level changed with transportation couriers. It also flags ticket discrepancies if the data isn't matching tickets. Lastly it summarizes the statistics and gives optimized routes of transportation for the witches.
How we built it
Our project was built using a full stack javascript setup that focuses on real time data visualization and a clean UI design. The frontend use's Next.js which is react based and used to build the interactive dashboard. We also used CSS in the front end for the clean interface. The front end included chart.js to make the live graphing of cauldron levels. The backend and data handling was done by Next.js routes to handle server less functions like getting data and merge cauldron data with the ticket logs. Our development tools were VS code and GitHub.
Challenges we ran into
One of the first challenges we ran into involved handling the messy data of the cauldrons because it was tricky finding out how often the data updated as well as aligning the ever changing data with the transport ticket times. Another challenge was visualizing the changing real time data, meaning our graph. We struggled heavily with this one in an attempt to sync data with the chart and have the witch couriers move from one cauldron to the next at the right time. One of the last big challenges was calculating the discrepancies of data when needed to detect if there was drainage, missing data points, or unlogged tickets.
Accomplishments that we're proud of
The accomplishment our team is most proud of is creating a fully functional real time dashboard that visualizes potion levels and transport data in a easy to read manner. Another of our big accomplishments was implementing the data discrepancy detection allowing the program to automatically detect when potion levels drop even when there isn't a recorded transport ticket. Lastly, we were happy how our program came out as a whole because it looked very pleasing and creative when being used.
What we learned
In this project we learned to use raw unstructured data and turn it into useful visual using web technologies. We gained a better understand of how real time data systems work like handling irregular timestamps and merging multiple data sources. On the frontend side we learned how to build a responsive dashboard with involved polishing our React and Next skills. We also learned the importance of data validation and correlation logic to make sure information is accurate and displayed properly.
What's next for Git Brew
The next step for Git Brew is more powerful and scalable platform. We want to integrate real time streaming data instead of just pulling data periodically from files or API's, maybe using tool's like WebSocket's. When it comes to the visualization side, we'd like to include more custom alerts, filters, and interactive map views for easier navigation. Then after all these changes we would hope to connect Git Brew with Industrial fluid monitoring or oil production tracking companies and software.
Built With
- elevenlabs
- gemini
- next.js
- radixui
- react
- recharts
- tailwind
- typescript


Log in or sign up for Devpost to join the conversation.