Write-up
Inspiration
The general manager of The Gilded Ace, a 300-machine Las Vegas casino, has a simple plan: replace the 10 slot machines that earned the least between January and June. It sounds obvious, but it isn't. A machine can earn little for many reasons:
- it had a normal unlucky stretch (slot results swing a lot);
- it sits in a quiet spot where few people walk;
- it was often broken;
- it's configured to pay back more, so it keeps less of every dollar played;
- or the machine itself really is weak, and players avoid it.
Only the last one is fixed by replacing it. A new $22,000 machine dropped into a quiet corner earns like a machine in a quiet corner. We wanted to build something that answers the challenge's question, luck, location, or a leak?, before anyone spends real money, and that a manager can understand in five seconds.
What it does
The Gilded Ace Floor Review is an interactive, story-driven dashboard that walks a manager from the question to a decision in five chapters:
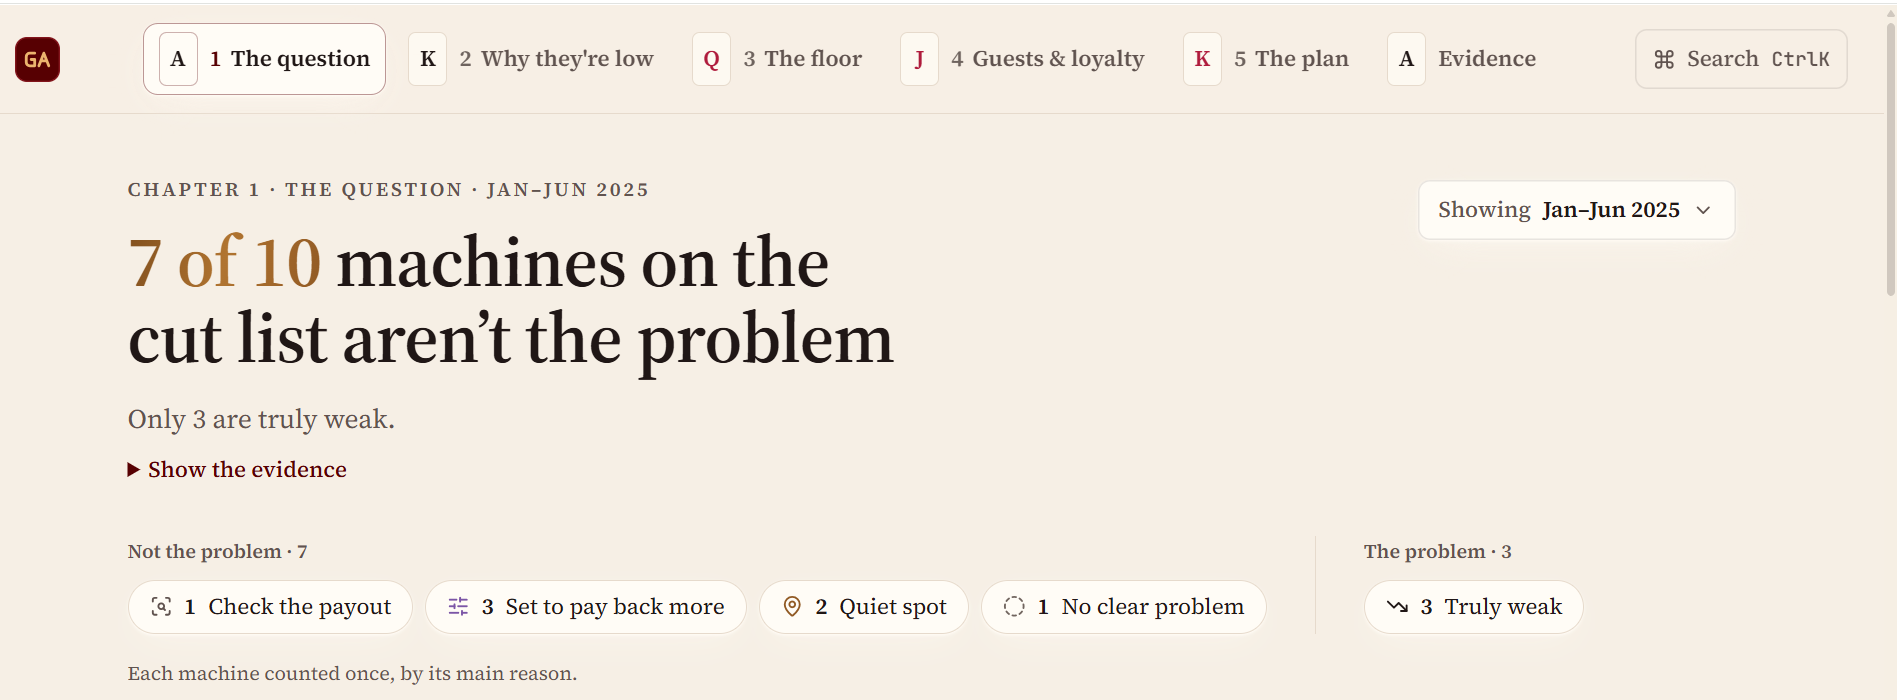
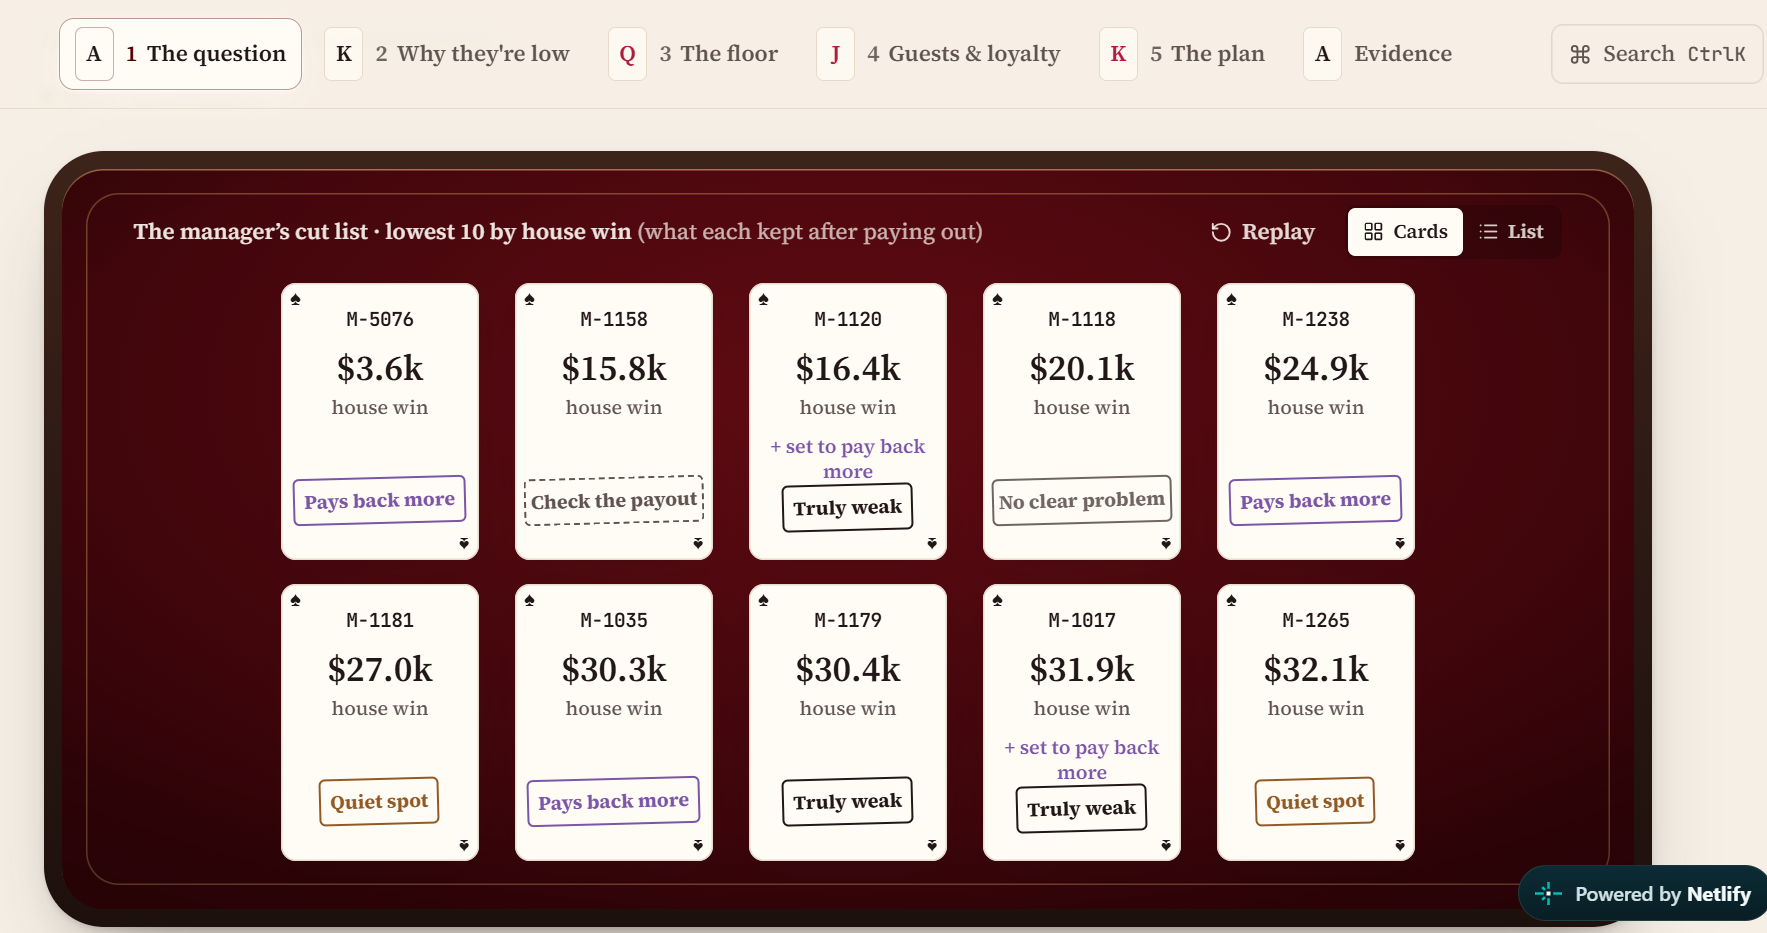
- The question. The manager's 10 machines are dealt face-down on a felt table, then flip one by one to reveal why each one earned little. The answer: 7 of 10 aren't the problem.
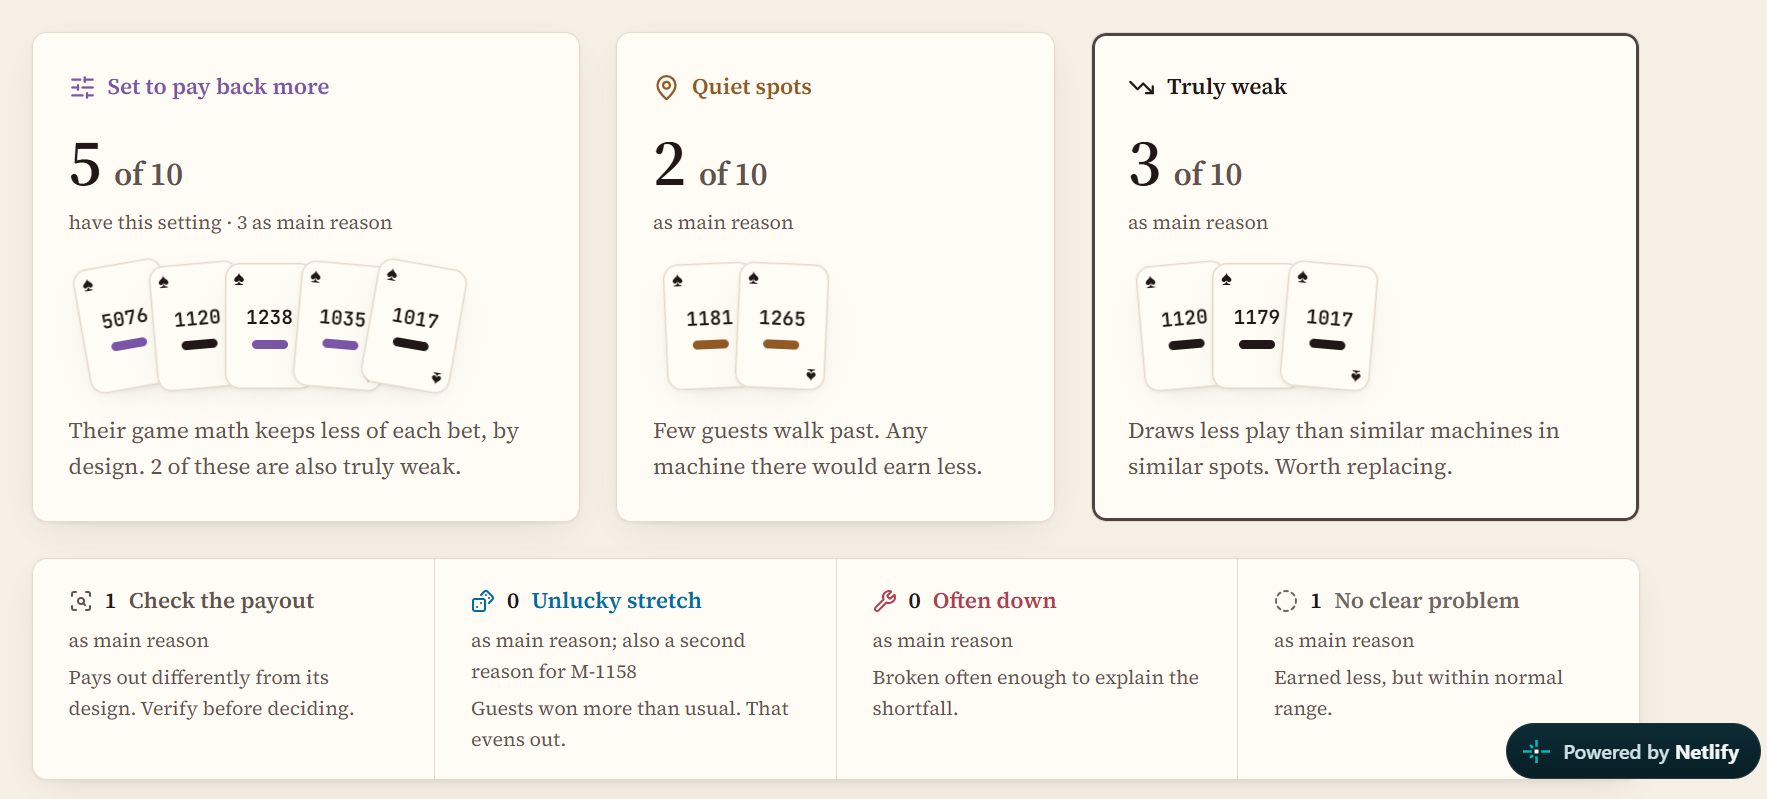
- Why they're low. Four "hands" explain the reasons (game setting, luck, location, downtime), and "Can we trust this?" shows how we validated it on data the model never saw.
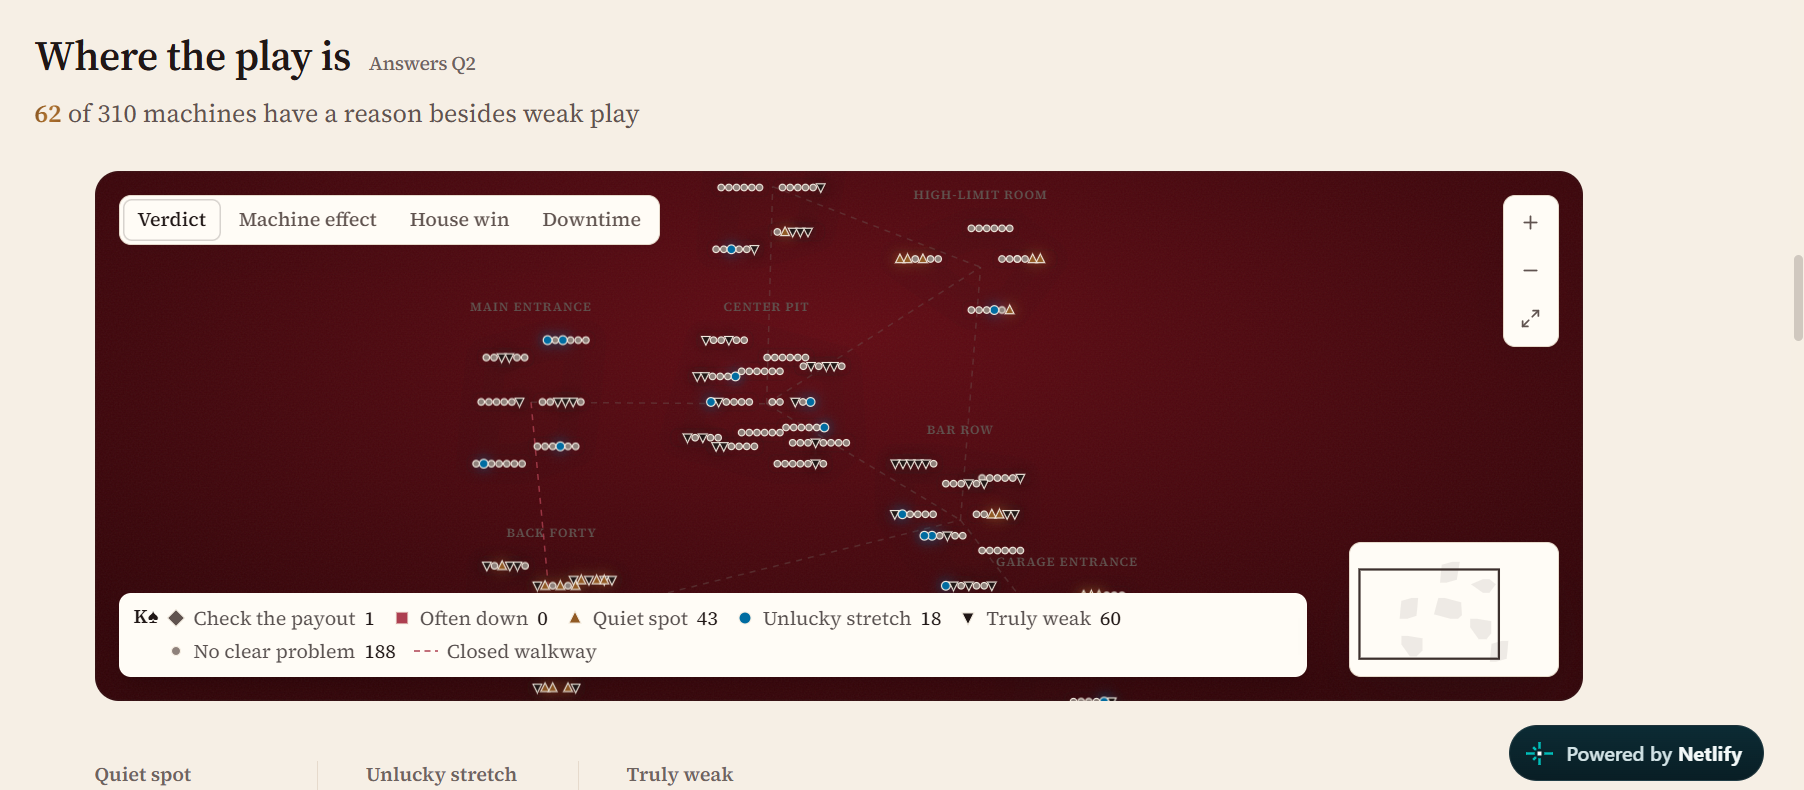
- The floor. A live map of all 300 positions with a January–June timeline. Click any bank to filter the entire site to it, or any machine to open its case file: a plain-English evidence trail ending in a single call ("unlucky stretch, not a weak machine").
- Guests & loyalty. Who plays, how concentrated results are, and what changed in the loyalty program, framed for responsible-play decisions, not for encouraging more play.
- The plan. The $100K budget as chip stacks on a betting table: what we fund, what we hold back, and how we'll know it worked.
Every claim links to its evidence, and an Evidence page holds the full method, the model validation and a 17-claim Claims & Evidence appendix. All data is synthetic, and the casino is fictional.
Key findings
- The manager's list tracks the spot, not the machine. Early-year house win follows a location's expected play (\( \rho = 0.61 \)) but barely tracks machine quality (\( \rho = 0.10 \)).
- Half the list is set to pay back more. 5 of the manager's 10 are configured to keep 5%, against a floor median of 10% (only 25 of 310 machines; \( p = 0.0004 \)). That alone halves their expected earnings.
- Our ranking predicts which machines stay weak. Ranked on January–April only, our list predicts May–June underperformance far better than the manager's (Spearman \( \rho = 0.58 \) [0.51, 0.64] vs. \( 0.05 \) [−0.05, 0.14]). None of the manager's 10 make our truly-weak list.
- Downtime cost an estimated $94K in expected earnings ($80K–$106K), and overnight faults wait 2.0 hours for a technician, against 0.9 hours on other shifts.
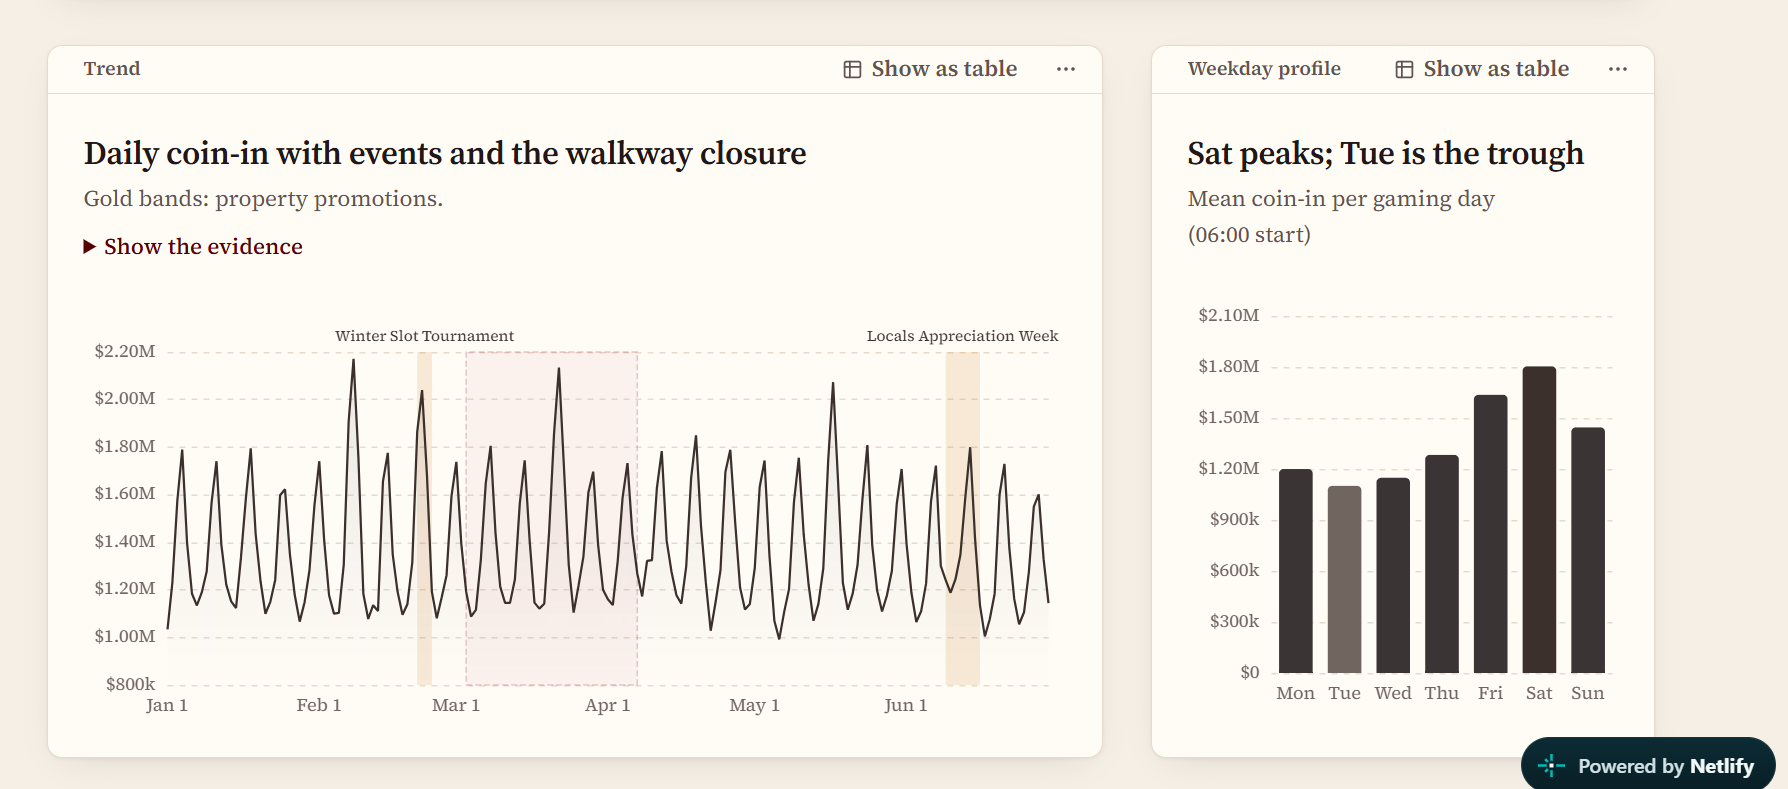
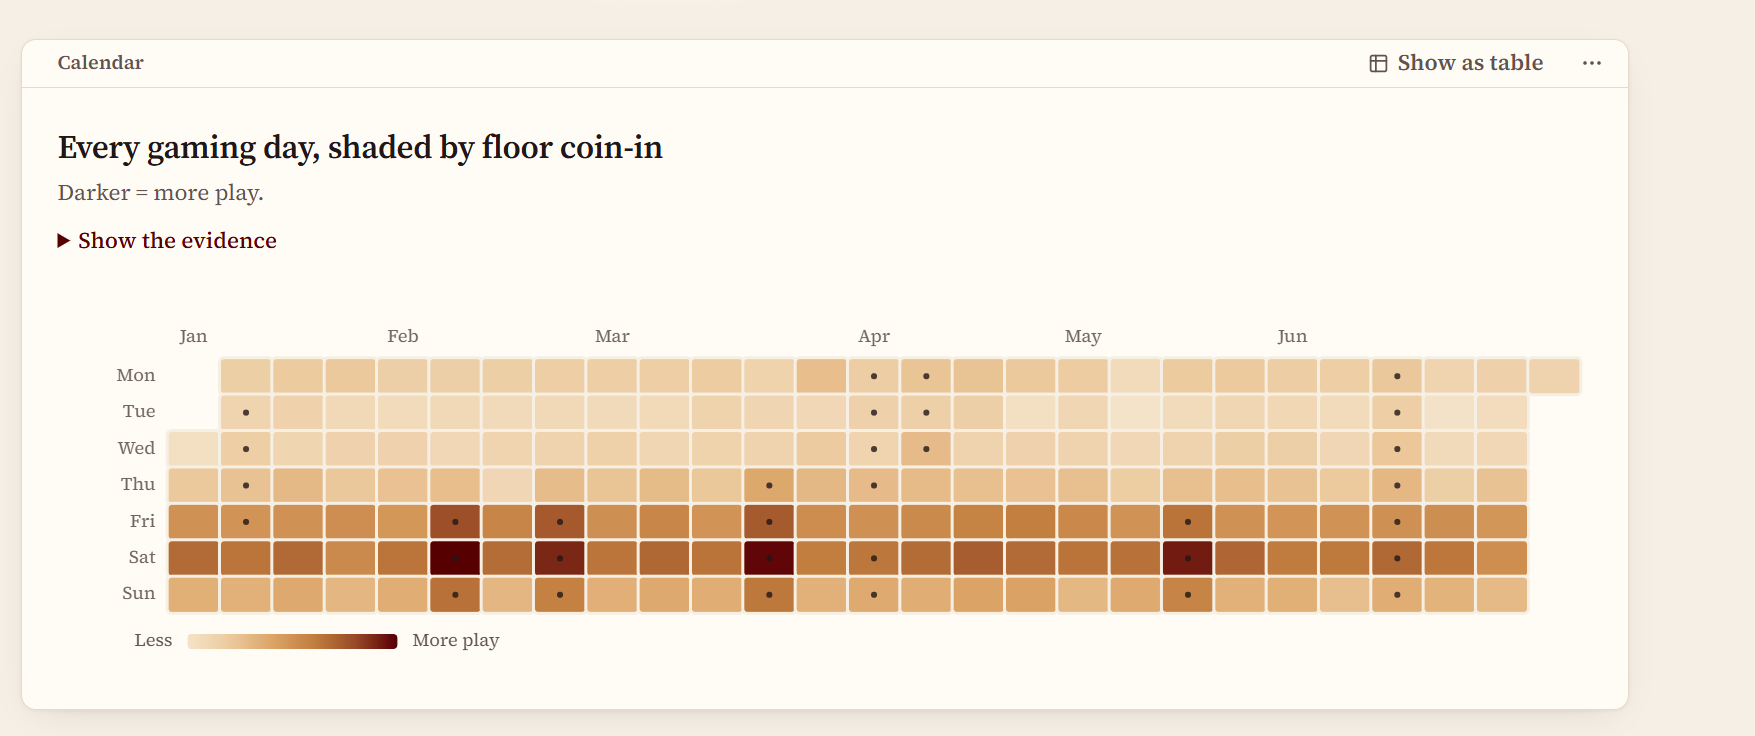
- Demand: Saturdays bring 1.64× Tuesday's play; the Super Bowl lifted play 23% (CI 14–33%); a closed walkway cut one zone's foot-traffic share from 3.9% to 2.8%.
- Guests: the top 10% of carded players account for 66% of expected earnings (Gini 0.75).
- Loyalty: in late April, the cost to redeem points fell from about 13 to 6 points per dollar, roughly doubling their value (permutation \( p < 0.001 \)). The records don't say why.
The $100K plan
Spend $19.5K, keep $80.5K.
- Verify payouts on the machines flagged for hold variance (leads to inspect, not findings).
- New signage for an under-trafficked zone.
- A controlled swap test: 3 pairs of machines ($10.8K), measured against matched unmoved machines.
Why test instead of replace? Replacing the 36 weak machines in quiet spots could be worth −$98K or +$85K, depending on whether play follows the spot or the machine. The swap test answers that for a tenth of the cost. The plan holds in 19 of 21 what-if scenarios. A "Considered, not funded" table explains why technicians, leases, promotions and the rest lost out.
How we built it
The analysis pipeline (Python: pandas, DuckDB, LightGBM)
Every rate is a ratio of sums, never an average of daily ratios. Availability uses each day's real scheduled length, including the 23-hour daylight-saving day. Expected earnings (theo) come from each game's published payback rate:
$$\text{theo} = \text{coin-in} \times (1 - \text{RTP}), \qquad \text{luck} = \text{house win} - \text{theo}$$
A location-and-game model (LightGBM, with no machine ID as a feature) predicts how much a machine should draw per available hour, given its spot, game, weekday and events. Each machine's effect is actual play over expected play, shrunk toward 1 for machines with little data (empirical Bayes):
$$\text{effect}m = \frac{\sum_t \text{coin-in}{m,t}}{\sum_t \widehat{\text{coin-in}}_{m,t}}, \qquad \tilde{e}_m = 1 + w_m(\text{effect}_m - 1), \quad w_m = \frac{\tau^2}{\tau^2 + \sigma_m^2}$$
Uncertainty comes from a 7-day block bootstrap (1,000 resamples). Payout leads must pass Benjamini–Hochberg FDR control at 10% and agree in both halves of the period. Each machine gets exactly one primary reason, in a fixed and documented order.
Validation without leakage
- Time-based holdout: built on January–April, tested on May–June. No random splits.
- Model vs. baseline: the location-and-game model beat a zone × weekday average by about 20% in prediction error.
- Rank persistence, which links the model to the decision: does a list built in January–April predict who's still weak in May–June? Ours does; the manager's doesn't. We also report honestly that the manager's list predicts raw house win better, because both are driven by the spot.
- Leakage tests assert the split boundary, prior-day-only features, and that no real-world tourism data feeds a forecast.
Competing explanations, tested
- Luck: expected-vs-actual bands per machine.
- Guest mix: carded share on the manager's 10 is no different from the floor (+0.2 pp [−0.5, +0.8]).
- Volatility: high-risk games aren't over-represented (Fisher \( p = 0.48 \)).
- Location: a natural experiment on the 4 machines that moved. Play followed the new spot (\( \beta = 0.90 \) [0.44, 1.07]), but one move carries the result, so we call it inconclusive and priced a proper test instead.
The dashboard (React, TypeScript, Vite, D3, ECharts)
Filters recompute in the browser from a slim machine × day table, so changing the period or drilling into a bank produces real numbers, not a static export. URL state makes every view shareable. A Playwright judge script runs the four things judges do (change the period, drill into a bank or guest group, find the validation, trace a recommendation) on every build: 9 of 9 checks pass, with Lighthouse desktop scores of 97 / 100 / 100.
How we worked: spec-first with AI coding agents
We wrote the spec before the code. A single master prompt held the locked plan, the data rules, the money definitions, the validation design, and 15 milestones (M0–M14), each with acceptance checks runnable from the command line. We ran the milestones with Cursor, reviewed each report against its checks, and kept 50 tests green so the Grok agent couldn't quietly break the math.
For design, independent reviewer agents saw only screenshots, never the code. A "cold-viewer" test asked them what the site was for and what it found; we kept revising until a stranger could answer correctly. Full details are in our AI-use disclosure.
Reproducible by design
python run.py all rebuilds everything: data checks, pipeline, tests, exports and the site. A reproducibility fingerprint (SHA-256 hashes of all 25 inputs and 29 outputs) lets anyone confirm they got exactly our numbers. The 17-claim appendix (claim → query → result → alternative explanation → limitation) is generated from the same code, so it can't drift from the dashboard.
Challenges we ran into
- Only 4 machines ever moved. That's the only clean test of "location vs. machine," and one move dominates it. Rather than oversell it, we reported it as inconclusive, disclosed that our 0.5 decision threshold was set after seeing the data, and turned the uncertainty into a priced experiment.
- Our first power calculation was too optimistic. Our first estimate said 3 swaps would pin down the location effect to ±0.12. A simulation using real machine-to-machine noise showed it was wider, so we recomputed the test's value before keeping it in the plan.
- Searching for a change point inflates p-values. We replaced the naive test with a permutation test that re-runs the full search on every shuffle (5,000 shuffles).
- Counting reasons honestly. A machine can be both set to pay back more and truly weak. We defined one primary reason per machine in a fixed order, and added a test that fails if any headline, chip or count disagrees.
- Clarity. Our first dashboard showed every number we computed, and it looked it. We rebuilt it as a five-chapter story with word budgets, plain-language labels ("expected earnings," not "theo") and all the depth moved to an Evidence page.
Accomplishments that we're proud of
- Zero overlap: none of the manager's 10 appear on our truly-weak list, and our list is the one that predicts the future.
- A recommendation that's honest about what we don't know: we hold $80.5K back and spend $10.8K to learn whether the bigger spend would pay.
- Every number is traceable and reproducible with one command and a fingerprint to match.
- A dashboard a manager can follow: from "should we replace these 10?" to a priced plan in five clicks.
What we learned
- The lowest earners aren't always the worst machines. Exposure, payback settings and luck explain most of the list.
- Testing the competing explanation is what changes the decision, not a fancier model.
- When the evidence is thin, the best recommendation is often a cheap experiment.
- Clarity beats completeness: putting fewer numbers on screen made the analysis more convincing, not less.
What's next
- Run the swap test and update the location estimate with real before-and-after data.
- Verify payouts on the flagged machines and close out each lead.
- Find out why the loyalty redemption price changed, and whether it brought in extra visits.
- Re-run on the final data release; one command regenerates every number, chart and claim.
Built With
- d3.js
- duckdb
- echarts
- framer-motion
- lightgbm
- netlify
- numpy
- pandas
- playwright
- python
- react
- scikit-learn
- scipy
- tailwindcss
- typescript
- vite


