This project story is our Dashboard Royale write-up (under 400 words). The Claims & Evidence appendix and AI disclosure are attached separately.
Luck, location, or a leak? The Gilded Ace's manager plans to replace the ten lowest earners. Our interactive console (floor map, luck simulator, live forecast lab, budget planner) shows that ranking misleads: only one of the ten looks like a machine problem.
What we found
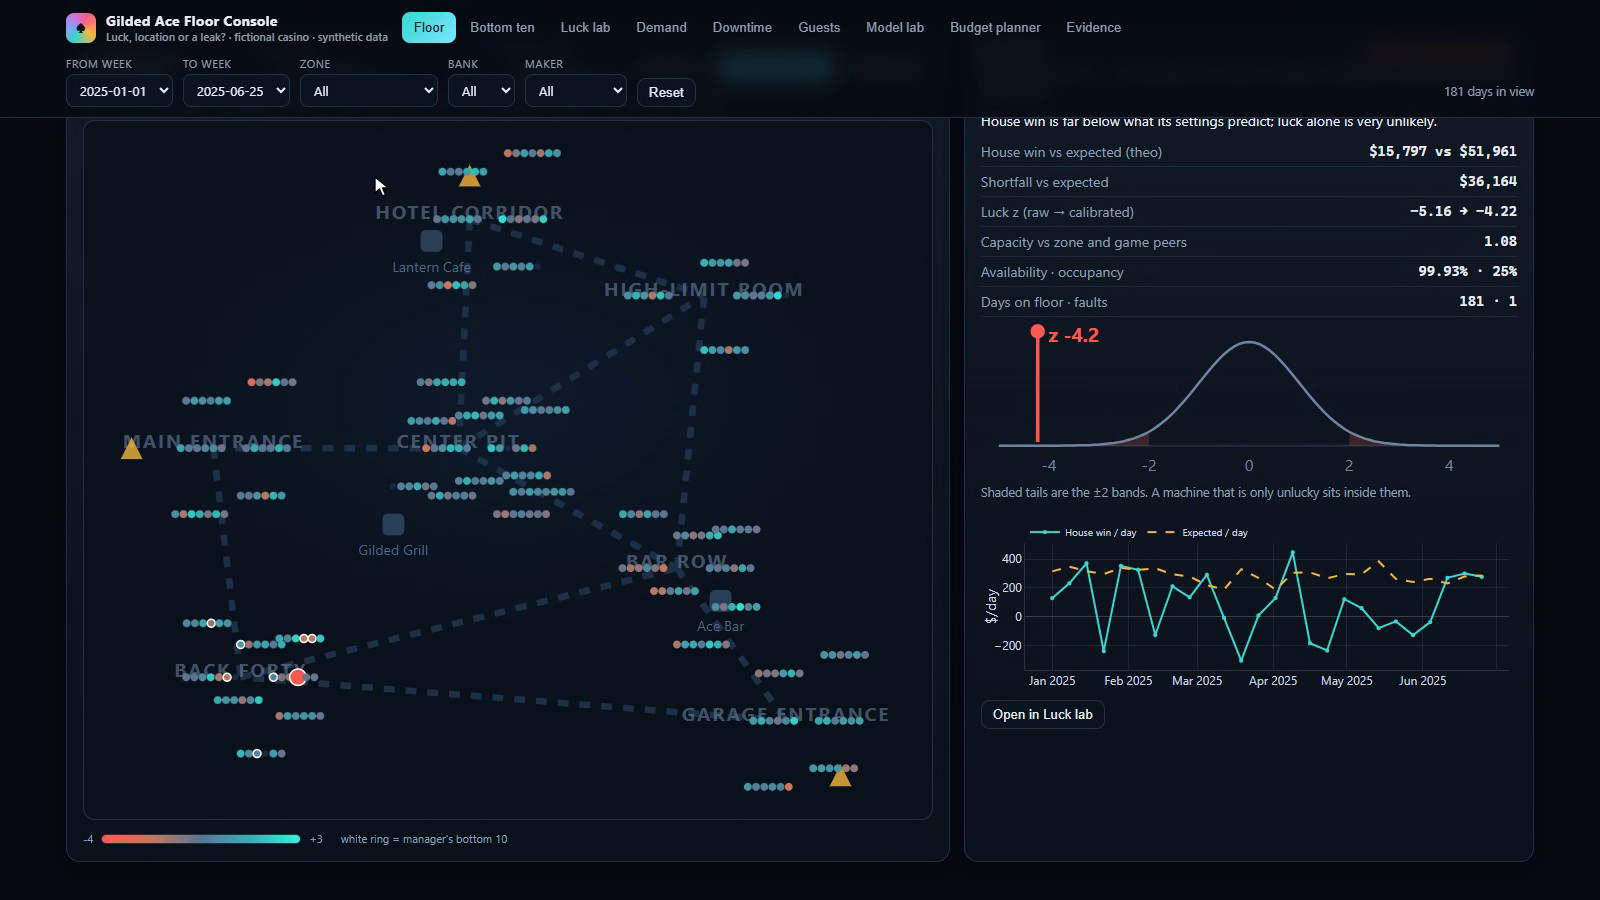
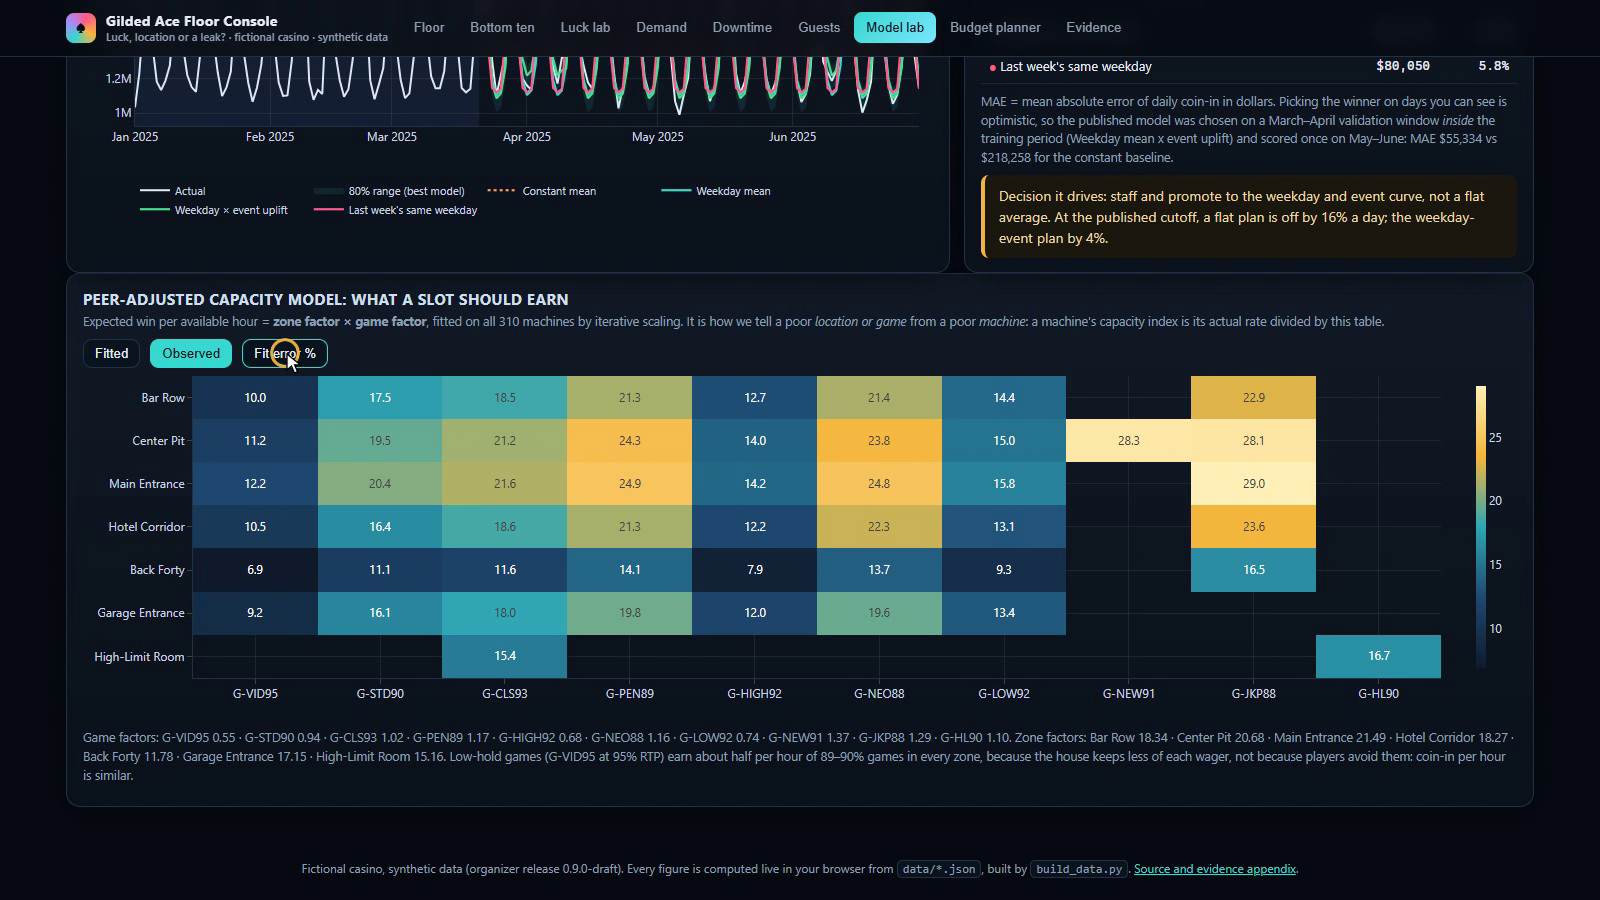
- Location and game, not faults. Nine of the ten sit in quiet Back Forty (about 540 entries a day versus 4,100 in Center Pit) or joined the floor late; several run low-hold 95% RTP games. Adjusted for zone and game, all ten earn 92% to 117% of their peers.
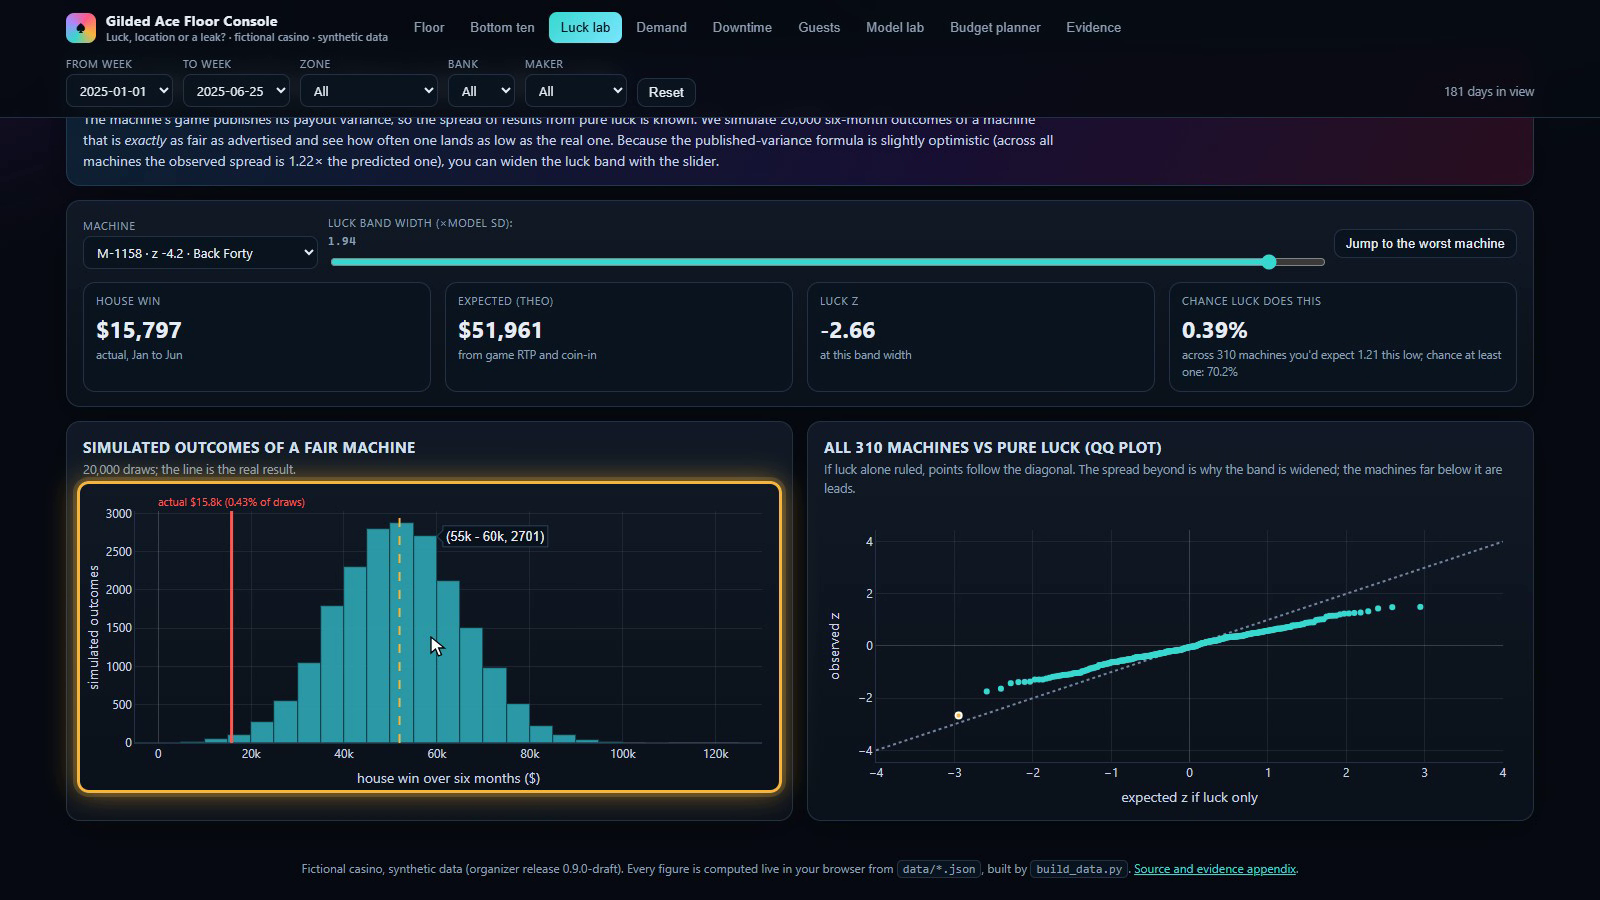
- One real lead. M-1158 earned $15.8k against $52.0k expected, about four standard deviations below its published payout math, with normal traffic and uptime. Inspect it ($1,200). A lead, not an accusation.
- Demand was flat at $1.32M to $1.41M of coin-in a day; swings follow events and weekdays.
- Downtime is small: 0.38% of machine hours, about $16k of expected win a month.
- Guests. 71% of 113,890 tracked players ended behind; the top 10% generate 59% of player losses, and results match expected loss within about 1%.
- Comps. Cost rose from 0.78% to 0.84% of expected win; cost per redeemed dollar was flat.
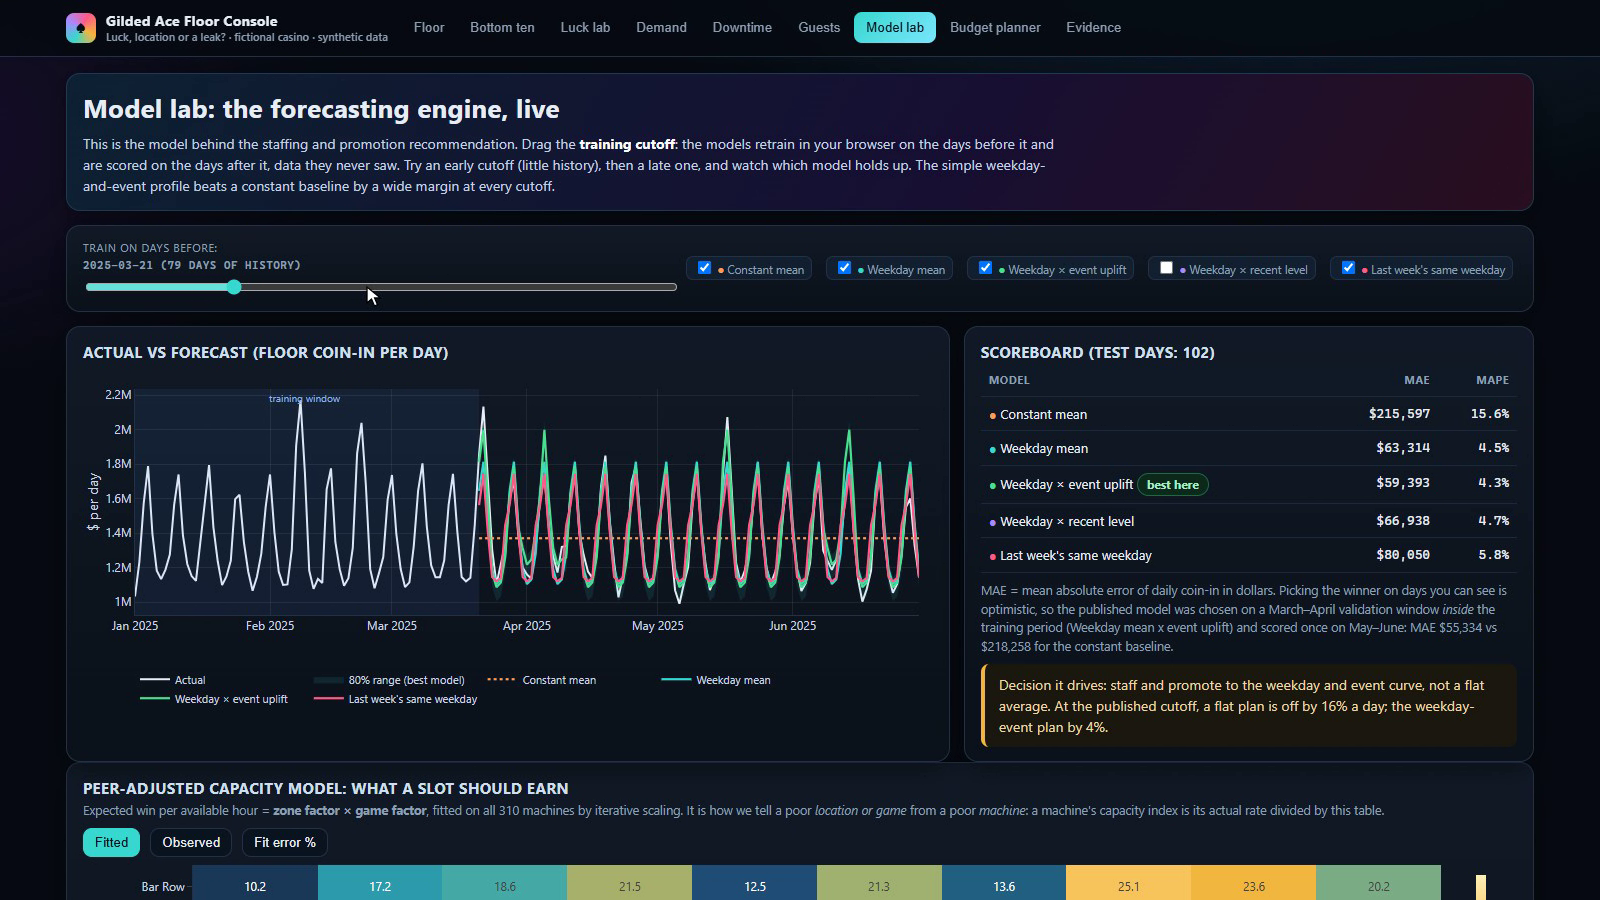
Model. A weekday-and-event profile forecasts daily floor coin-in. Chosen on March and April inside the training period, refit on January to April and scored once on May and June: mean absolute error $55k against $218k for a constant baseline. In the console you can drag the training cutoff and watch it retrain.
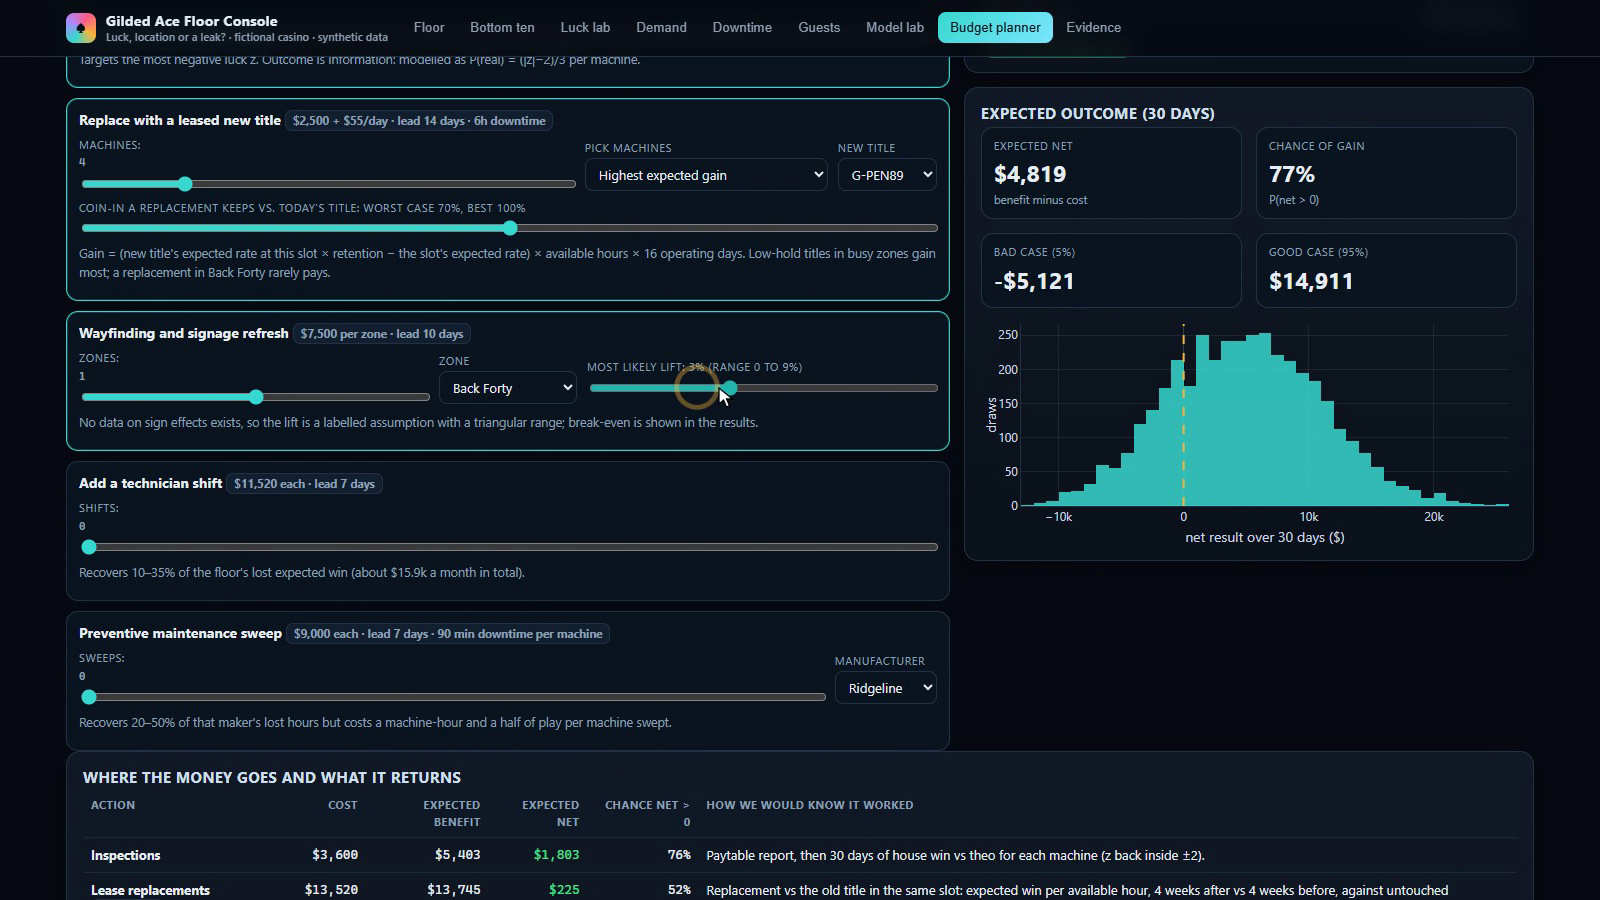
Plan ($100,000). Rank replacements by expected yield, not realized results: 95% RTP titles earn about half as much per hour in every zone. Inspect three machines ($3,600), pilot four leased replacements in busy zones ($13,520), refresh Back Forty signage ($7,500): $24,620 spent, $75,380 kept. A 4,000-draw Monte Carlo gives our plan an expected 30-day net of about +$4.8k (77% chance of gain) and the manager's lease-the-bottom-ten plan about −$20.7k.
Why trust it. Every claim has a source, a tested alternative and a limitation in the appendix; filters recompute everything; the luck test is calibrated to the data's own spread. Claude assisted with code and drafting (disclosed).
Links. Dashboard: https://awojinrin.github.io/gilded-ace-floor-analytics/ · Code and Claims & Evidence appendix: https://github.com/awojinrin/gilded-ace-floor-analytics
Built With
- claude
- duckdb
- javascript
- plotly.js
- python
