
GhostLink
Inspiration
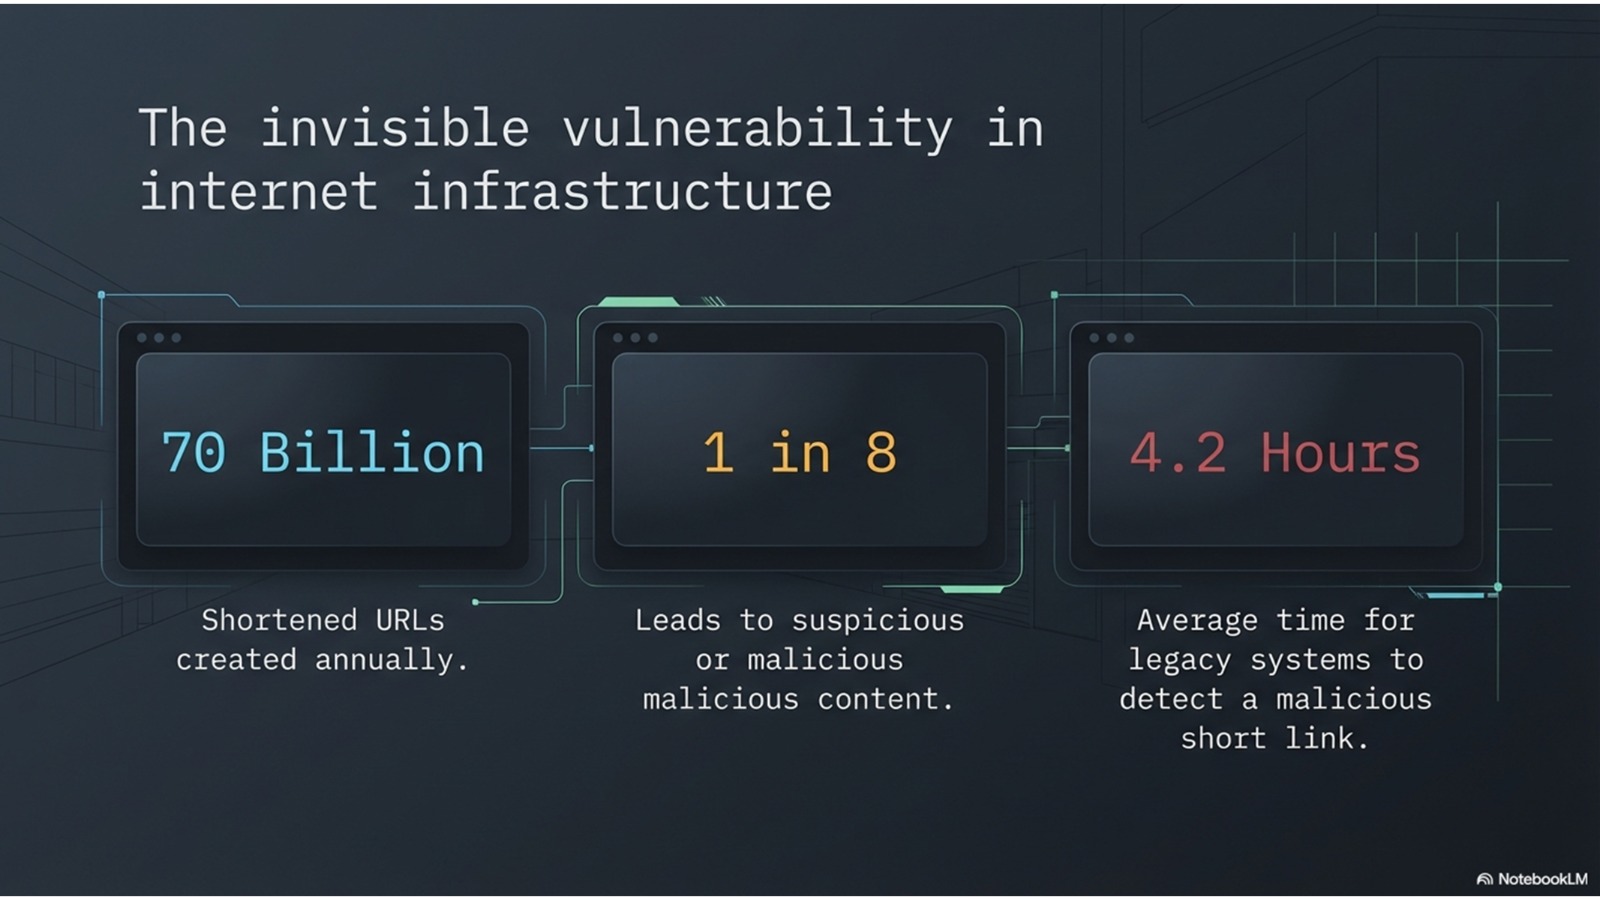
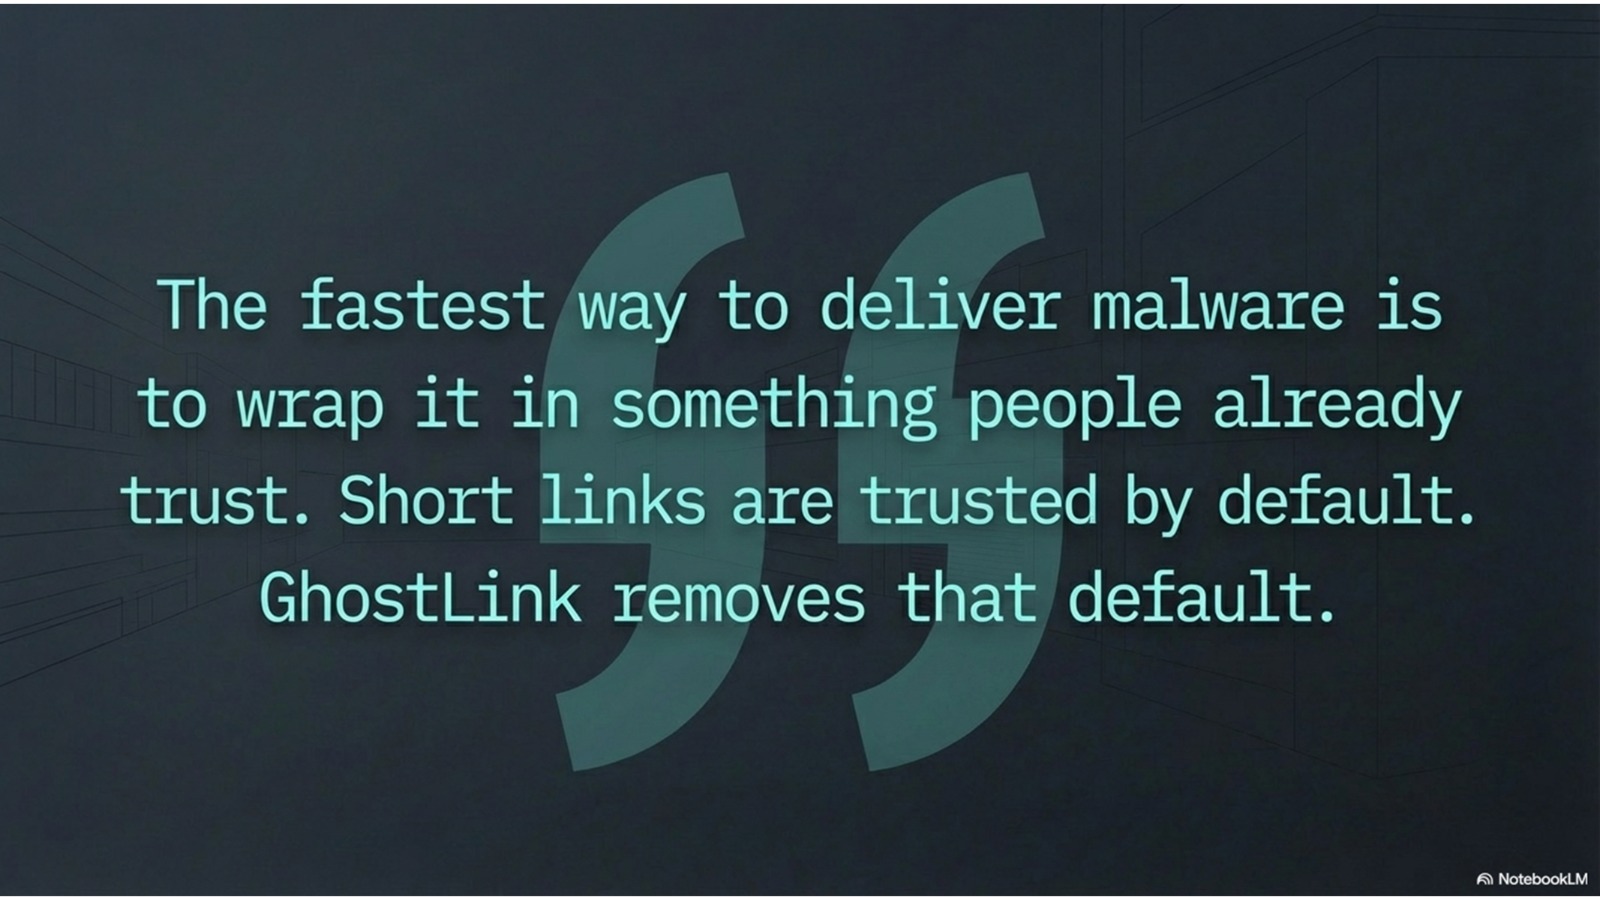
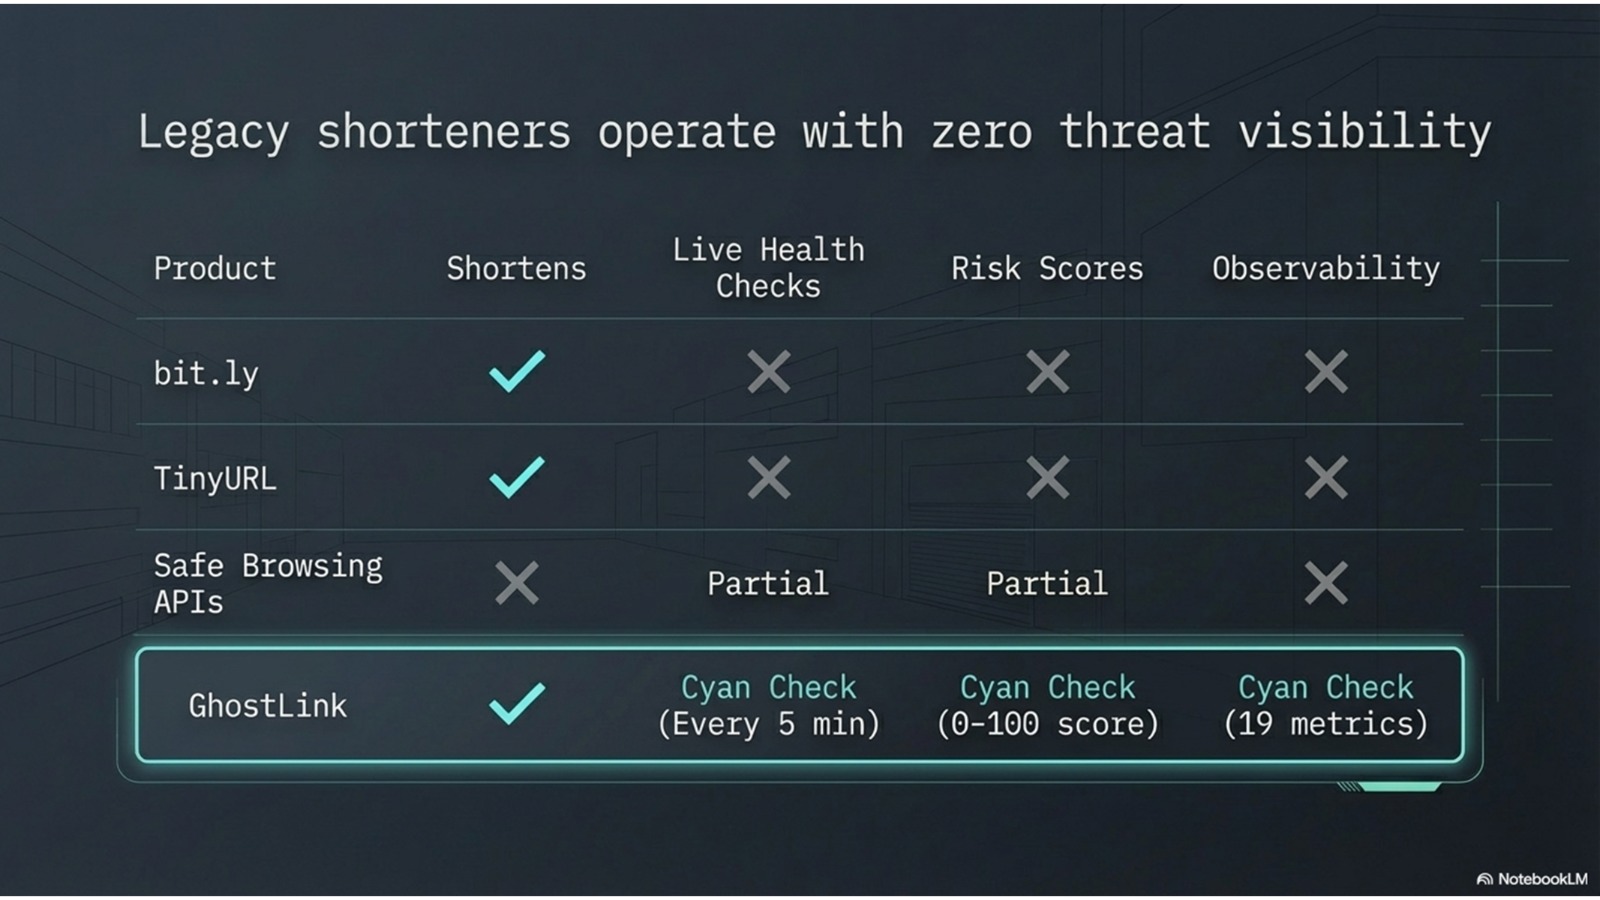
Most link shorteners are dumb pipes. They take a URL, return a short code, and forget about it. We wanted to build one that stays curious — one that checks if destinations are still alive, notices when bots are probing dead links, and flags suspicious traffic. GhostLink started as a URL shortener and turned into a production reliability exercise: how do you keep a service observable, honest, and alive under real load?
What It Does
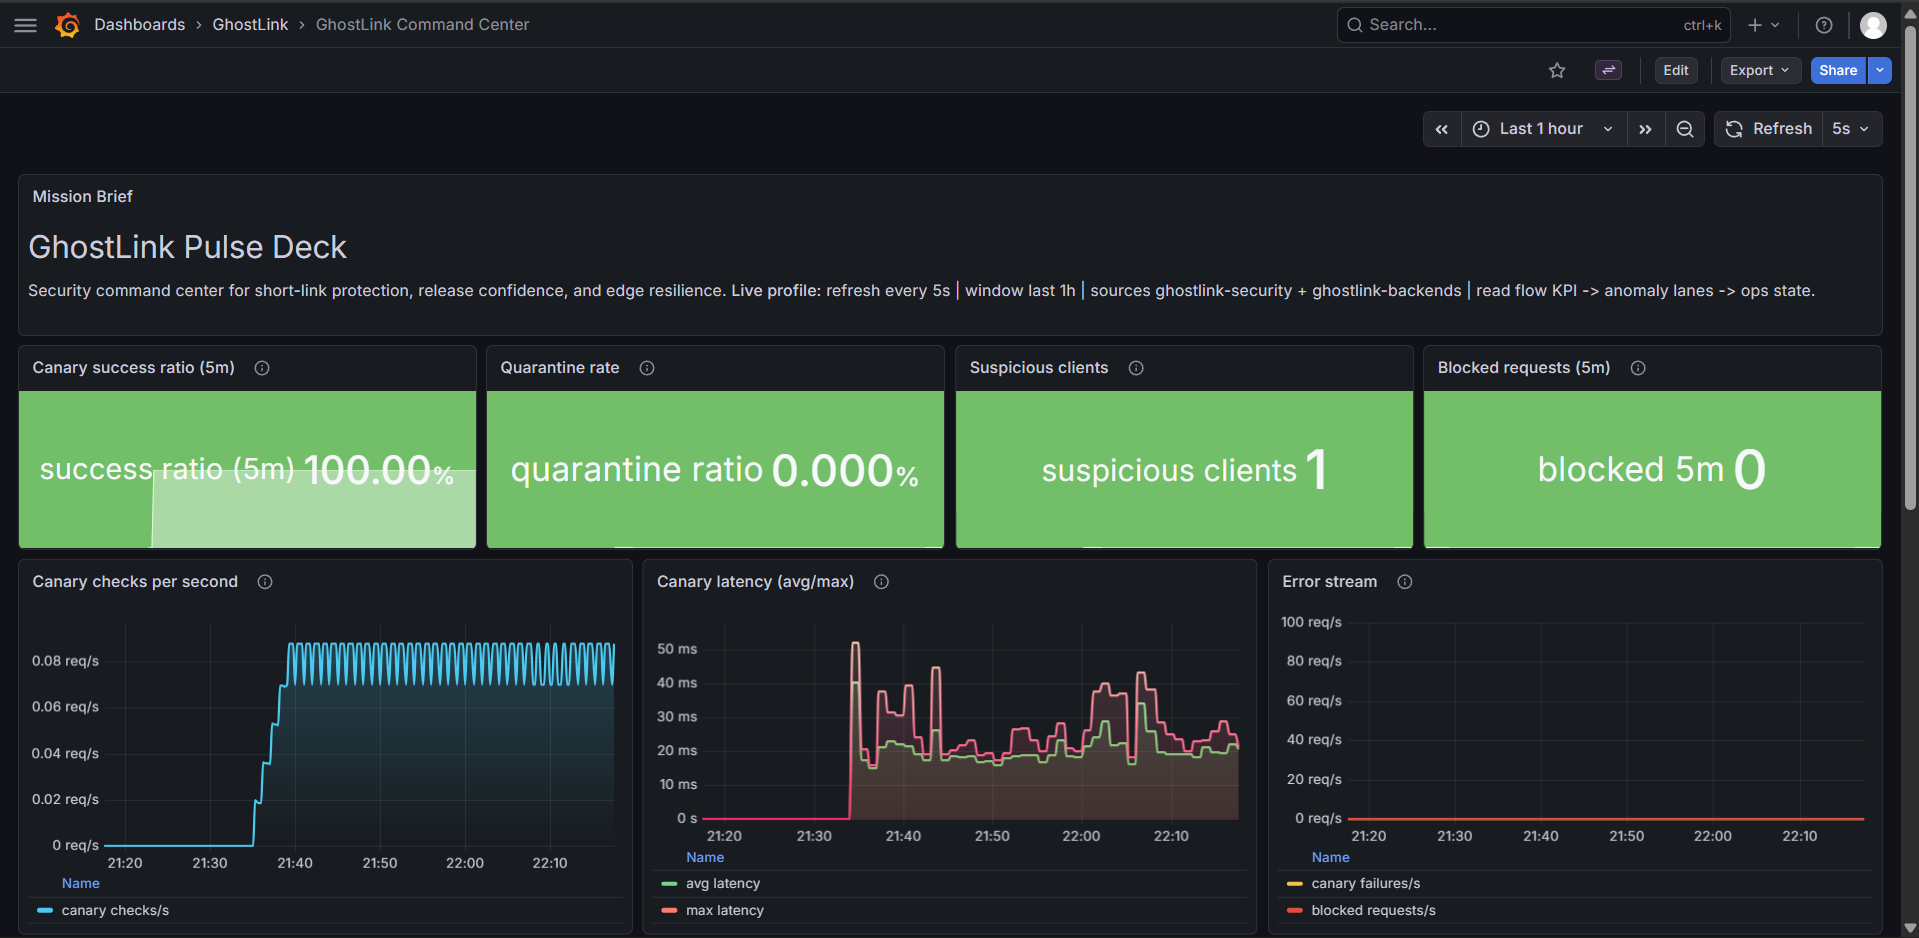
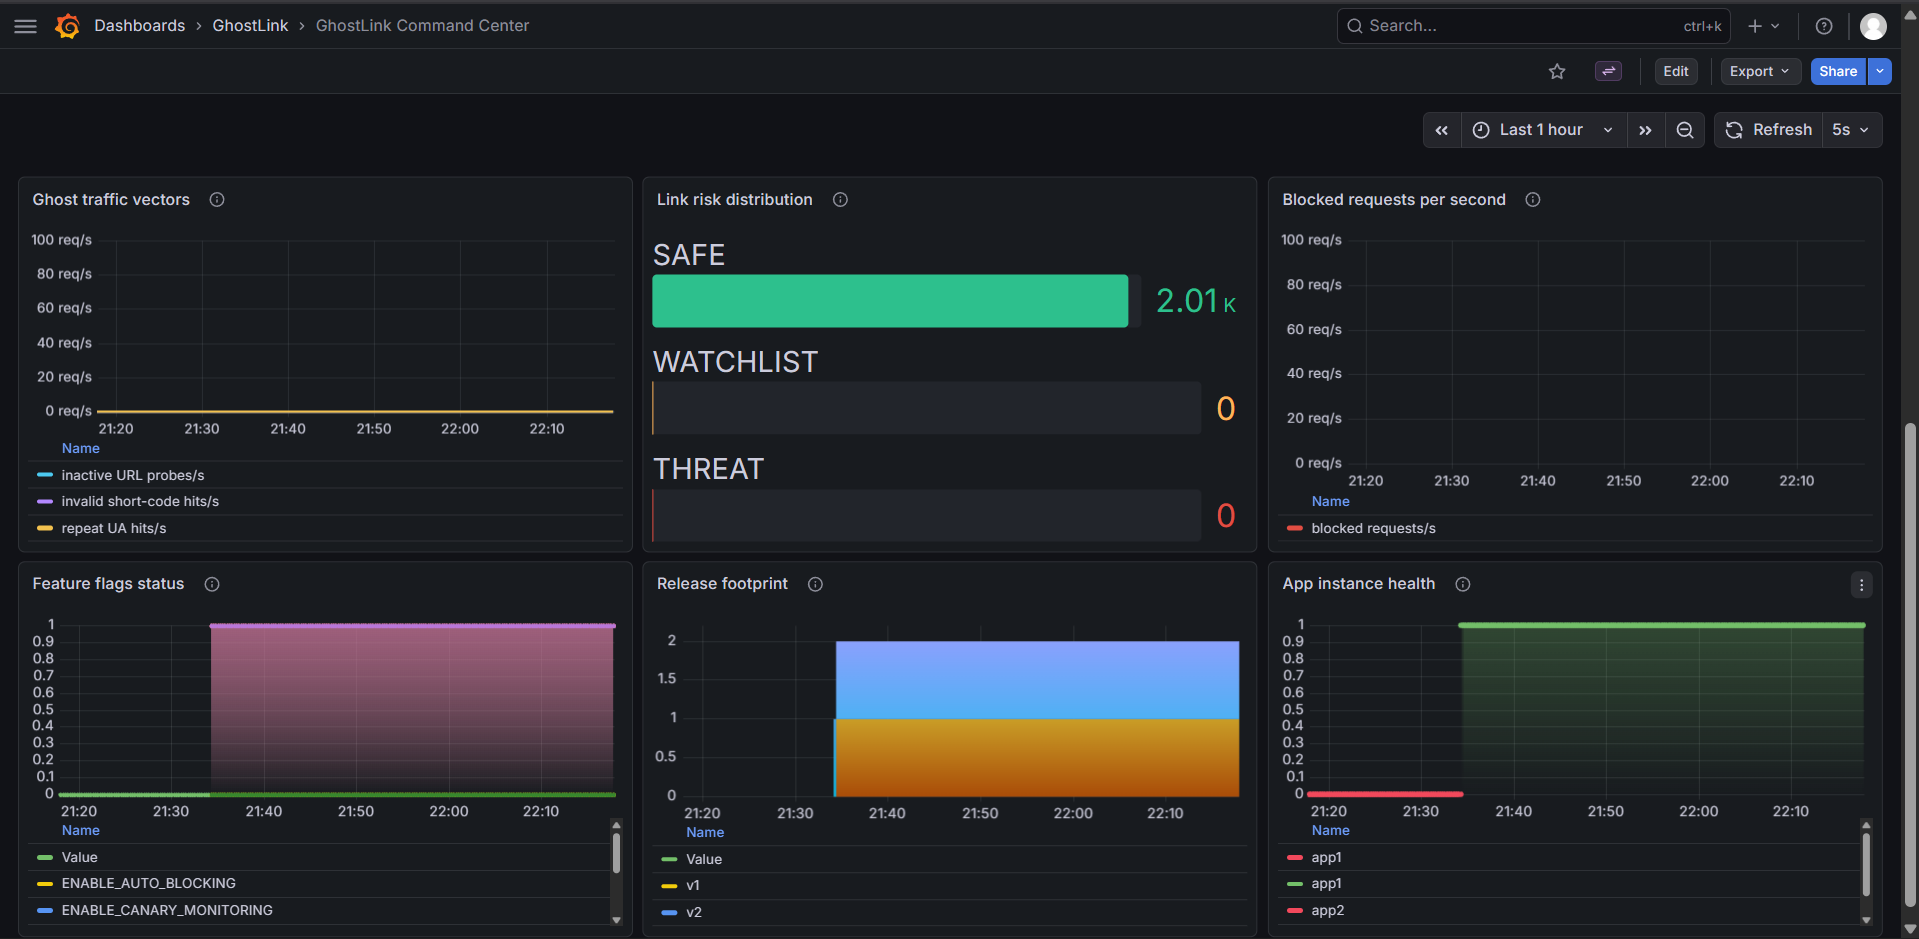
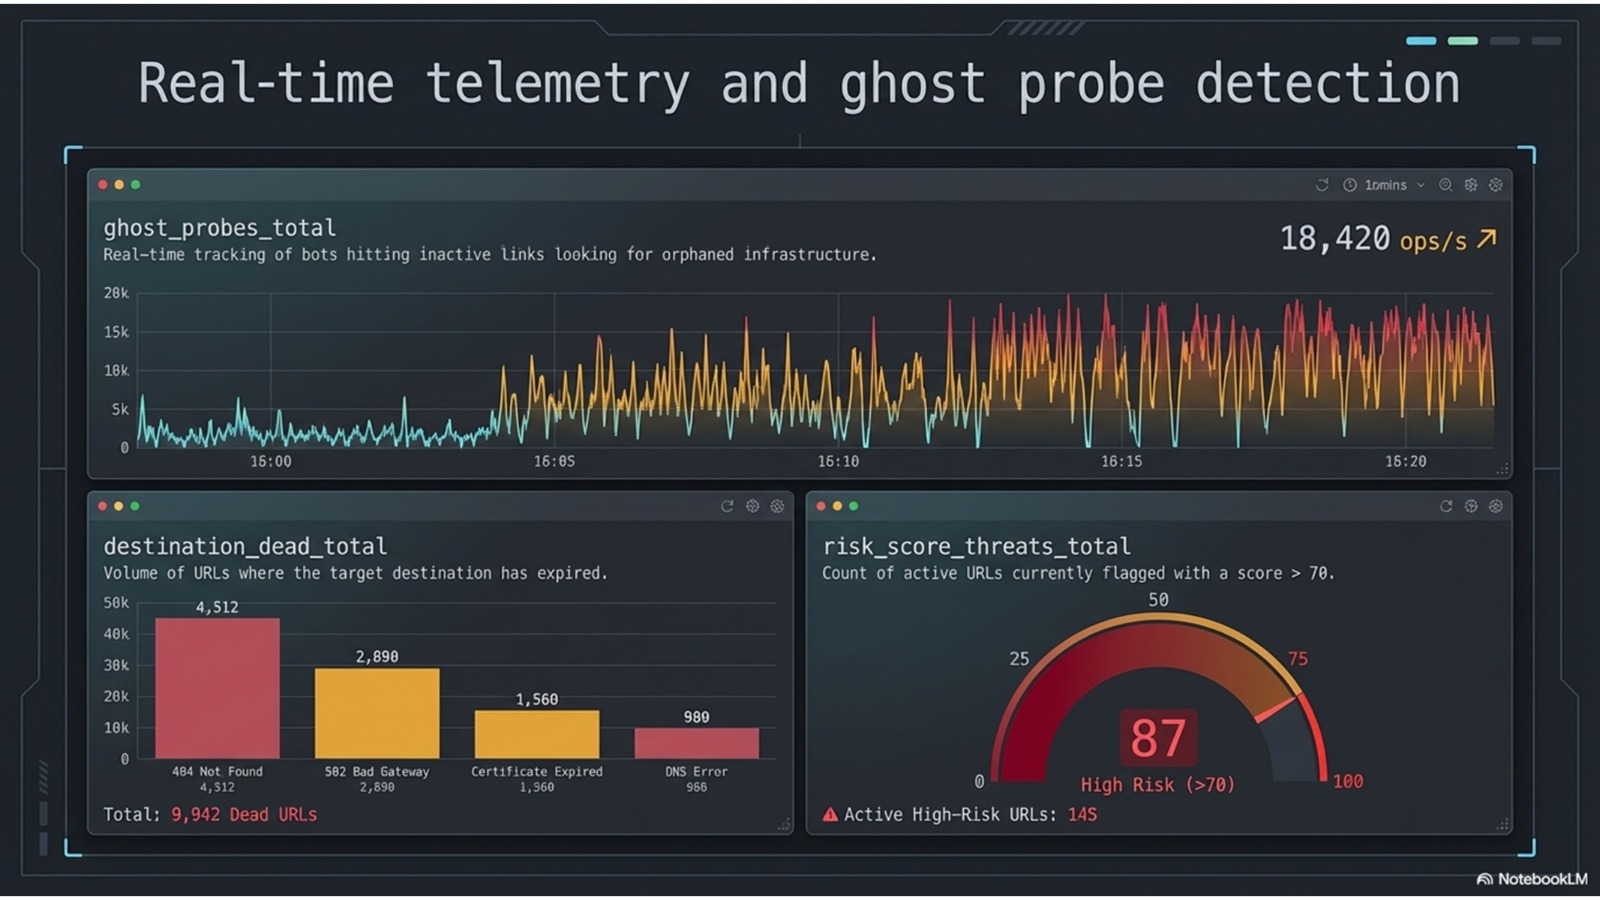
GhostLink shortens URLs, redirects users, and tracks click events. Beyond that, it runs a canary checker that probes destinations every few minutes to catch dead links, a risk scorer that flags high-risk domains before the redirect happens, a security exporter that surfaces threat signals to Prometheus, and a ghost probe detector that spots bot traffic from zero-click patterns. Every redirect goes through a live database check, a Redis cache lookup, and a risk gate.
How We Built It
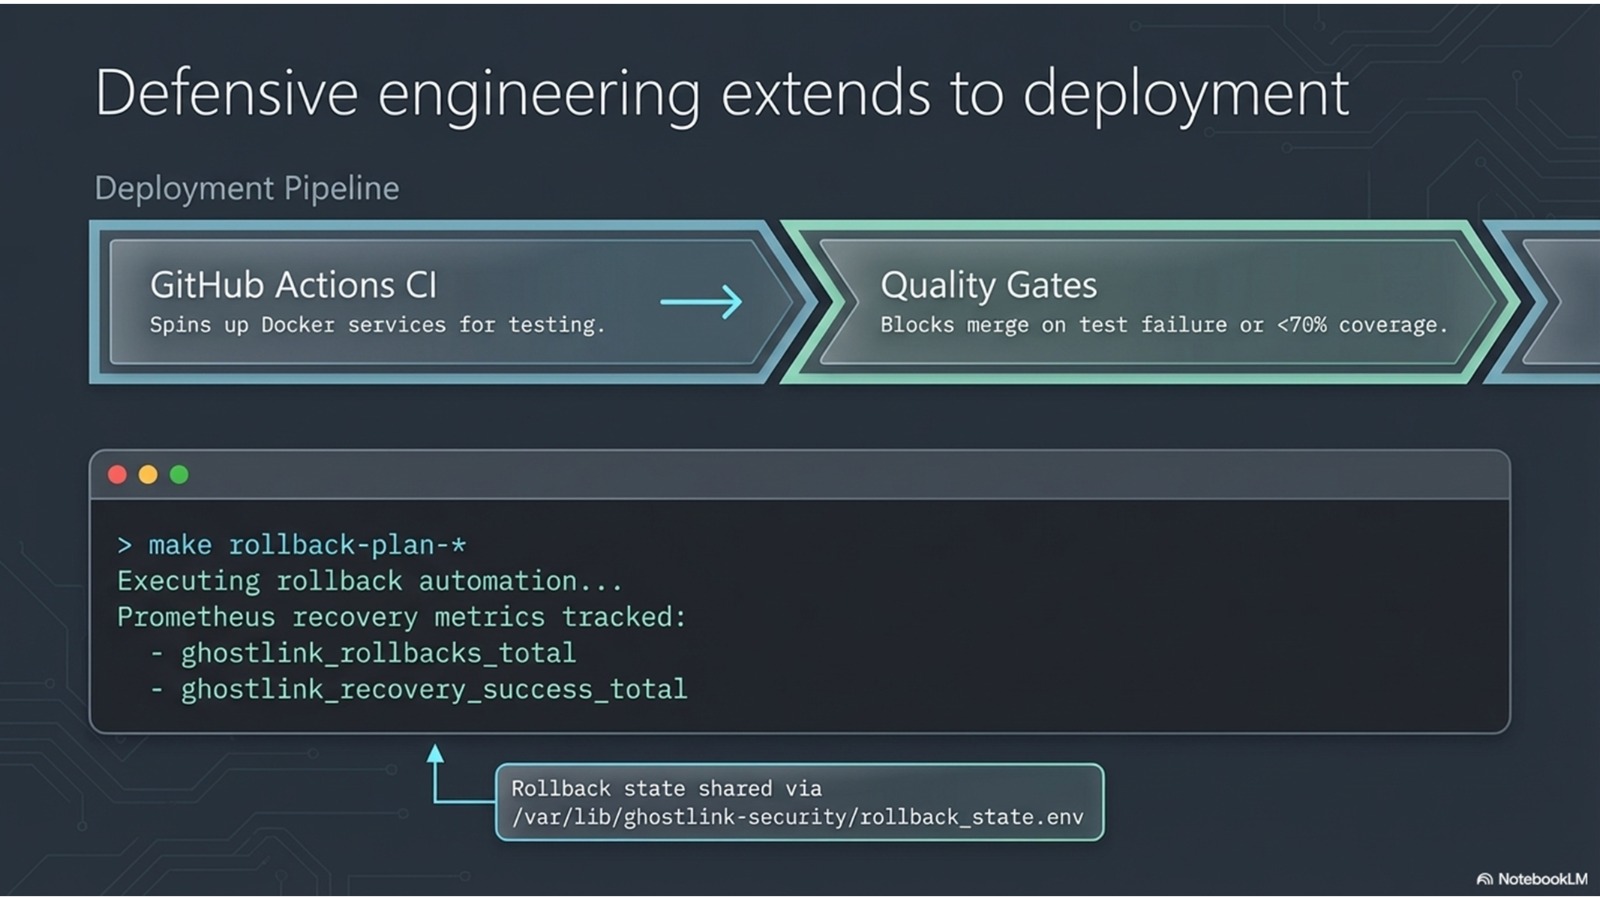
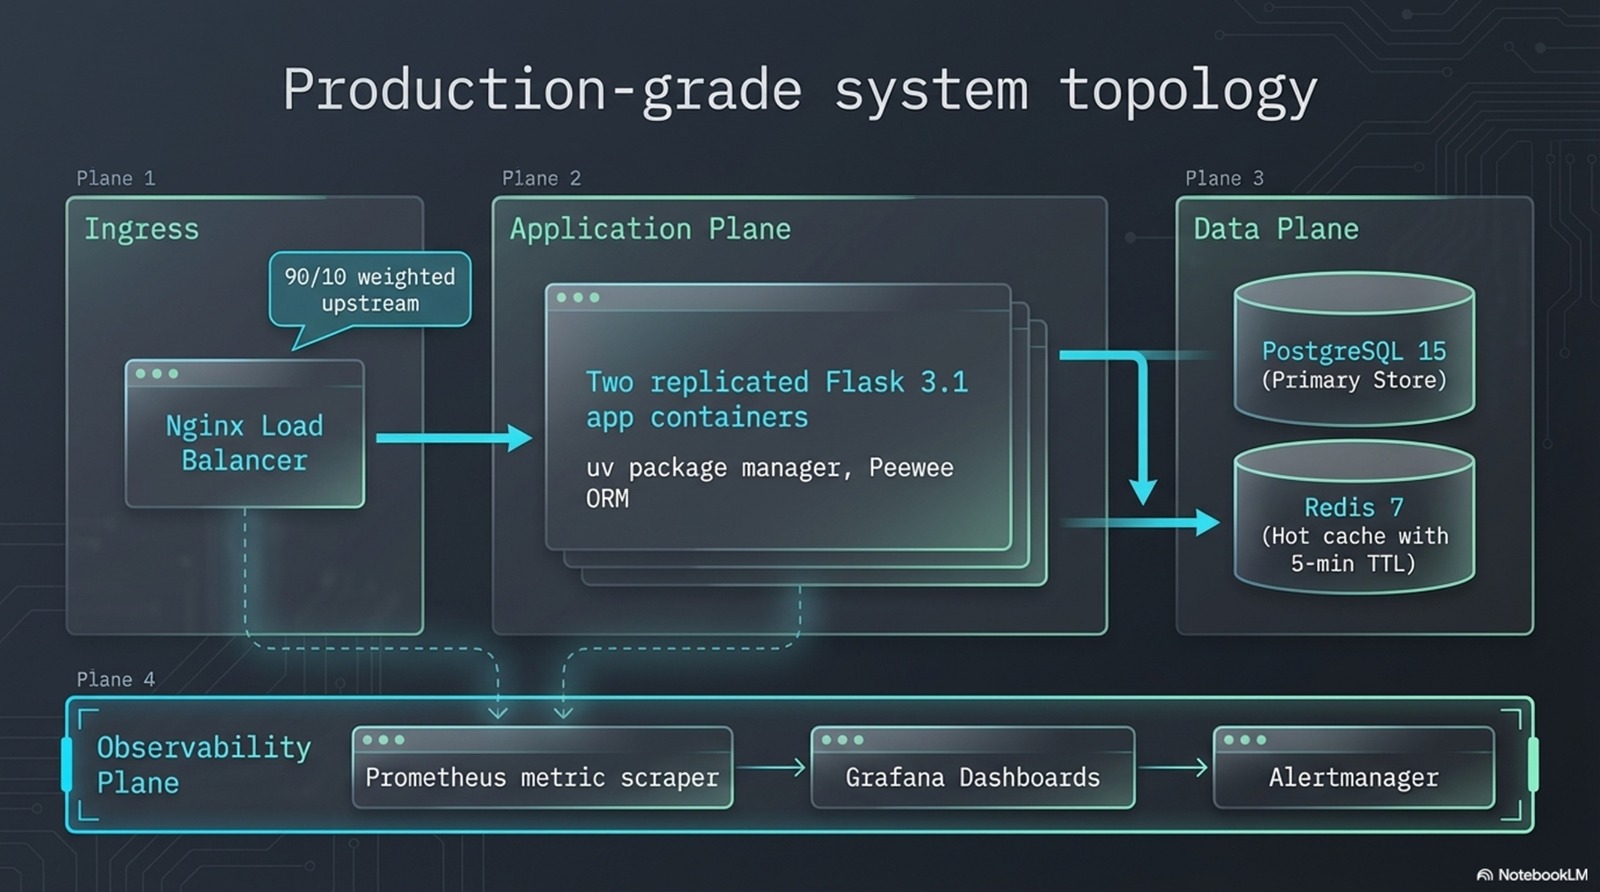
Core service: Python with Flask and Peewee ORM, backed by Postgres 15 and Redis 7. Nginx load balances across two app replicas. Prometheus scrapes metrics from both replicas and the security exporter. Grafana shows the four golden signals: latency, traffic, errors, and saturation. Alertmanager fires to Discord when the service goes down or error rates spike. CI runs on GitHub Actions with Postgres and Redis containers, enforcing 70% coverage on every push. k6 load tests confirm the service holds at 50, 200, and 500 concurrent users.
Challenges We Ran Into
Getting Nginx to health-check both app replicas and route around a failed one was harder than expected. Open-source Nginx has limited passive health check behaviour compared to NGINX Plus. We kept both replicas in the upstream block and let Docker's restart policy handle recovery. Writing integration tests against a real Postgres database in CI also required careful test ordering to prevent pollution between runs.
Accomplishments We Are Proud Of
- 79% test coverage enforced in CI
- A complete observability stack — metrics, structured JSON logs, alert rules, and a Grafana dashboard — running in Docker Compose with no external cloud dependencies
- A canary checker and ghost probe detector that go beyond the base template
- A RUNBOOK.md written for an on-call engineer at 3 AM with no prior context
What We Learned
Production engineering is not about writing features. It is about designing for failure. Every component we added — Redis, the canary runner, alerting — introduced a new failure mode to handle. We also learned that observability has to be built in from the start. Retrofitting Prometheus metrics onto an existing service is painful and slow.
What's Next for GhostLink
- Rate limiting per user token
- Distributed tracing with OpenTelemetry
- A Grafana SLO dashboard tracking a 99.9% redirect success rate
- Replace the canary runner with a proper synthetic monitoring loop
- Automated quarantine for links that fail health checks three times in a row


Log in or sign up for Devpost to join the conversation.