Inspiration
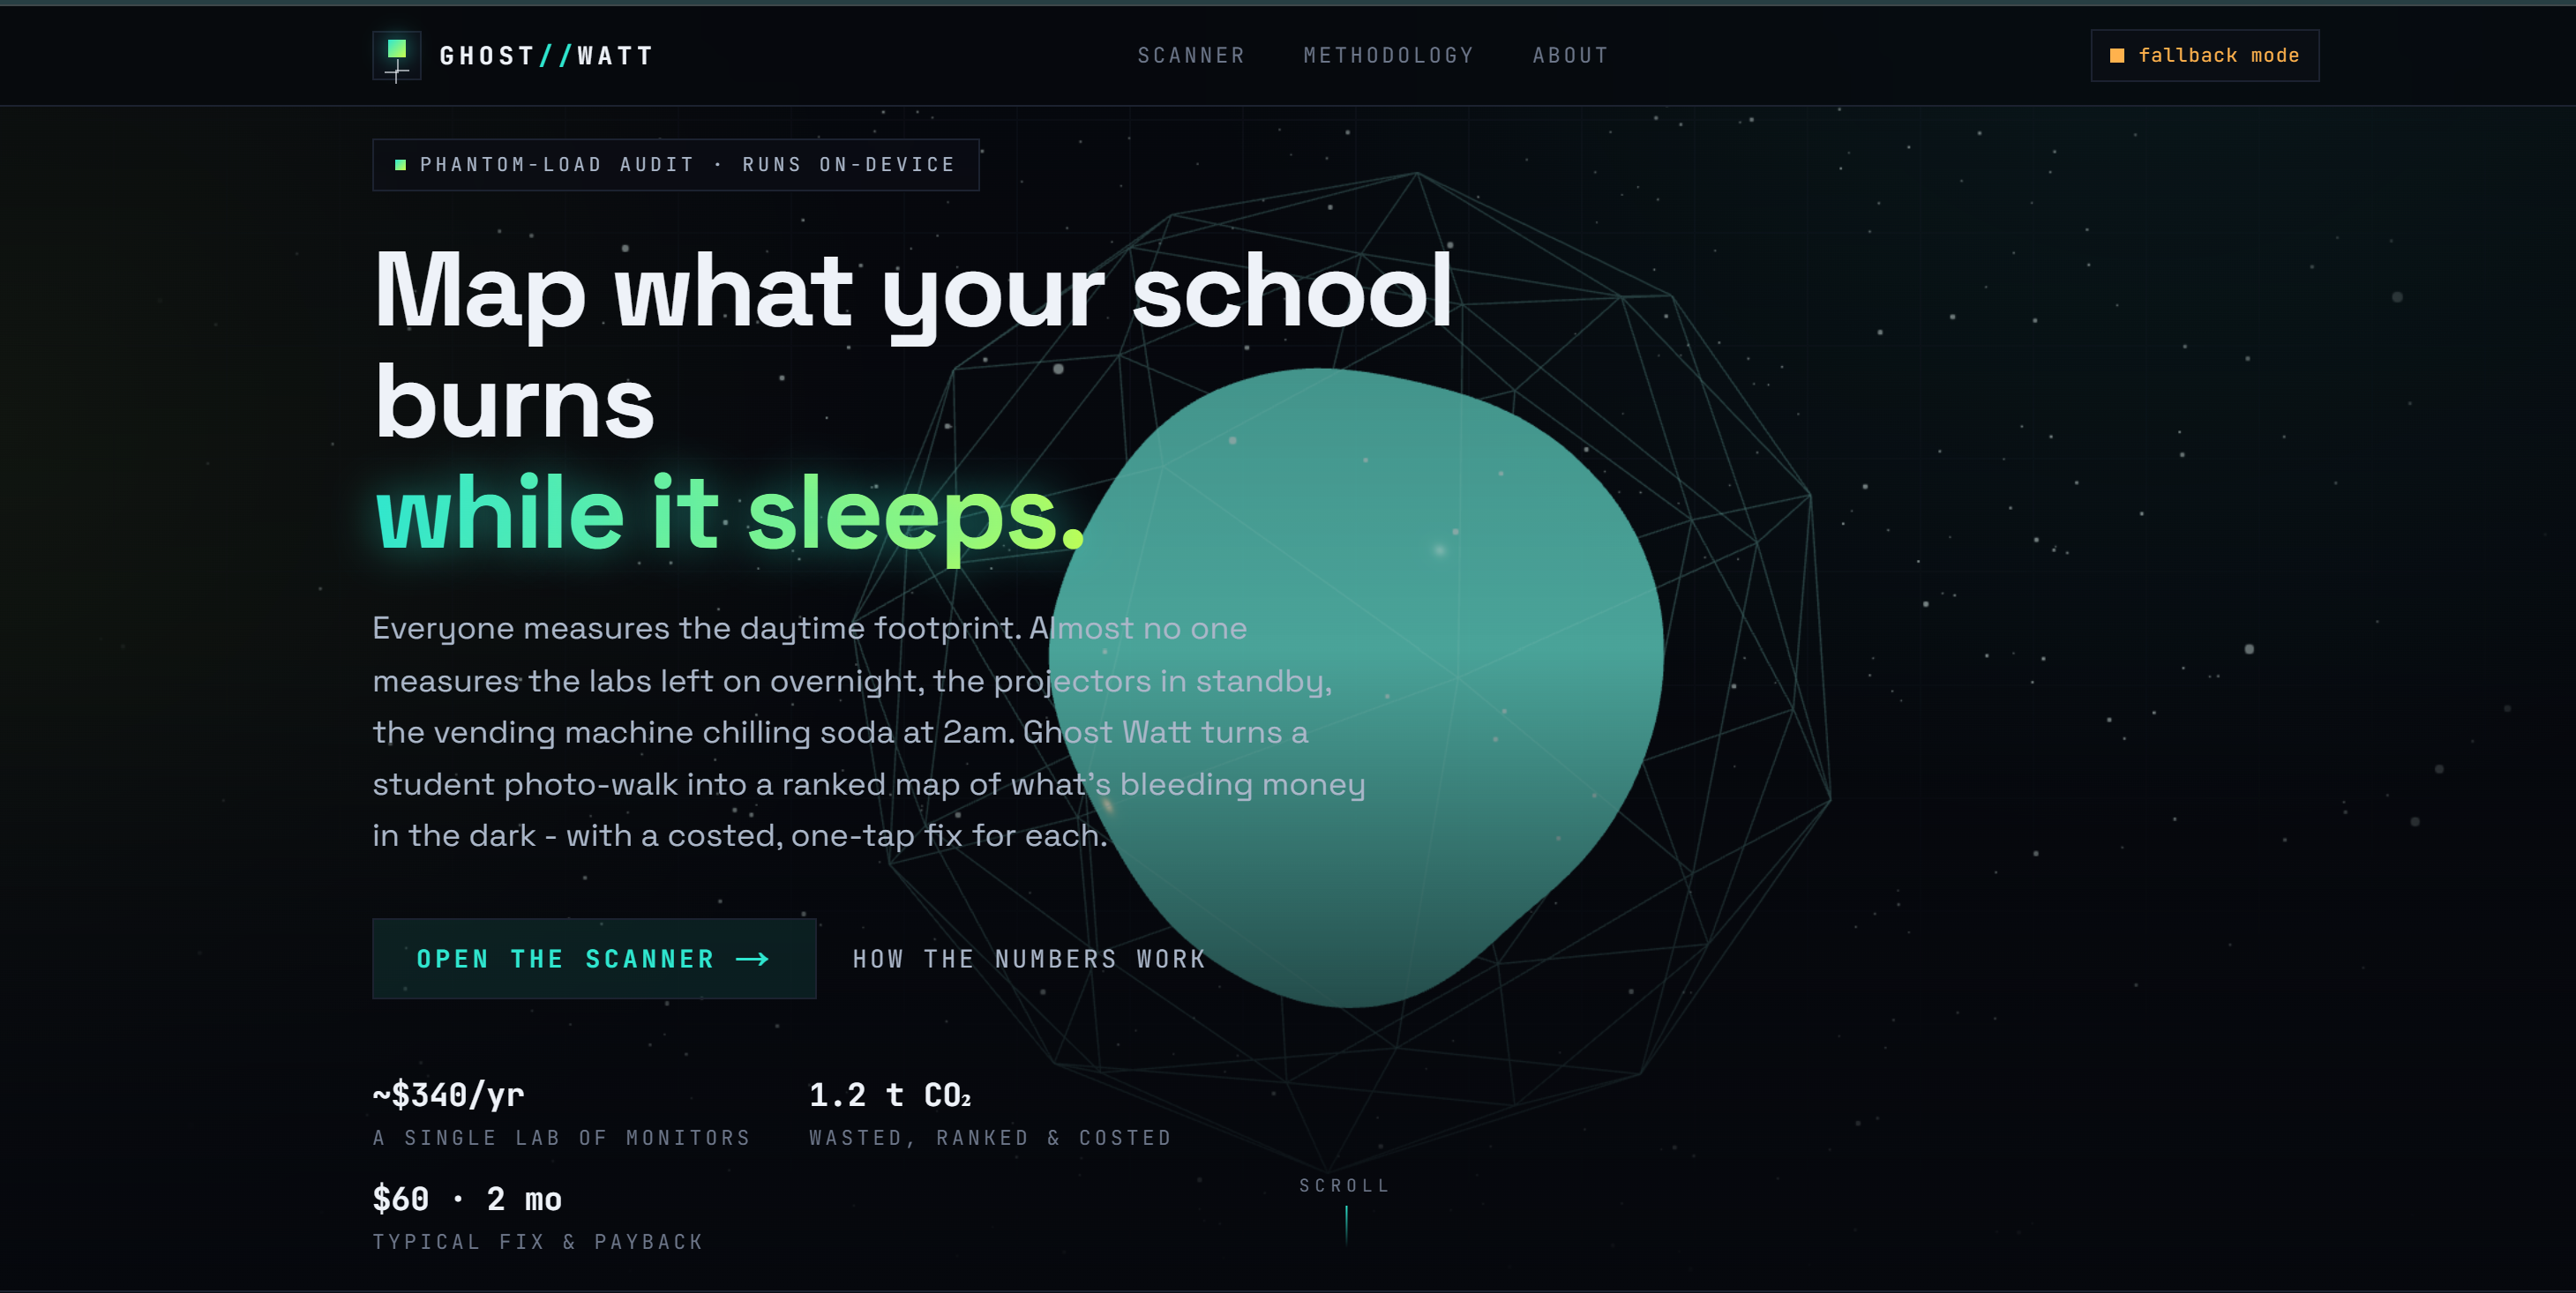
Our school sent around an email asking everyone to "be mindful of energy use," and it basically did nothing, because nobody could see what they were supposed to change. We started noticing how much gets left running after the last bell: projectors glowing in empty classrooms, whole rows of monitors stuck on, the vending machine humming to itself at midnight. None of it feels like a big deal on its own, which is exactly why it never gets fixed.
We realized the hard part isn't caring about energy waste. The hard part is seeing it. So we wanted a tool that needs nothing more than a phone and a walk through the building, and that ends with a clear answer to one question: what should we fix first?
What it does
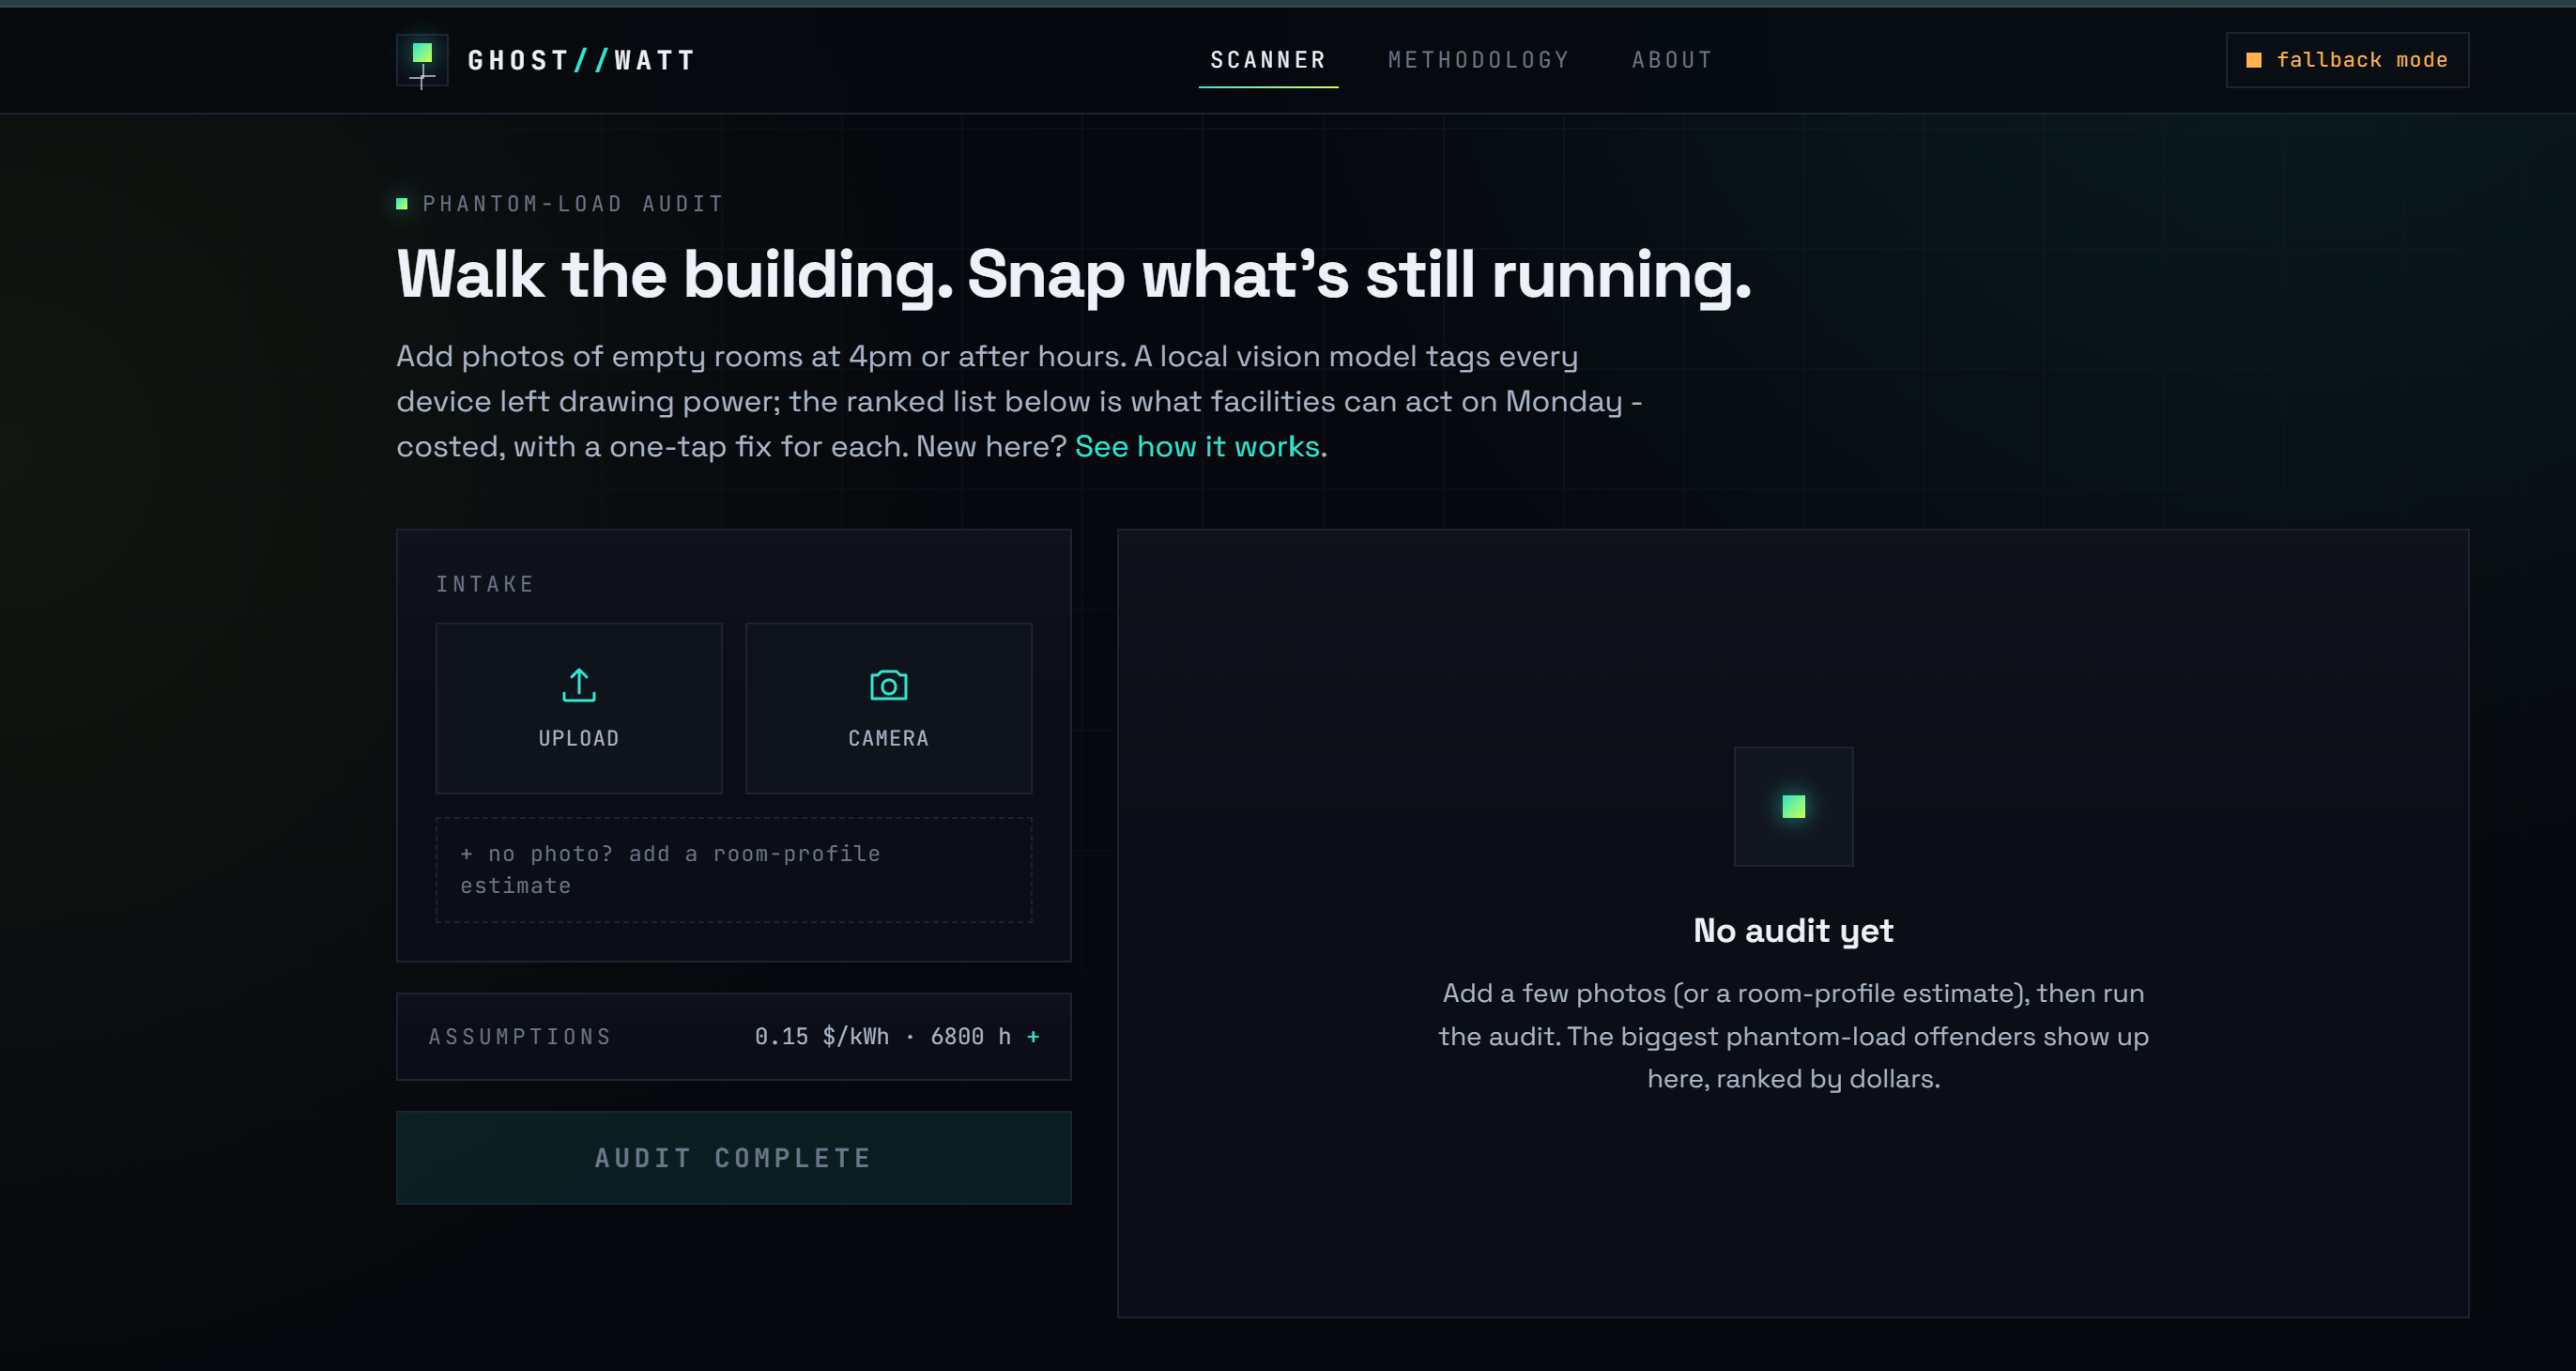
Ghost Watt turns photos of an empty school into a ranked, costed list of energy "offenders."
You walk through the building after hours and take a picture of each room. For every photo, a vision model identifies the electrical devices it can see and whether each one looks on, in standby, or off. Ghost Watt then estimates how much each device wastes per year in kilowatt hours, dollars, and CO2, attaches a concrete fix to each one (a timer, a smart power strip, an overnight-off policy), and works out how quickly that fix pays for itself.
The result is a priority list sorted worst-first, so a facilities manager or an eco-club member knows exactly where to start on Monday morning. Every figure is something you can trace back to an assumption you control.
How we built it
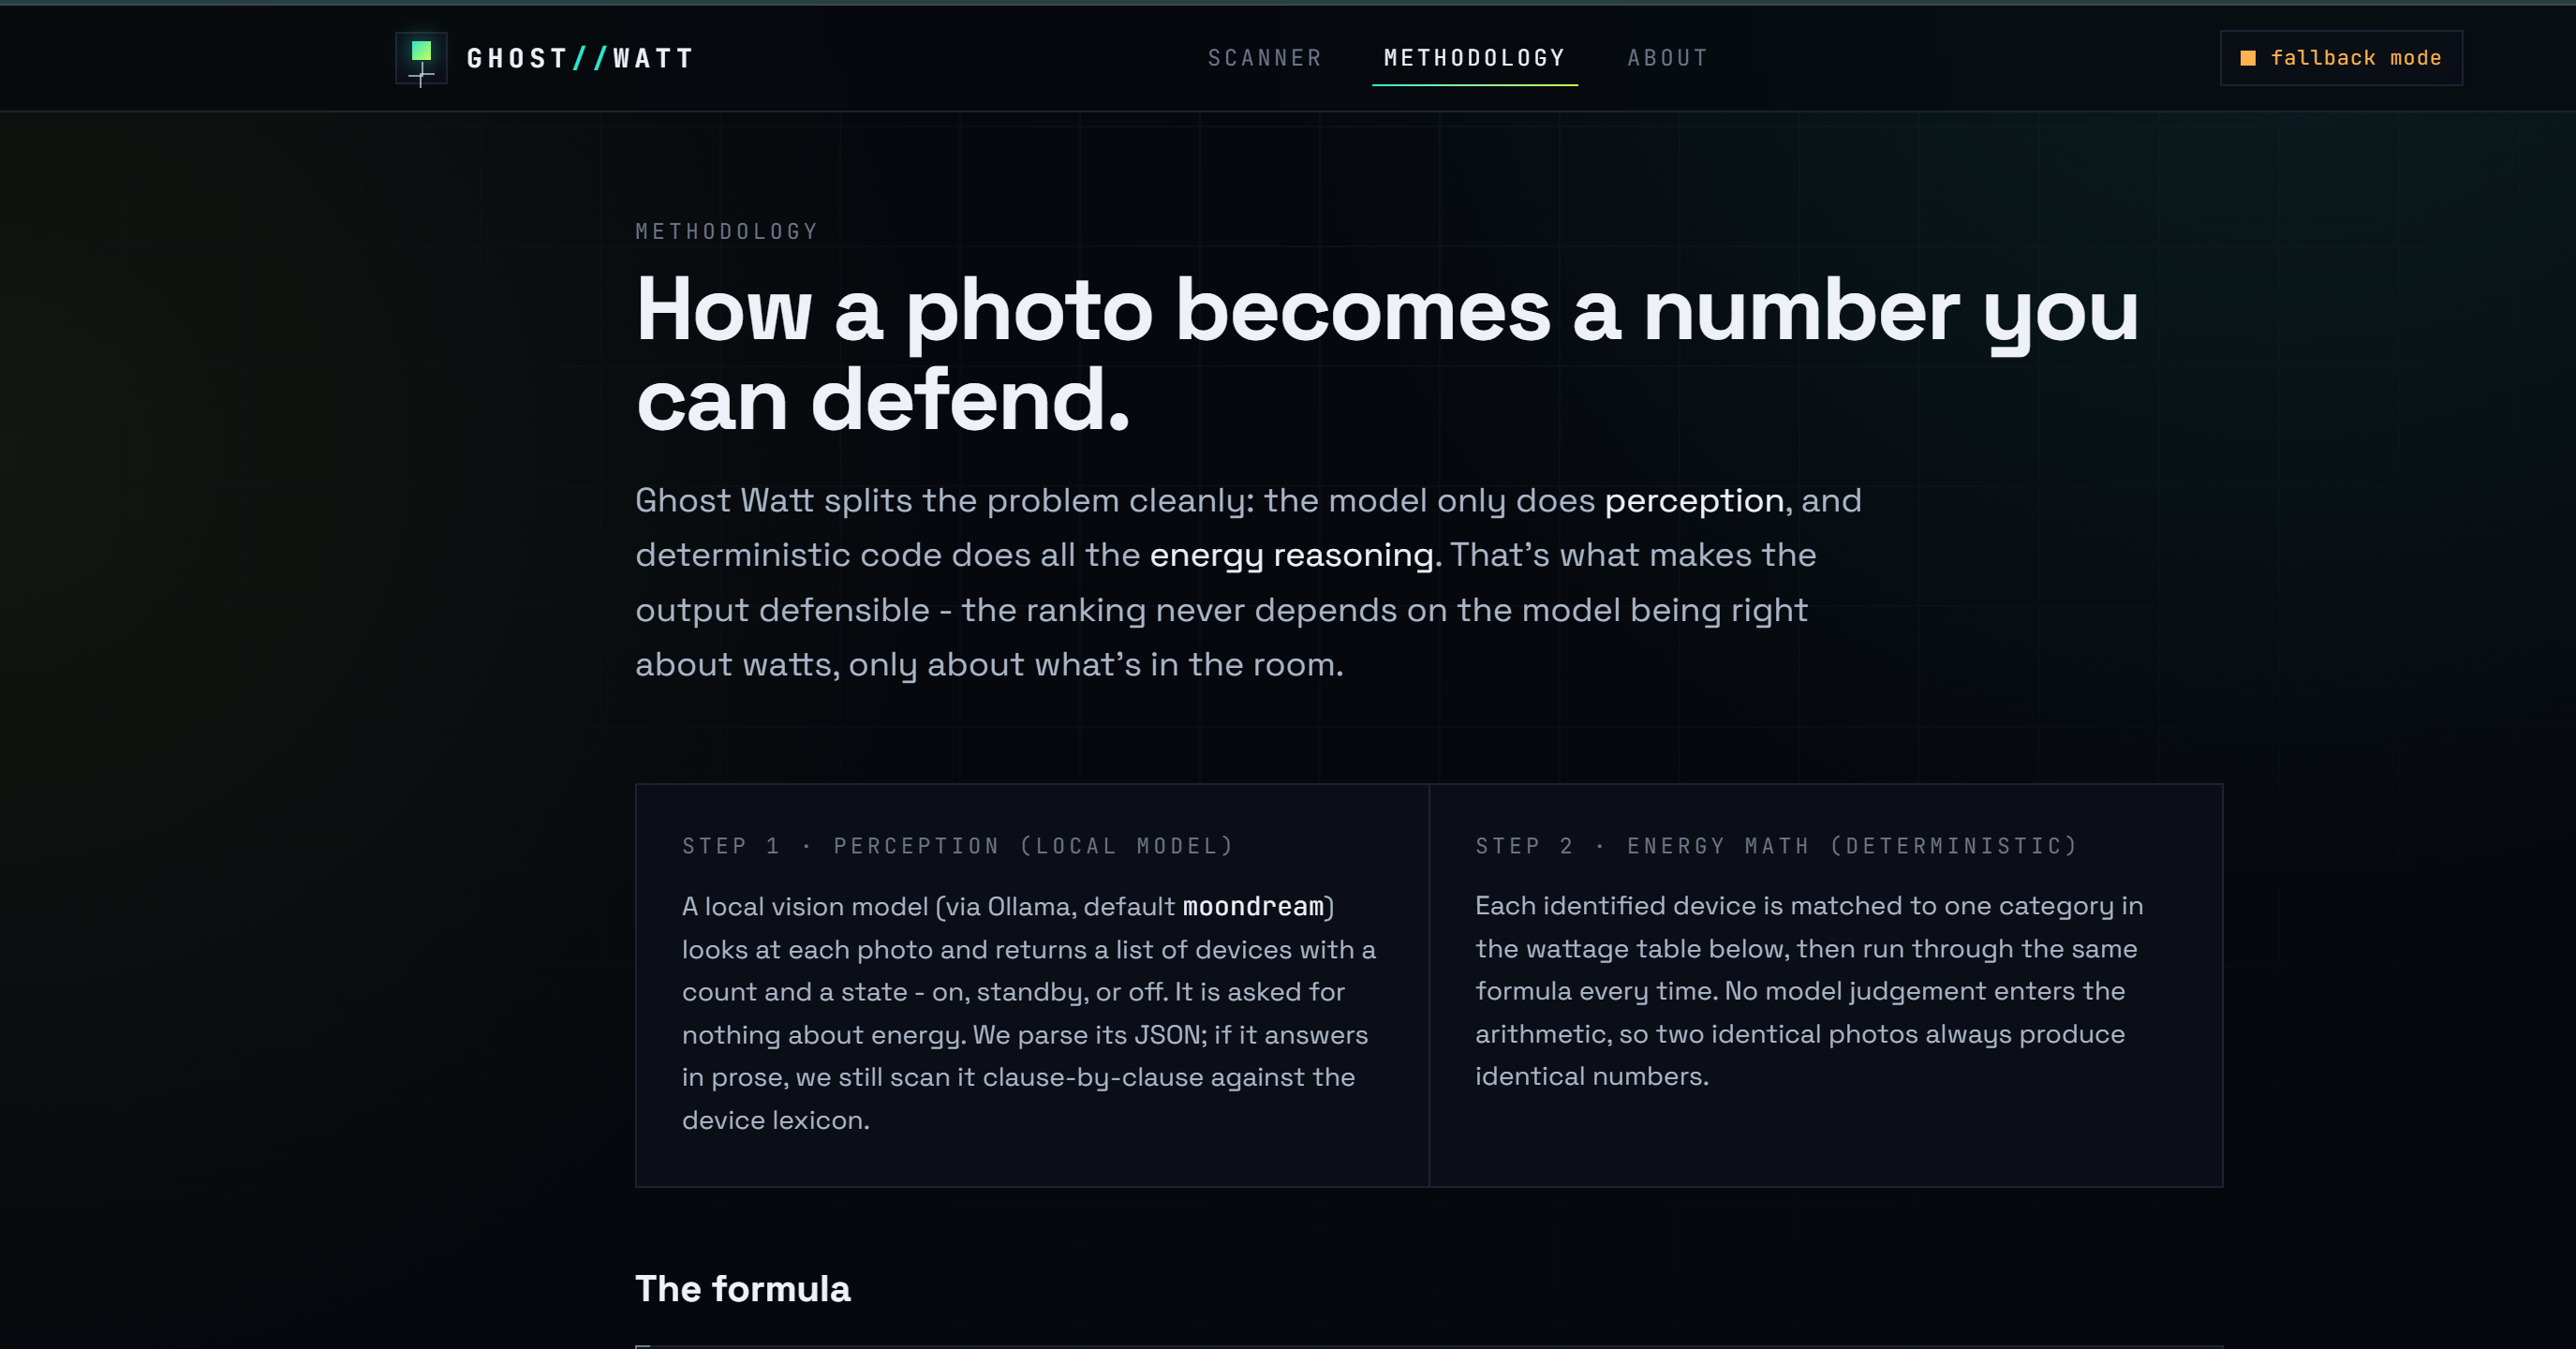
The core design decision was to split the fuzzy part of the problem from the exact part.
- Perception (fuzzy). A local vision model running on Ollama does one job: look at a photo and report the devices and their state. It never reasons about energy.
- Accounting (exact). Everything to do with money and carbon is plain, deterministic TypeScript that anyone can read and audit. Each detected device is matched to a wattage lookup table, then run through one transparent formula:
$$ \text{kWh/yr} = \frac{\text{effective watts}}{1000} \times \text{empty hours per year} $$
$$ \text{cost/yr} = \text{kWh/yr} \times \text{electricity rate}, \qquad \text{CO}_2\text{/yr} = \text{kWh/yr} \times \text{grid carbon intensity} $$
where a device's effective draw depends on its state, for example $W_\text{on}\times d$ for an active device (with duty cycle $d$) versus $W_\text{standby}$ for one left idle.
The frontend is Next.js (App Router) with TypeScript and Tailwind, plus a small React Three Fiber scene for the landing page. The whole thing runs locally, with no external APIs, no API keys, and no data ever leaving the user's machine.
Challenges we ran into
- Estimating power from a single photo without overclaiming. You cannot read exact wattage off an image, and we did not want to pretend otherwise. We solved this by treating the ranking as the real output. Even when an individual wattage figure is rough, the order of the worst offenders stays stable, and the order is what drives action.
- Running vision models on normal hardware. Not everyone has a GPU. We defaulted to a small, CPU-friendly model and tuned timeouts so the app stays usable on a basic laptop.
- Messy model output. Vision models do not always return clean JSON. Our parser tries to read JSON first, then falls back to scanning the description clause by clause, so even a chatty response is still usable.
- Never showing a blank screen. If no model is available, the app falls back to a transparent room-profile estimate and clearly labels it, so a demo never breaks.
Accomplishments that we're proud of
- It runs entirely on your own machine. No accounts, no cloud, no paid services, and your photos stay private.
- The honesty of the system. Every card is labelled
liveorestimated, every number is tied to an assumption you can change, and the methodology is fully written out in the app. - A working end-to-end flow, from photo to ranked fix-list with payback, rather than just a concept.
- We kept a human firmly in control. Ghost Watt suggests and ranks, but never decides what to buy or change on its own.
What we learned
The biggest lesson was that for a decision-support tool, a useful ordering beats false precision almost every time. People do not need to know that a projector wastes exactly 312 kWh a year. They need to know it is the first thing they should deal with.
We also learned how much trust depends on transparency. Separating perception from accounting, showing our assumptions, and labelling estimates honestly made the tool feel far more credible than hiding everything behind a single confident-looking number.
What's next for Ghost Watt
- Per-school wattage overrides and a CSV/PDF export so facilities staff can act on the results directly.
- A guided mobile capture flow (one tap per room) and saved audit history to track progress over time.
- Importing real sub-meter readings to calibrate the estimates against actual consumption.
- Region- and utility-specific carbon factors so the CO2 numbers reflect the local grid.
Built With
- css
- framer
- javascript
- next.js
- react
- tailwind
- three.js
- typescript

Log in or sign up for Devpost to join the conversation.