-
-
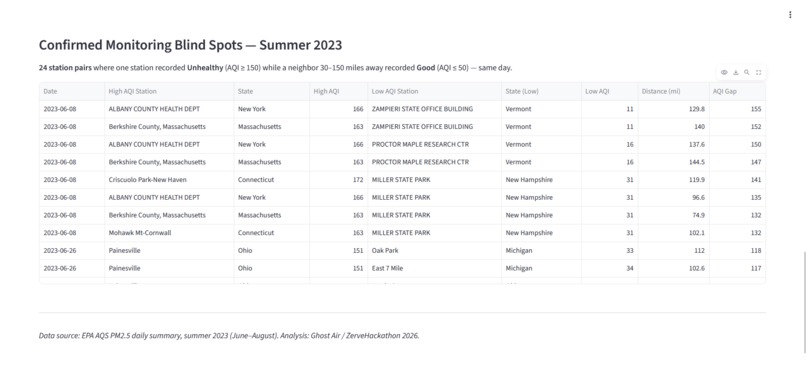
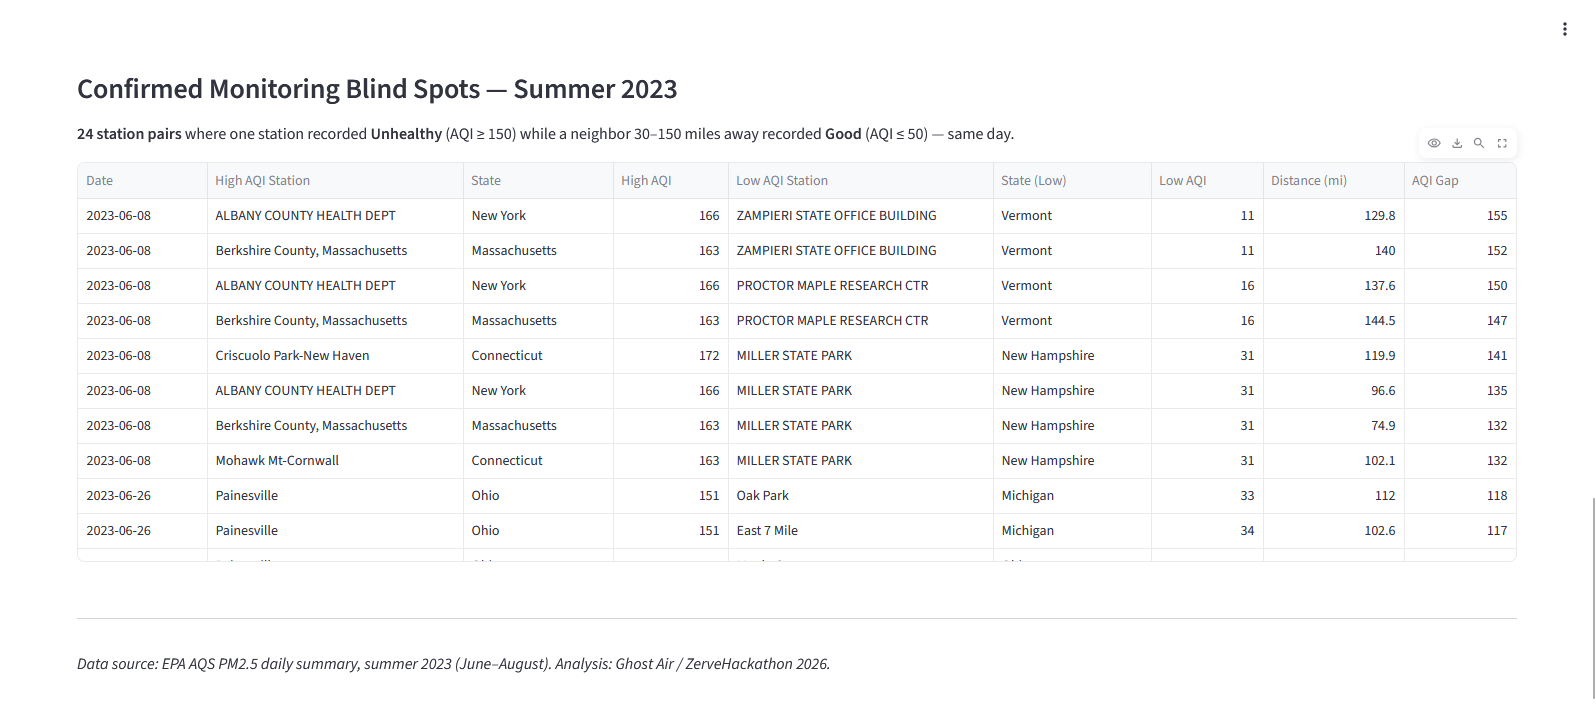
A data deep dive identifying 24 confirmed blind spots where neighboring stations reported AQI discrepancies as high as 155 points.
-
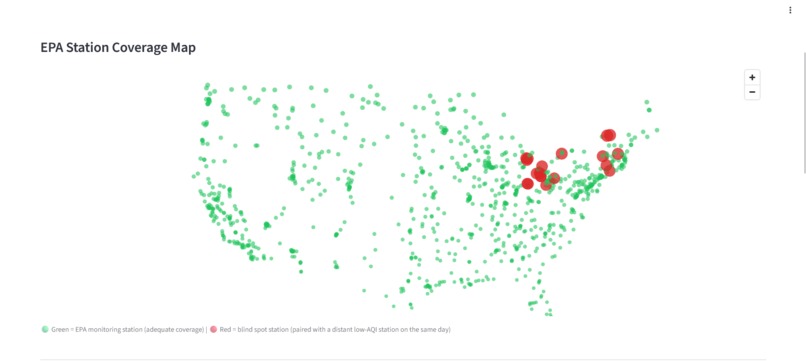
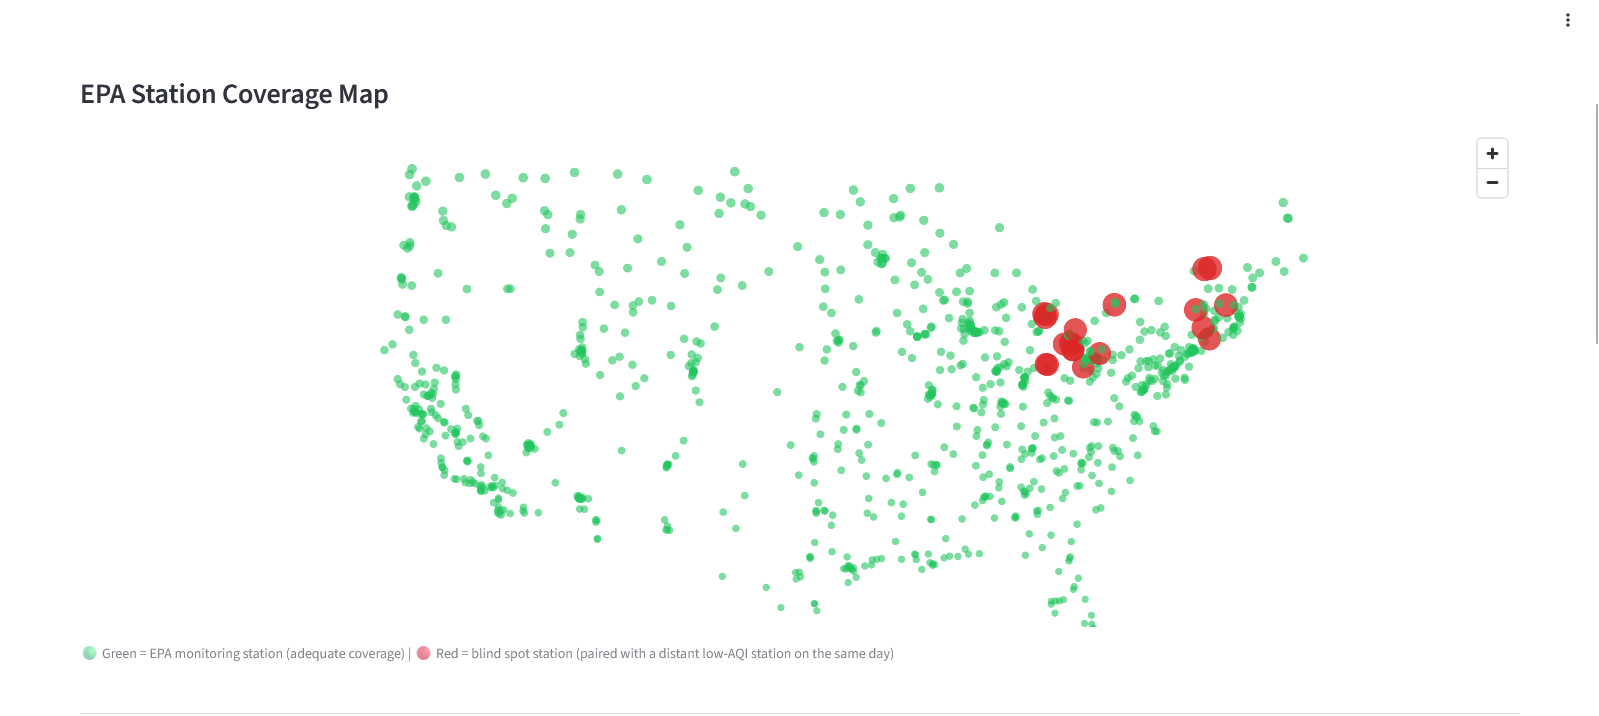
Spatial analysis mapping 24 high-risk "Ghost Air" zones (red) where the monitoring network is too sparse to detect localized smoke.
-
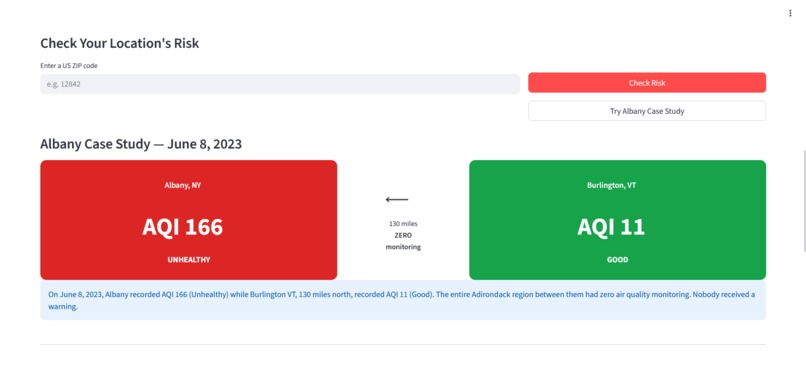
A real-world demonstration of the 130-mile monitoring gap between Albany and Burlington that left an entire region without health warnings.

Inspiration
During the record-breaking wildfire season of 2023, we noticed a critical gap: official apps often showed “Good” air quality in areas visibly covered in smoke.
The issue is structural. The EPA monitoring network is spatially limited—averaging roughly one PM2.5 sensor per 3,800 square miles.
This raised a key question:
What is happening in the gaps between sensors?
We set out to find what we call “Ghost Air”—dangerous air quality conditions that exist but are not directly measured.
What it does
Ghost Air is a spatial analysis engine that identifies air quality monitoring blind spots.
It works by:
- Analyzing historical EPA data
- Comparing neighboring monitoring stations
- Detecting “mismatches” where nearby stations report drastically different air quality
These inconsistencies signal unmonitored high-risk zones, providing a more accurate localized assessment than relying on a single nearest station.
Output: A ranked list of high-risk zones with associated confidence scores, enabling targeted decision-making.
How we built it
Built entirely on Zerve, our pipeline:
- Ingests 215,732 EPA records
- Processes 991 active monitoring stations
- Performs pairwise spatial analysis across 14,483 station combinations
Core technologies include:
pandasfor data processinggeopyfor spatial distance calculationsscipyfor statistical validation
Using this approach, we identified:
- 24 confirmed “Ghost Air” zones from Summer 2023
The system is structured as modular Python components, designed for:
- Reusability
- Scalability
- Future real-time integration
The Impact
Our analysis uncovered 24 blind spots affecting thousands of residents.
Albany Case Study
- A 130-mile monitoring gap left the Adirondack region without warnings
- Neighboring stations showed a 155-point AQI discrepancy
By quantifying these gaps, Ghost Air provides actionable insight for:
- School districts
- Public health agencies
- Emergency response planners
This moves air quality assessment beyond “nearest sensor” assumptions.
Challenges we ran into
- Processing large-scale pairwise spatial computations efficiently within the Zerve environment
- Ensuring scientific defensibility of results
We focused on:
- Highlighting network limitations, not sensor errors
- Maintaining rigorous spatial logic and reproducibility
Accomplishments that we're proud of
- Identified and validated 24 high-risk blind spots using only raw EPA data
- Built a fully transparent, end-to-end pipeline within Zerve
- Transformed raw datasets into a mathematically validated risk model
What we learned
- The “nearest station” model breaks down during wildfire events
- Spatial gaps can significantly distort perceived air quality
- Zerve enables efficient handling of complex spatial analysis workflows in a unified environment
What's next for Ghost Air
Phase 1 — Live API
Deploy the analysis engine as a FastAPI endpoint for real-time access
Phase 2 — Interactive Frontend
Build a Streamlit-based Risk Map for public exploration
Phase 3 — NOAA Integration
Incorporate wind transport data to:
- Validate smoke plume movement
- Improve prediction accuracy

Log in or sign up for Devpost to join the conversation.