How we incorporated IBM zSystems
We utilized the computational power of the IBM server to increase computational efficiency. Performed 65 million iteration calculation of looping through the dataset to determine nearest neighbors for street lights and crime risks relative to each street light pole. ** Increased efficiency and runtime of the notebook significantly.**
Inspiration
We believe that students and community residents of cities with populations larger than 100K people have problems feeling safe when walking around the city — or more generally, cities with higher crime rates/danger levels. As residents of Berkeley, we have constantly felt a sense of fear and anxiety getting from one place to another. Most students walk back home scared at night, fearful of getting mugged, robbed, or involved in some crime.
What it does
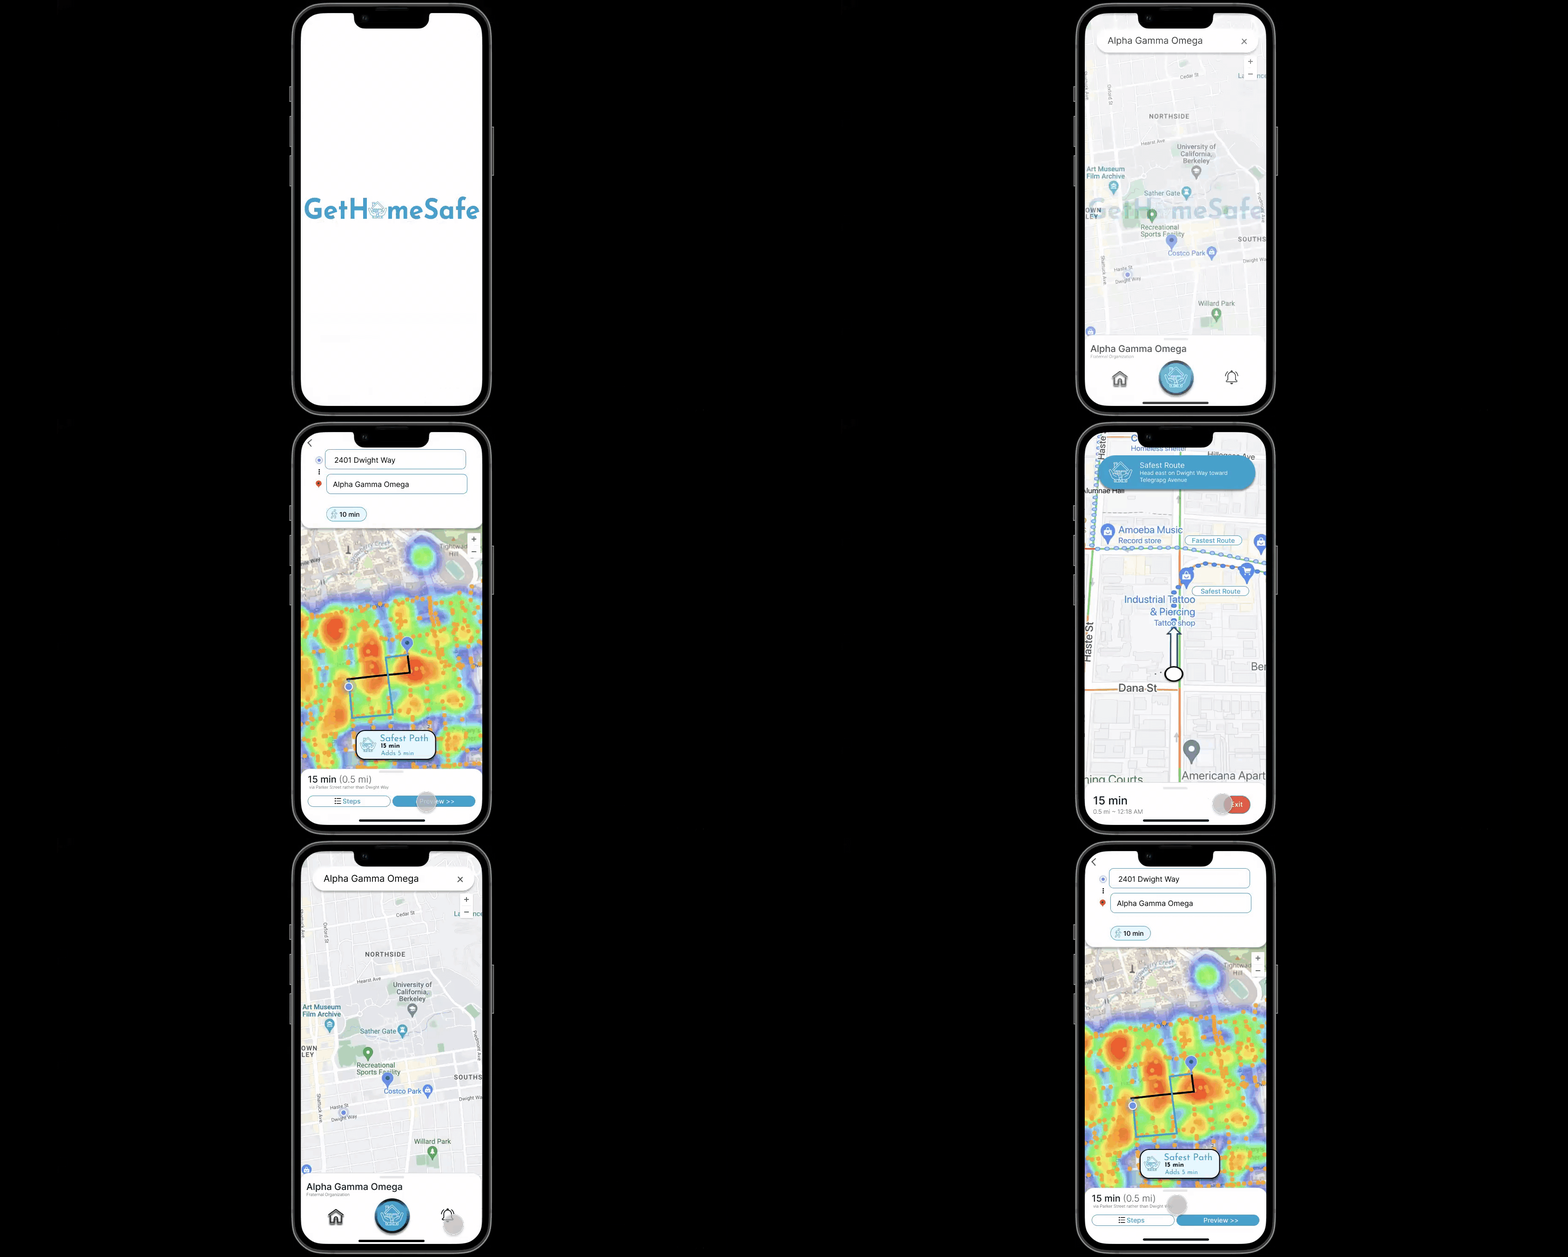
We performed data analysis with access through IBM Community on historical crime data and street light data within Berkeley to develop predictions for the safest walking path from point A to point B, instead of the shortest path.
How we built it
We did this by creating heat map visualizations to understand the density of crime in relation to the number of street lamps in the area surrounding the crime. We created an algorithm in order to assess the risk factors associated with different areas in Berkeley and ultimately used our heuristic to predict which blocks in Berkeley would be the safest to walk in with the risk factor, where there is less risk. We additionally performed linear regression with cross-validation to predict crime risk from latitude, longitude, the density of neighboring street lights, wattage, etc.
Challenges we ran into
1) Calculating the number of neighboring street lights within a 150m radius of each street light based on latitude and longitude. 2) Developing the most accurate prediction model with the features available 3) Incorporating the algorithm for pathing from start to destination.
Accomplishments that we're proud of
We are proud of being able to take a real tangible issue that thousands of students face, and enable students to get home safer with the knowledge of areas with more lights and lesser crimes. We are also proud of applying the knowledge we have learned from data science principles, like creating our linear regression models and several other data visualizations. Ultimately, we believe that the tool is powerful for helping people psychologically feel safer and walk safer at night.
What we learned
We learned how to connect to the IBM servers to improve our computations' efficiency. We also learned that multiple other confounding factors constitute whether a place is less risky.
What's next for Get Home Safe
We want to expand the factors that could be implemented in our data visualizations, such as the density of street traffic, security cameras, road sizes, and more. We also want to expand our data analysis to cities beyond Berkeley, and impact the lives of others because improving safety is improving social good.

Log in or sign up for Devpost to join the conversation.