-

Number of licensed driver by state. Data from US Department of Transportation (2018).
-

Ratio between licensed young drivers (<=24) and total licensed driver by state.Data from US Department of Transportation (2018).
-

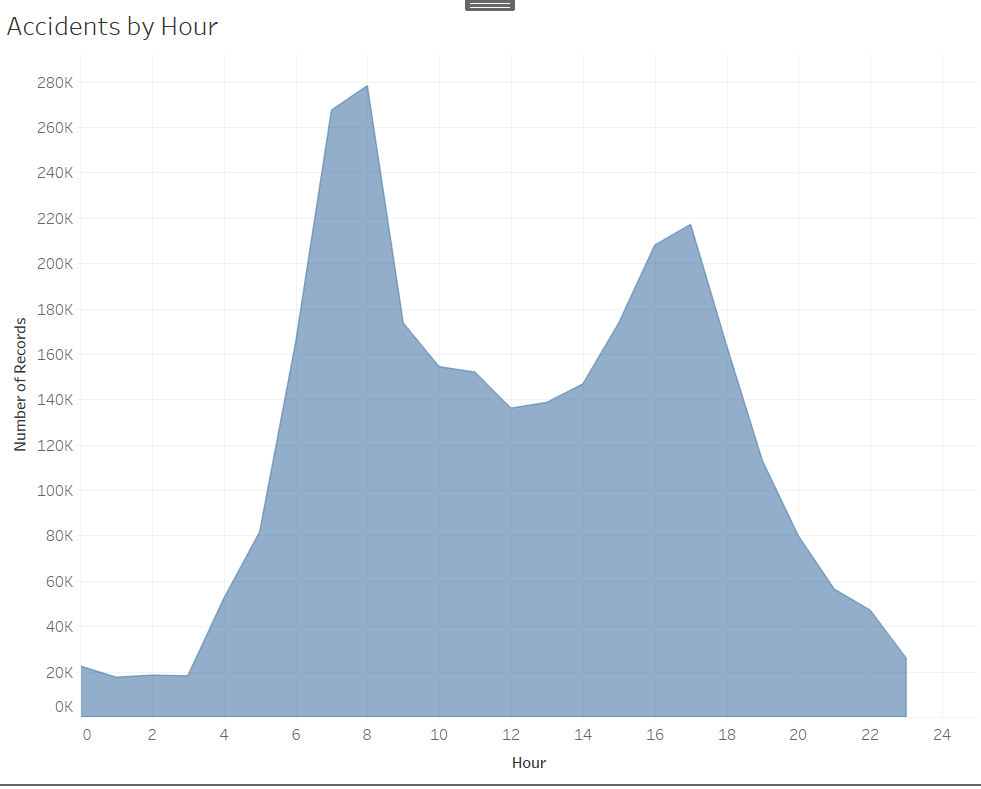
Total accidents by hour. Dataset given.
-

Total accidents by day of the week. Dataset given.
-
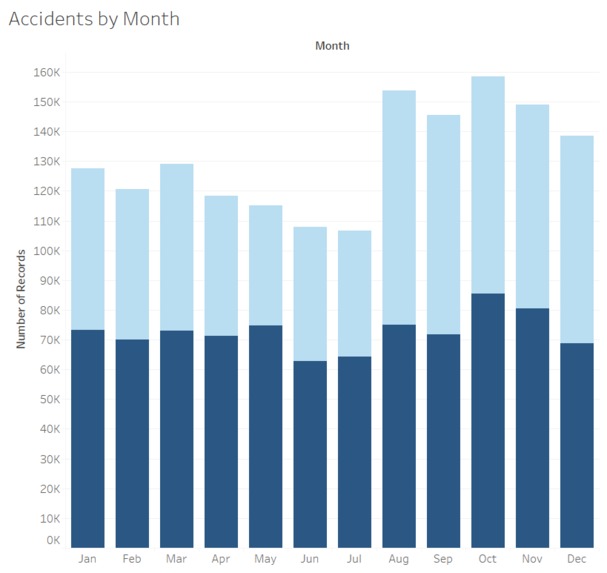
Total accidents by month of year (2017 & 2018). Dataset given.
-

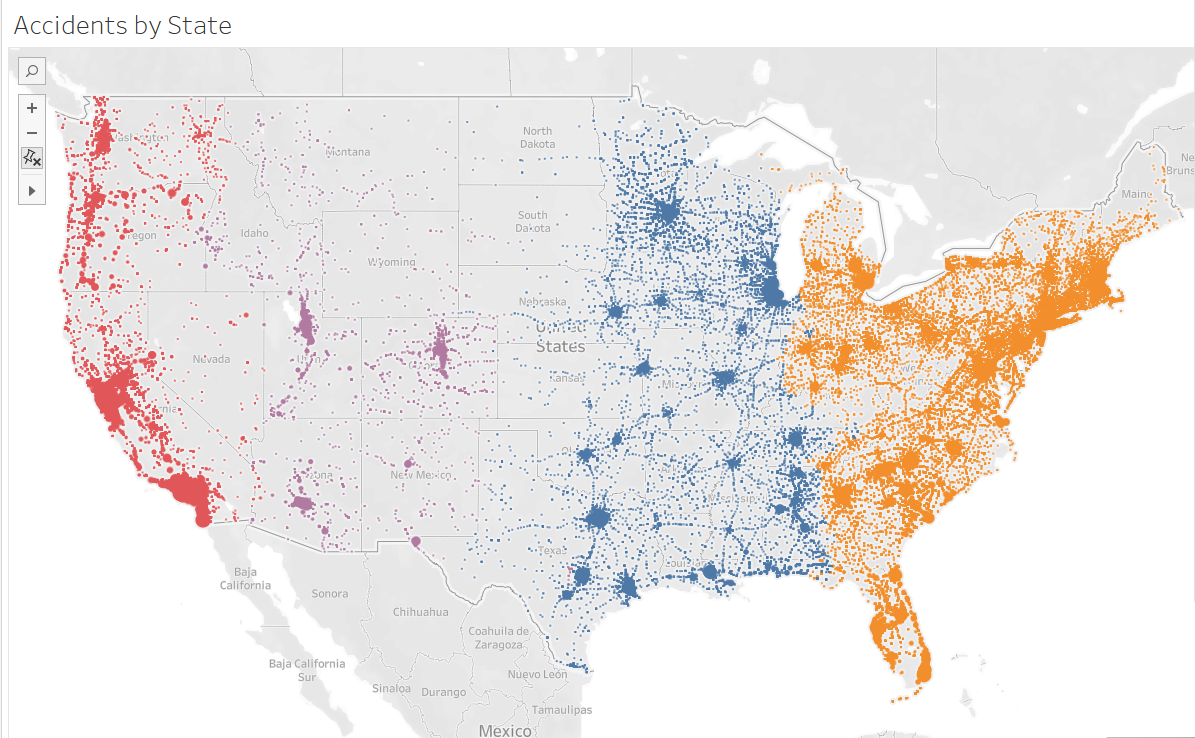
Total accidents on geographical map. Dataset given.
-

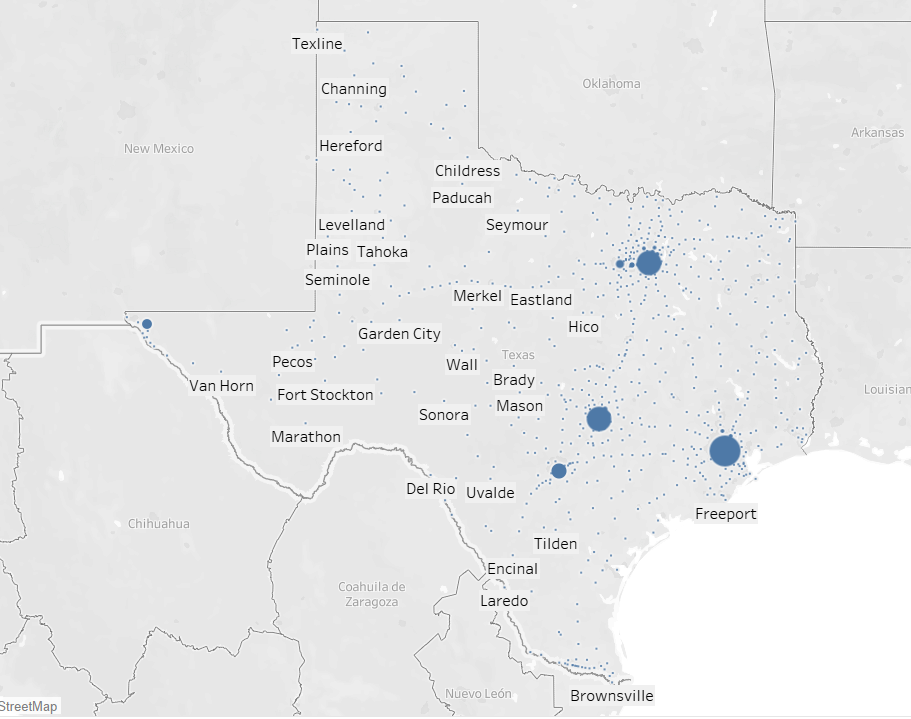
Accidents in Texas. Dataset given.
-

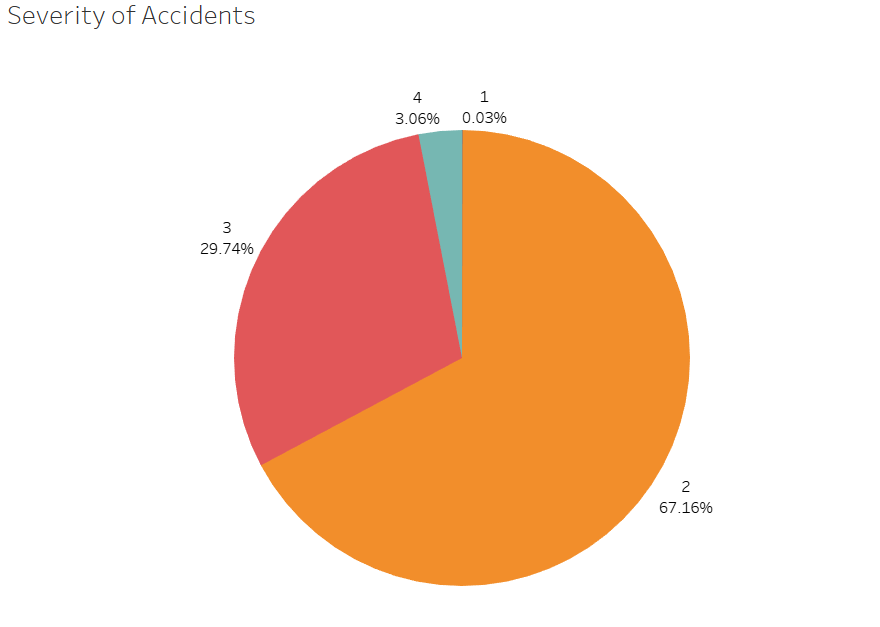
Severity score of accidents categorized by percentage (1 = lowest). Dataset given.
-

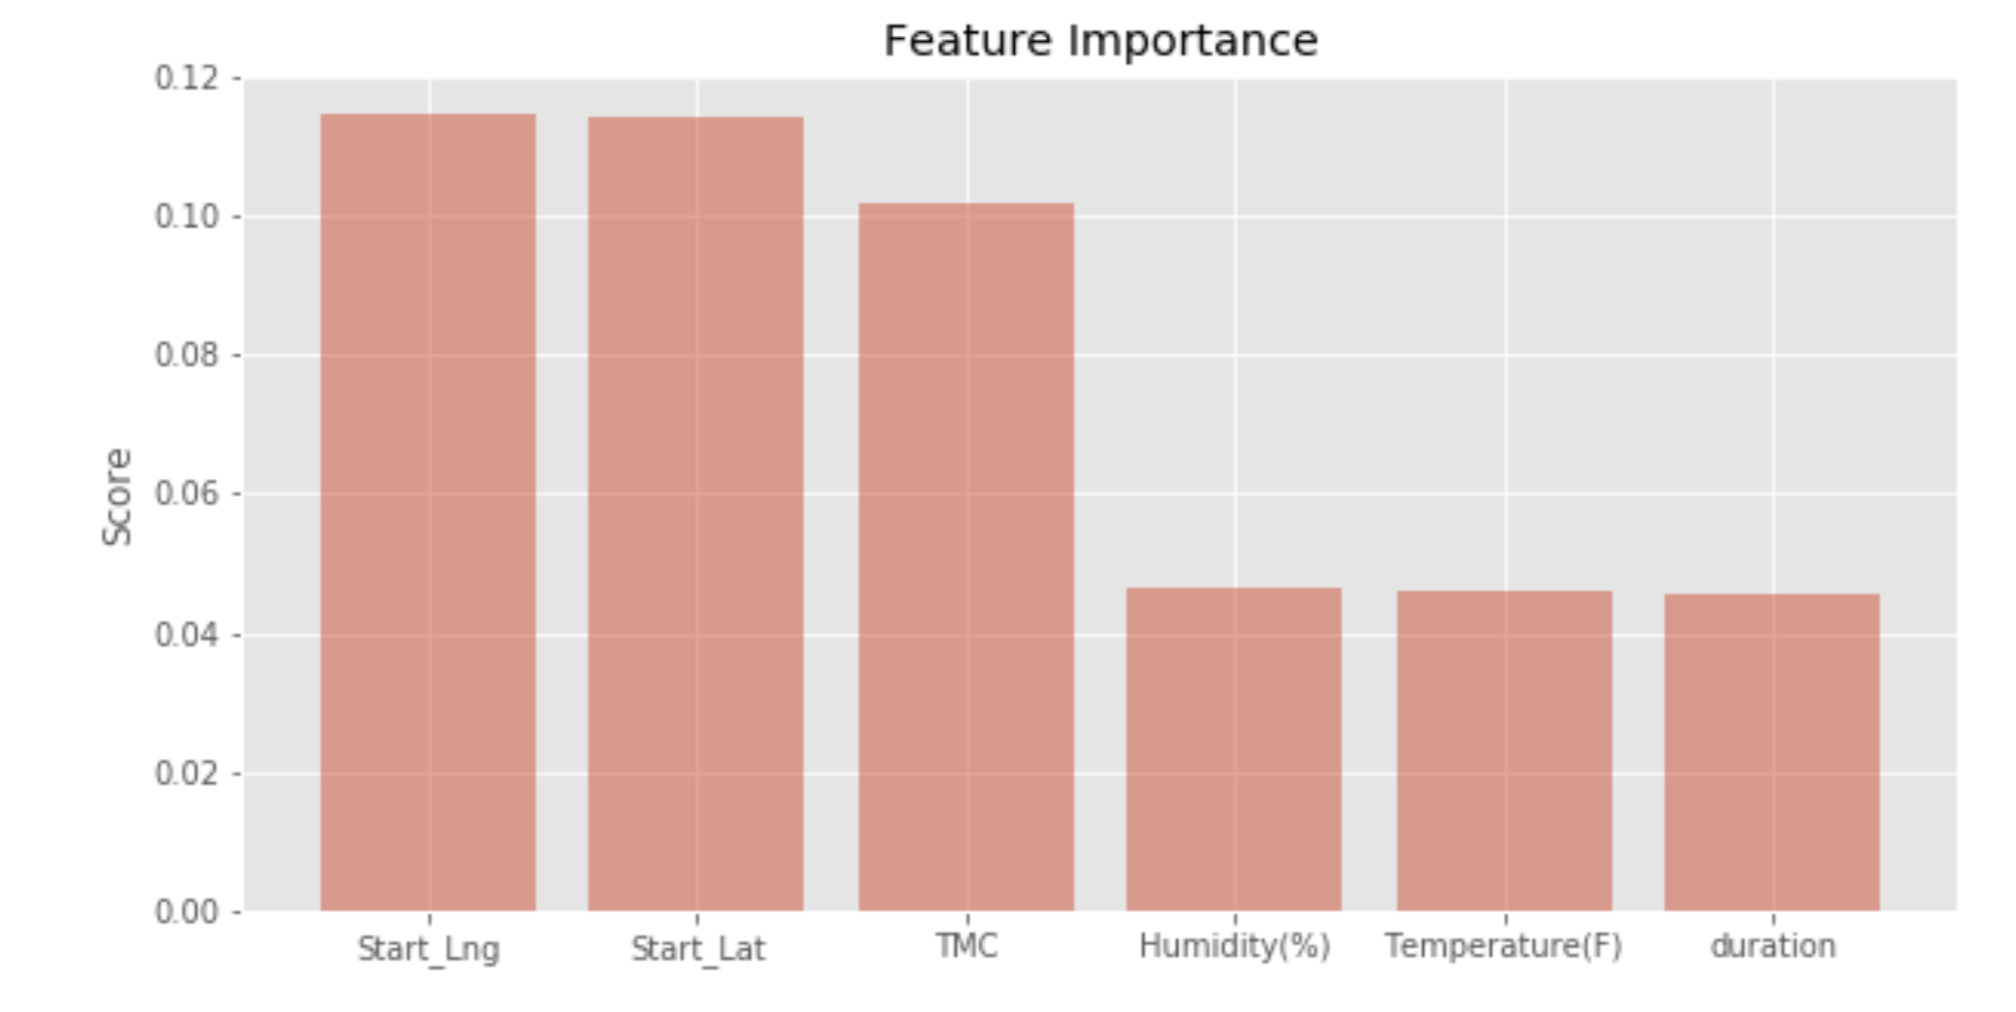
Feature Importance
-

Comparison of different models


Inspiration
Every year, there are millions of auto accidents happen in the U.S. They do not only affect the drivers but also a long line of traffic behind them and waste thousands of hours. The accident happens due to various reason which includes but not limited to weather, bad roads, reckless driving, driving during night time, or breaking the speed limit. Our mission today is to analyze the 3 years of data of all the accidents that happened in the US and help State Farm connect the dots between the cause and effect.
What it does
Our project answer 3 main problems:
1) What is the rate of accidents in each state and their demographics?
2) What month, day of the week, date of the month that most likely to have more accidents?
3) Can we predict the severity of accidents in Texas based on the provided data?
How I built it
We use the data set provided on Kaggle and the U.S. Department of Transportation to answer these questions. There are 2 big parts of our work:
- 1) Exploratory Data Analysis: we read the research papers, understand the data by looking at the descriptive statistics using pandas, and use Tableau to produce beautiful visualization.
- 2) Machine Learning: We preprocessed the data, handling missing values, remove outliners, apply different encoding schemes such as OHE and Binary, and compared the accuracy and stability of different machine learning algorithms (Logistic regression, Random forest, and XGB)
Challenges I ran into
- There are many missing values that cause the spareness in the data. We need to handle missing data carefully on 30 different features.
- The data is quite large (3 million data points and 49 features). It takes time to load the data into Tableau and run the XGBoots. Therefore, we reduced our prediction to only accidents within the state of Texas.
Accomplishments that I'm proud of
We decided how to tackle the problem from just a data set without any instruction in just one day. Our team worked hard, do a lot of research, and answer questions that have not been answered by the Kaggle community.
What I learned
- There are so many factors that can cause an accident
- Many different terminologies for accident regulation that we have never seen before (POI, Nautical Twilight, street number,...)
- We learn a lot from each other. Good teamwork always make things faster and more excited
What's next for "Get a Quote!"
- We plan to investigate the stability problem, see what may cause overfitting, and increase our statical power by more feature engineering
- We think that cohen Kappa is a more appropriate approach to validate the prediction.
- We want to treat the minority classes problem by downsampling and synthetical method such as SVMSmote
- We want to use a neural network on google cloud to solve the problem.


Log in or sign up for Devpost to join the conversation.