-
-
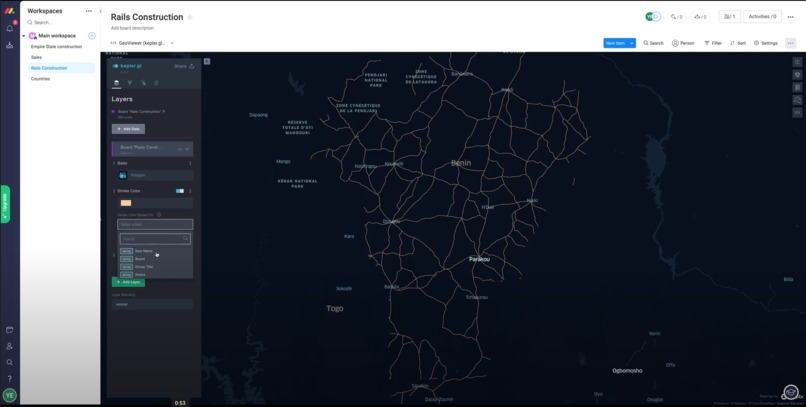
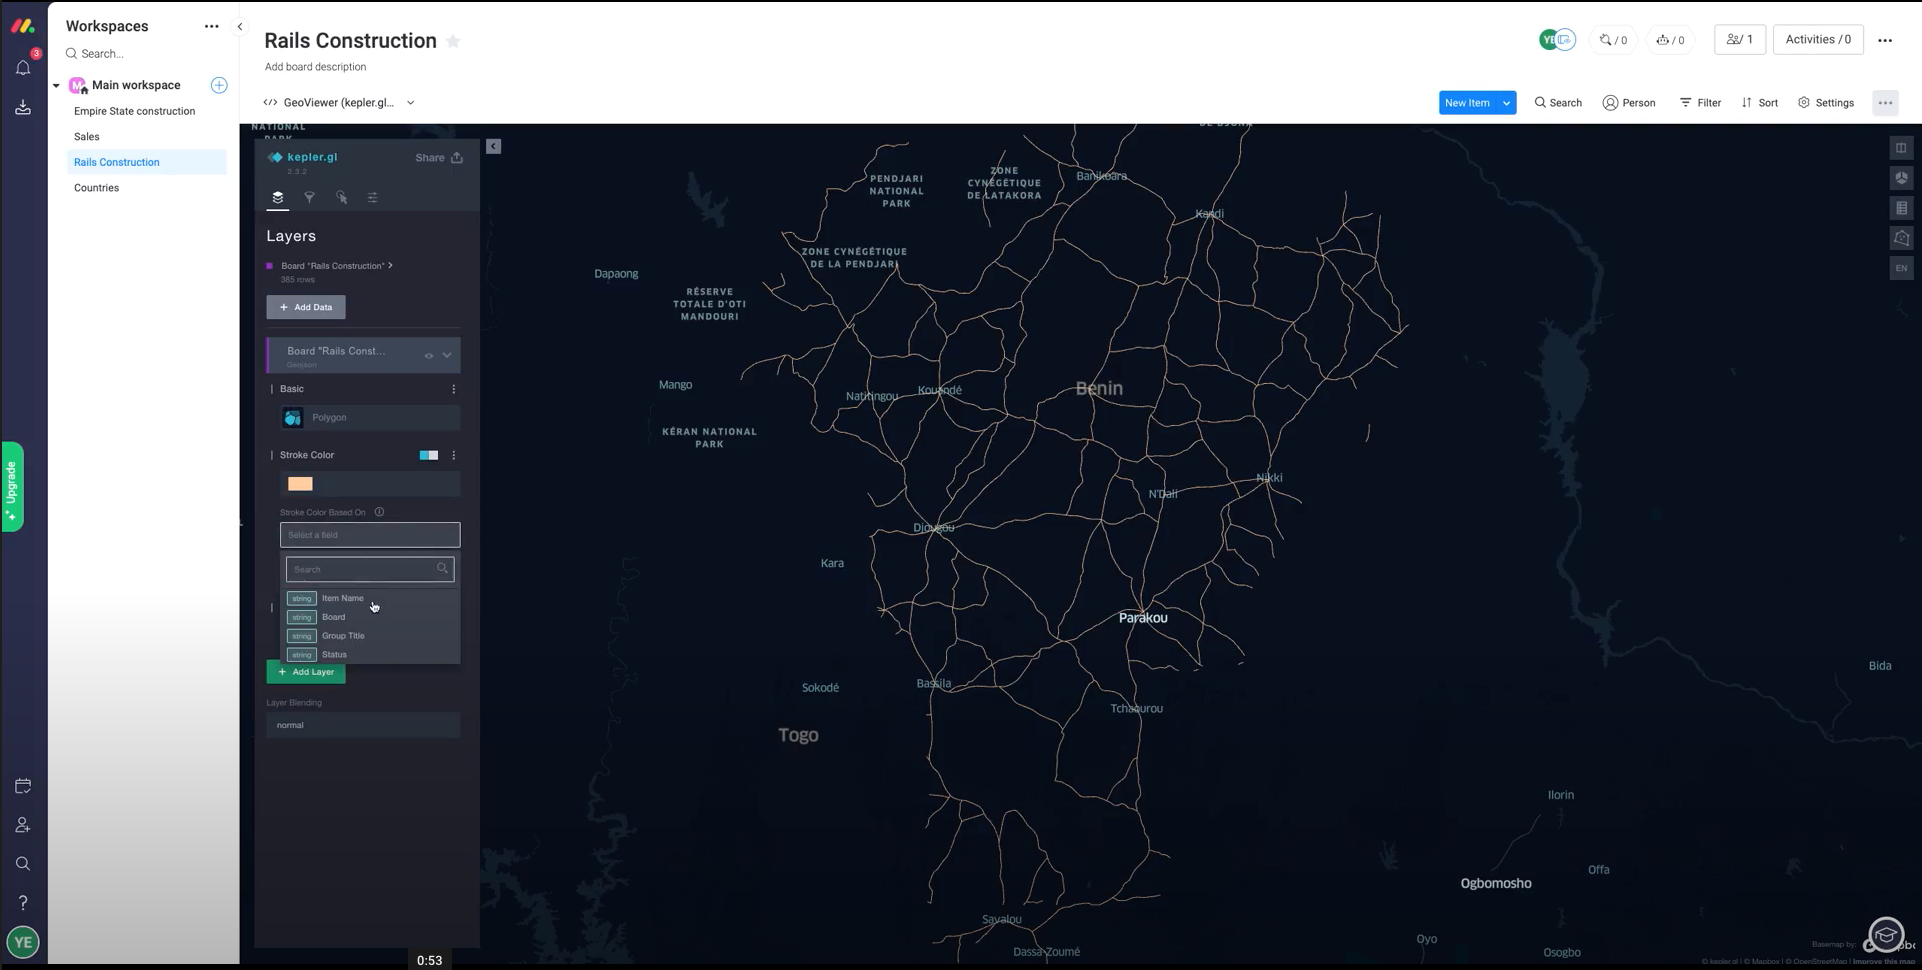
Polylines
-
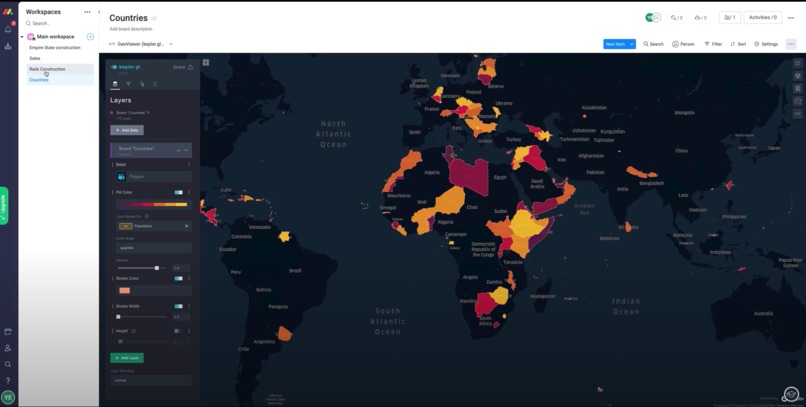
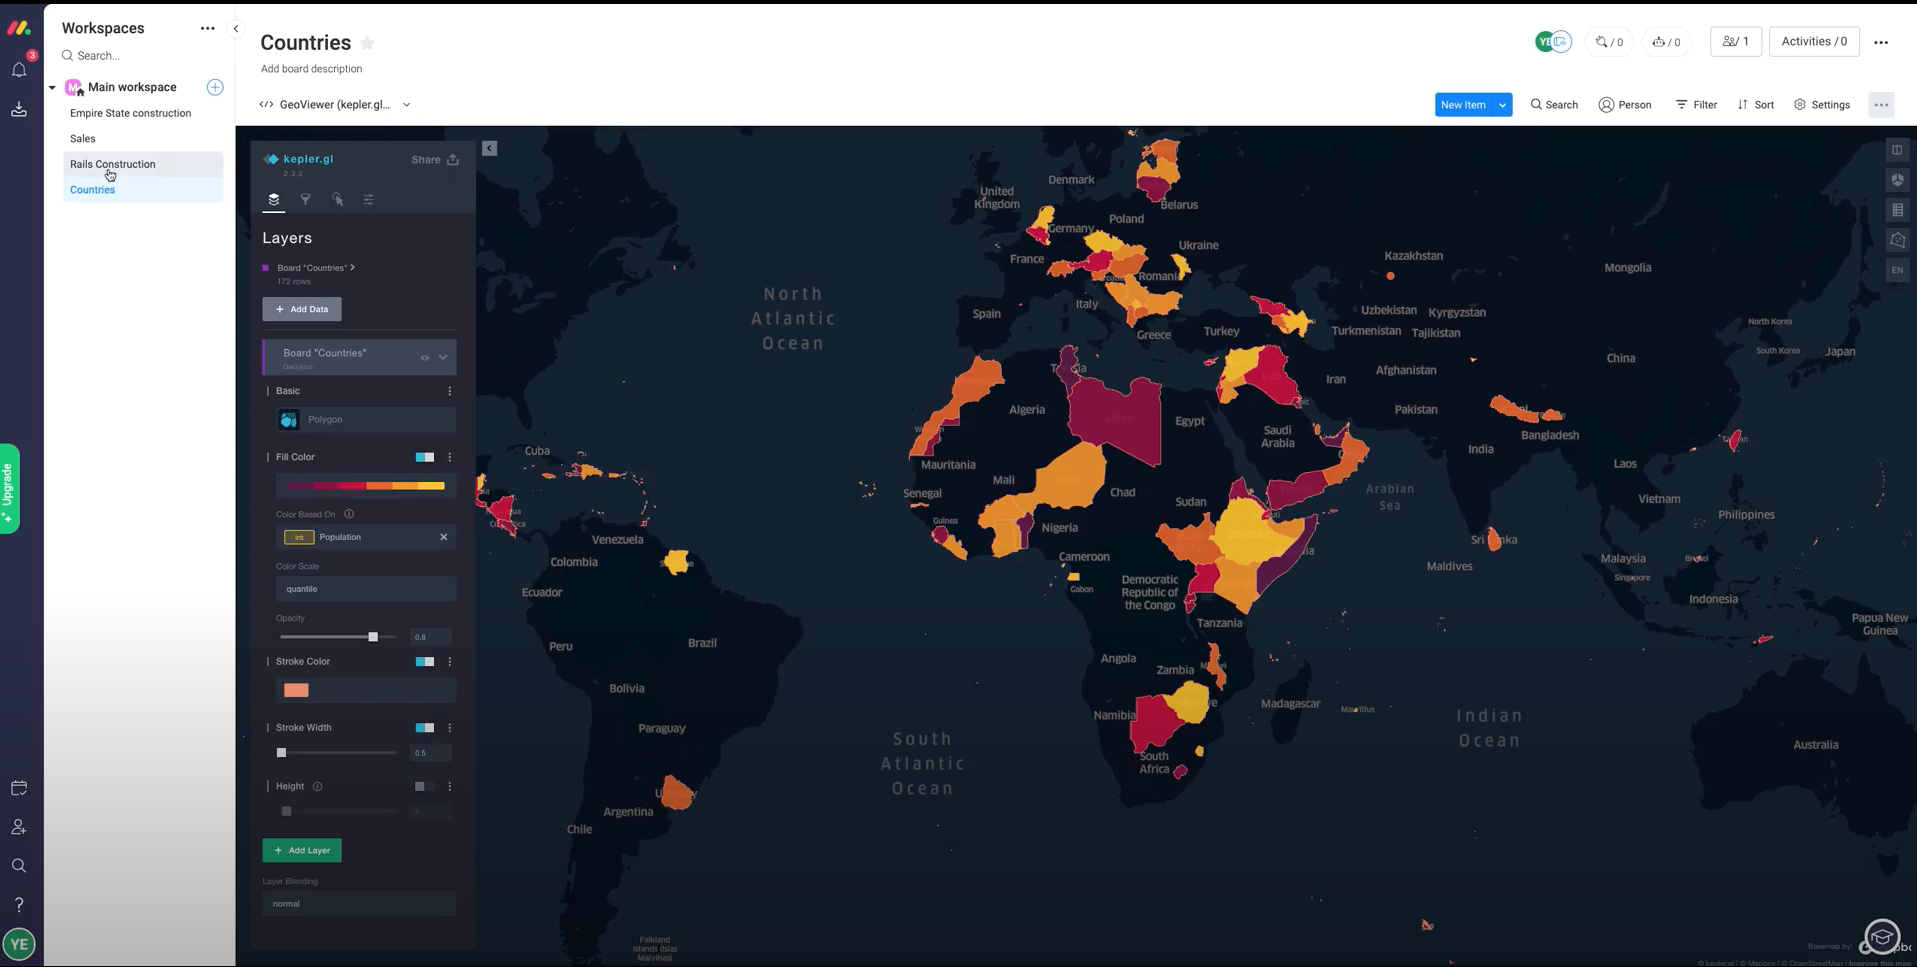
Polygons - fill color by a column value
-

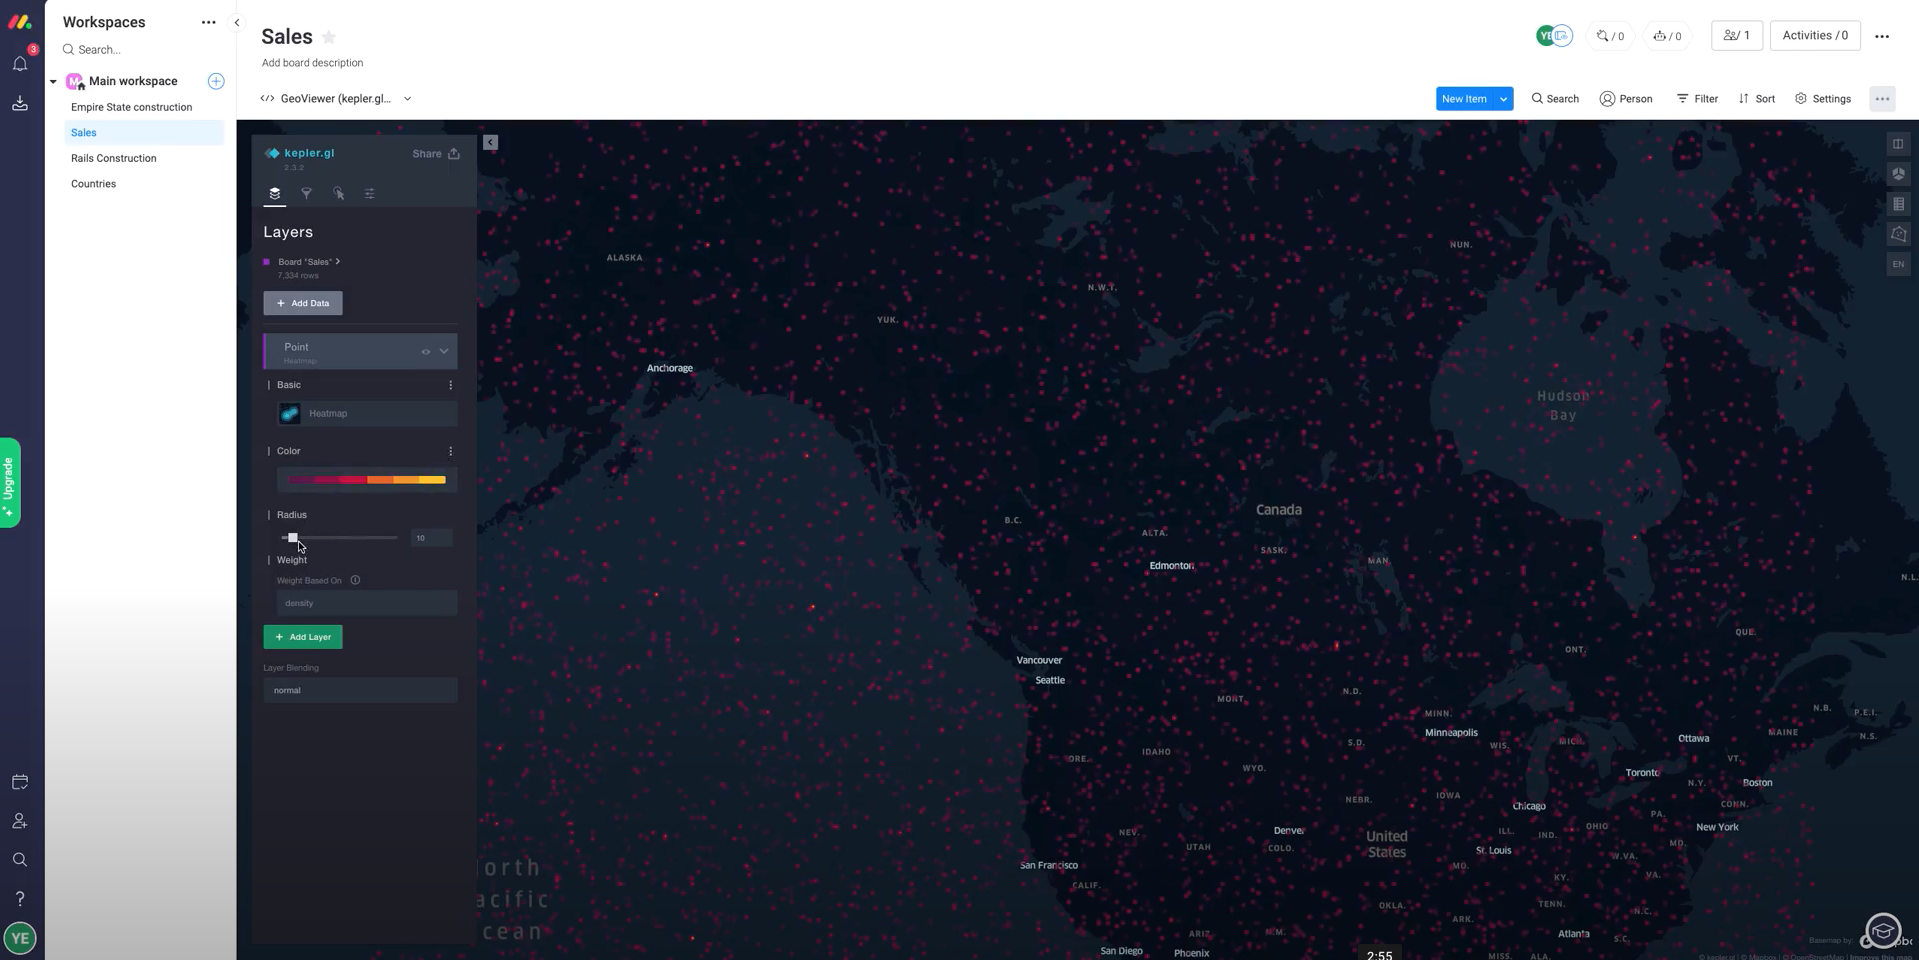
Heatmap of locations
-

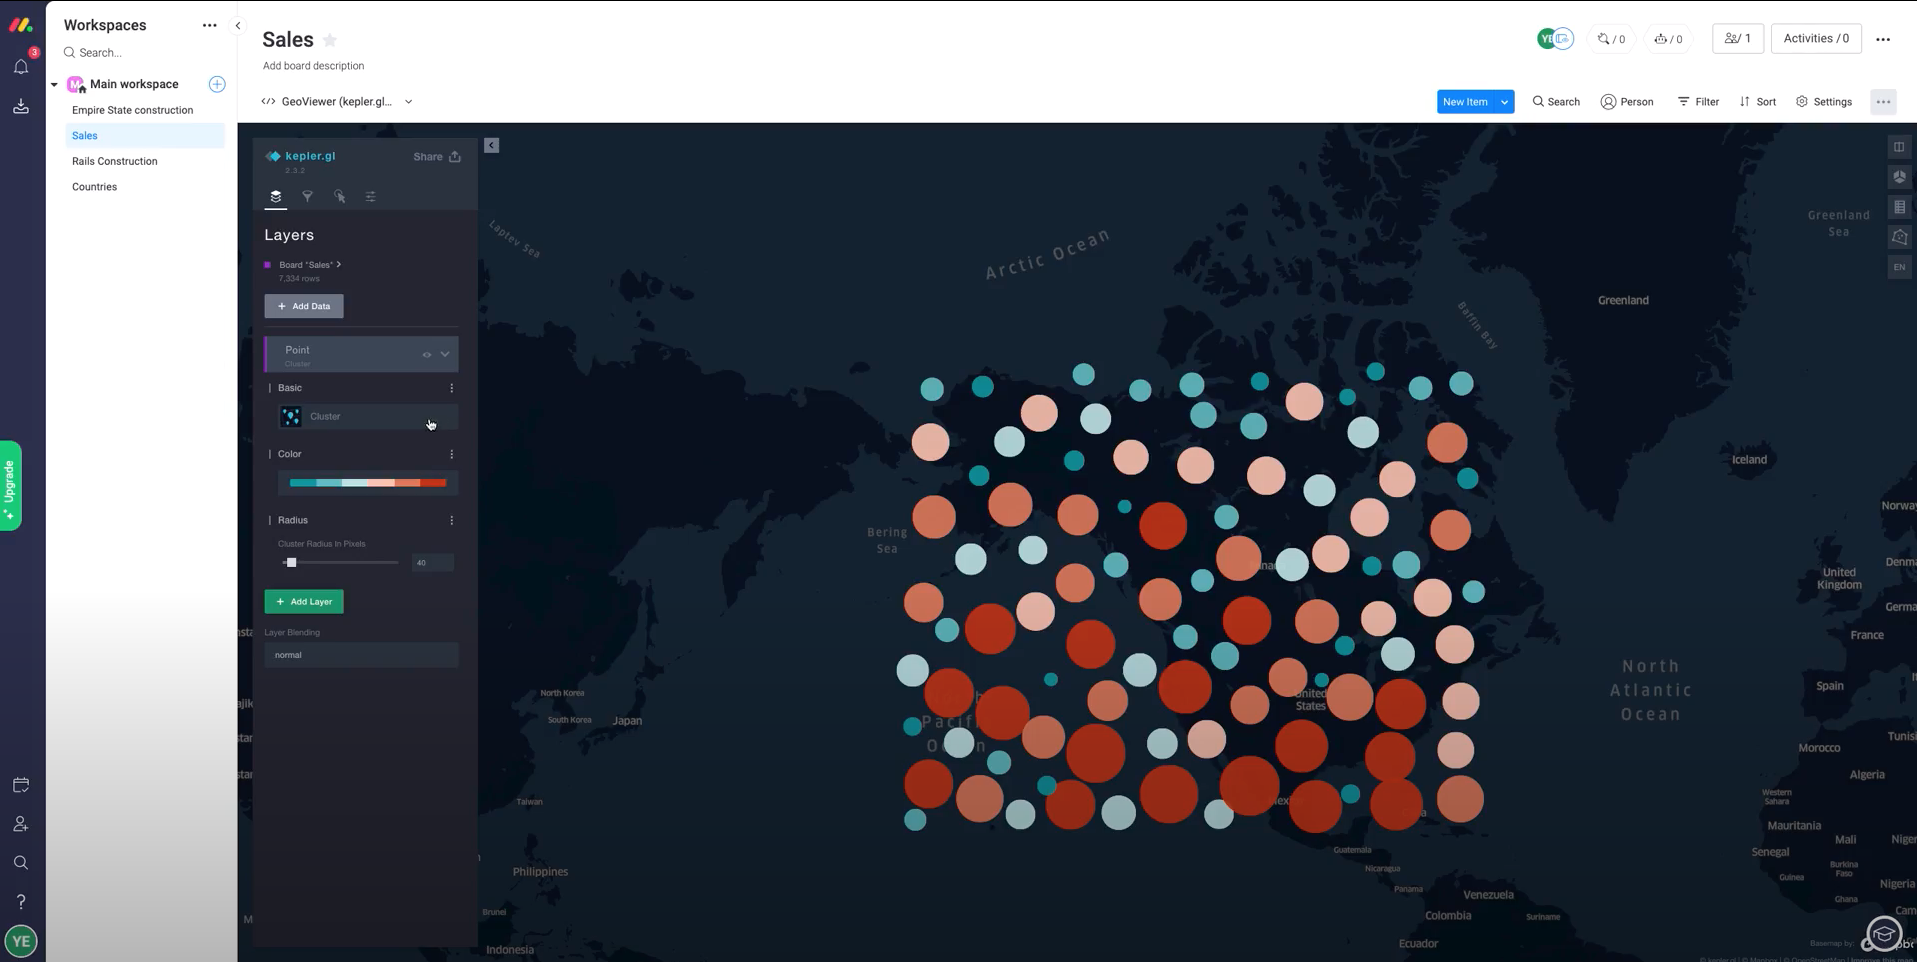
Clustering
-
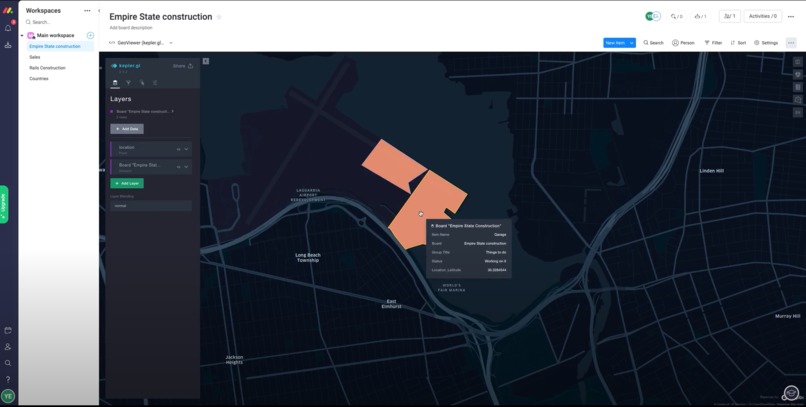
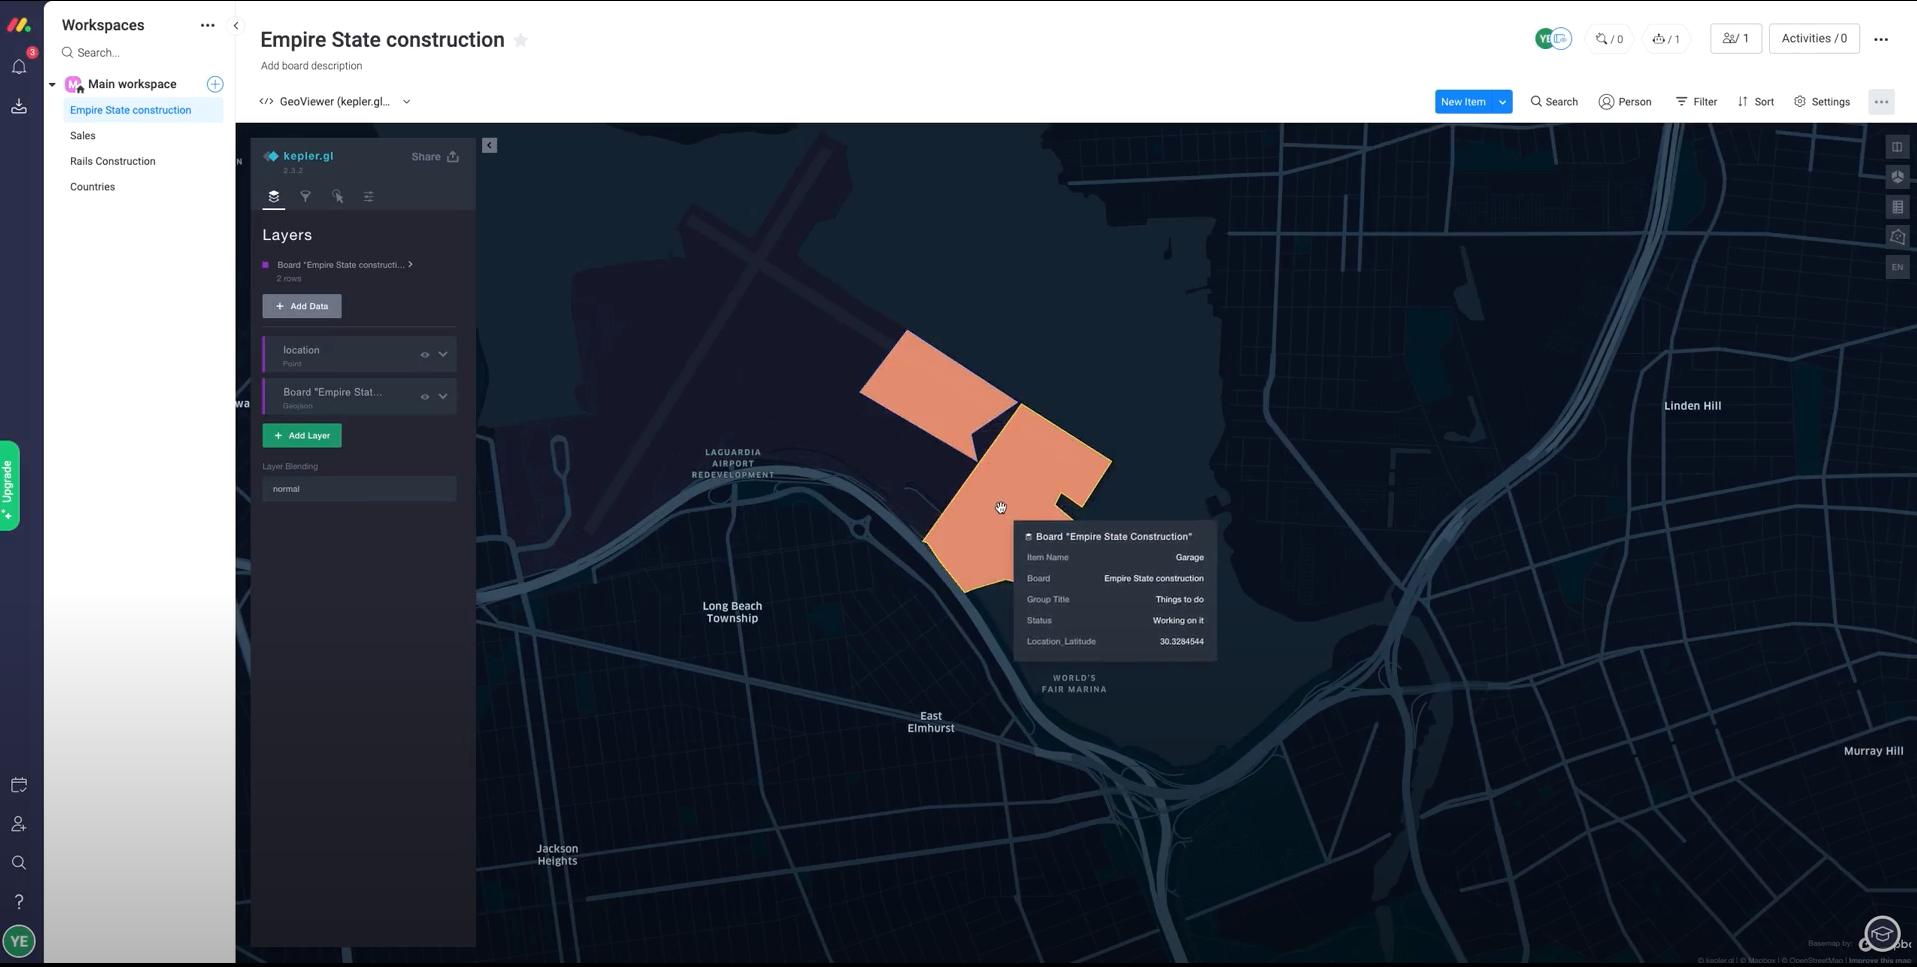
Construction site
Inspiration
Constructions site use geographical data a lot. Currently, there isn't an app in Monday marketplace that allow consumer to visualize their geographical data as THEY want to see it.
What it does
The tool allow you to visualize your board item data as you wanna see it. It's highly scalable and robust, allowing you to display thousands of locations simultaneously.
Some key features:
Support many shapes besides Point (e.g Polygon, Polyline, Circle etc). This is really useful for construction site cause now they can create a ticket for each "section" on the ground and can down the progress of all the items at once. Use cases:
Color the points by ANY(!!) other column. e.g "Display all the locations on the map and Color them from green to red by the price value"
Clustering (useful for boards with many locations)
Filtering (filter the data by any condition)
Share the map as an Image(!)
How I built it
I built it using Nodejs and React, I've used an open source library for the geographical visualisation (kipler.gl) and integrated it within Monday
Challenges I ran into
graphQL issues, some information is missing from the documentation.
Accomplishments that I'm proud of
I made a really cool product for Monday marketplace
What I learned
How to build apps for Monday.
What's next for GeoVisualizer
Next phase -> create and edit item within the viewer, persist the setting changes
https://drive.google.com/file/d/1YZ7McAyo-XndoNoGP6SxC3R2Qz0FIQAm/view


Log in or sign up for Devpost to join the conversation.