-

View focused on a specific news article
-

Default view
-

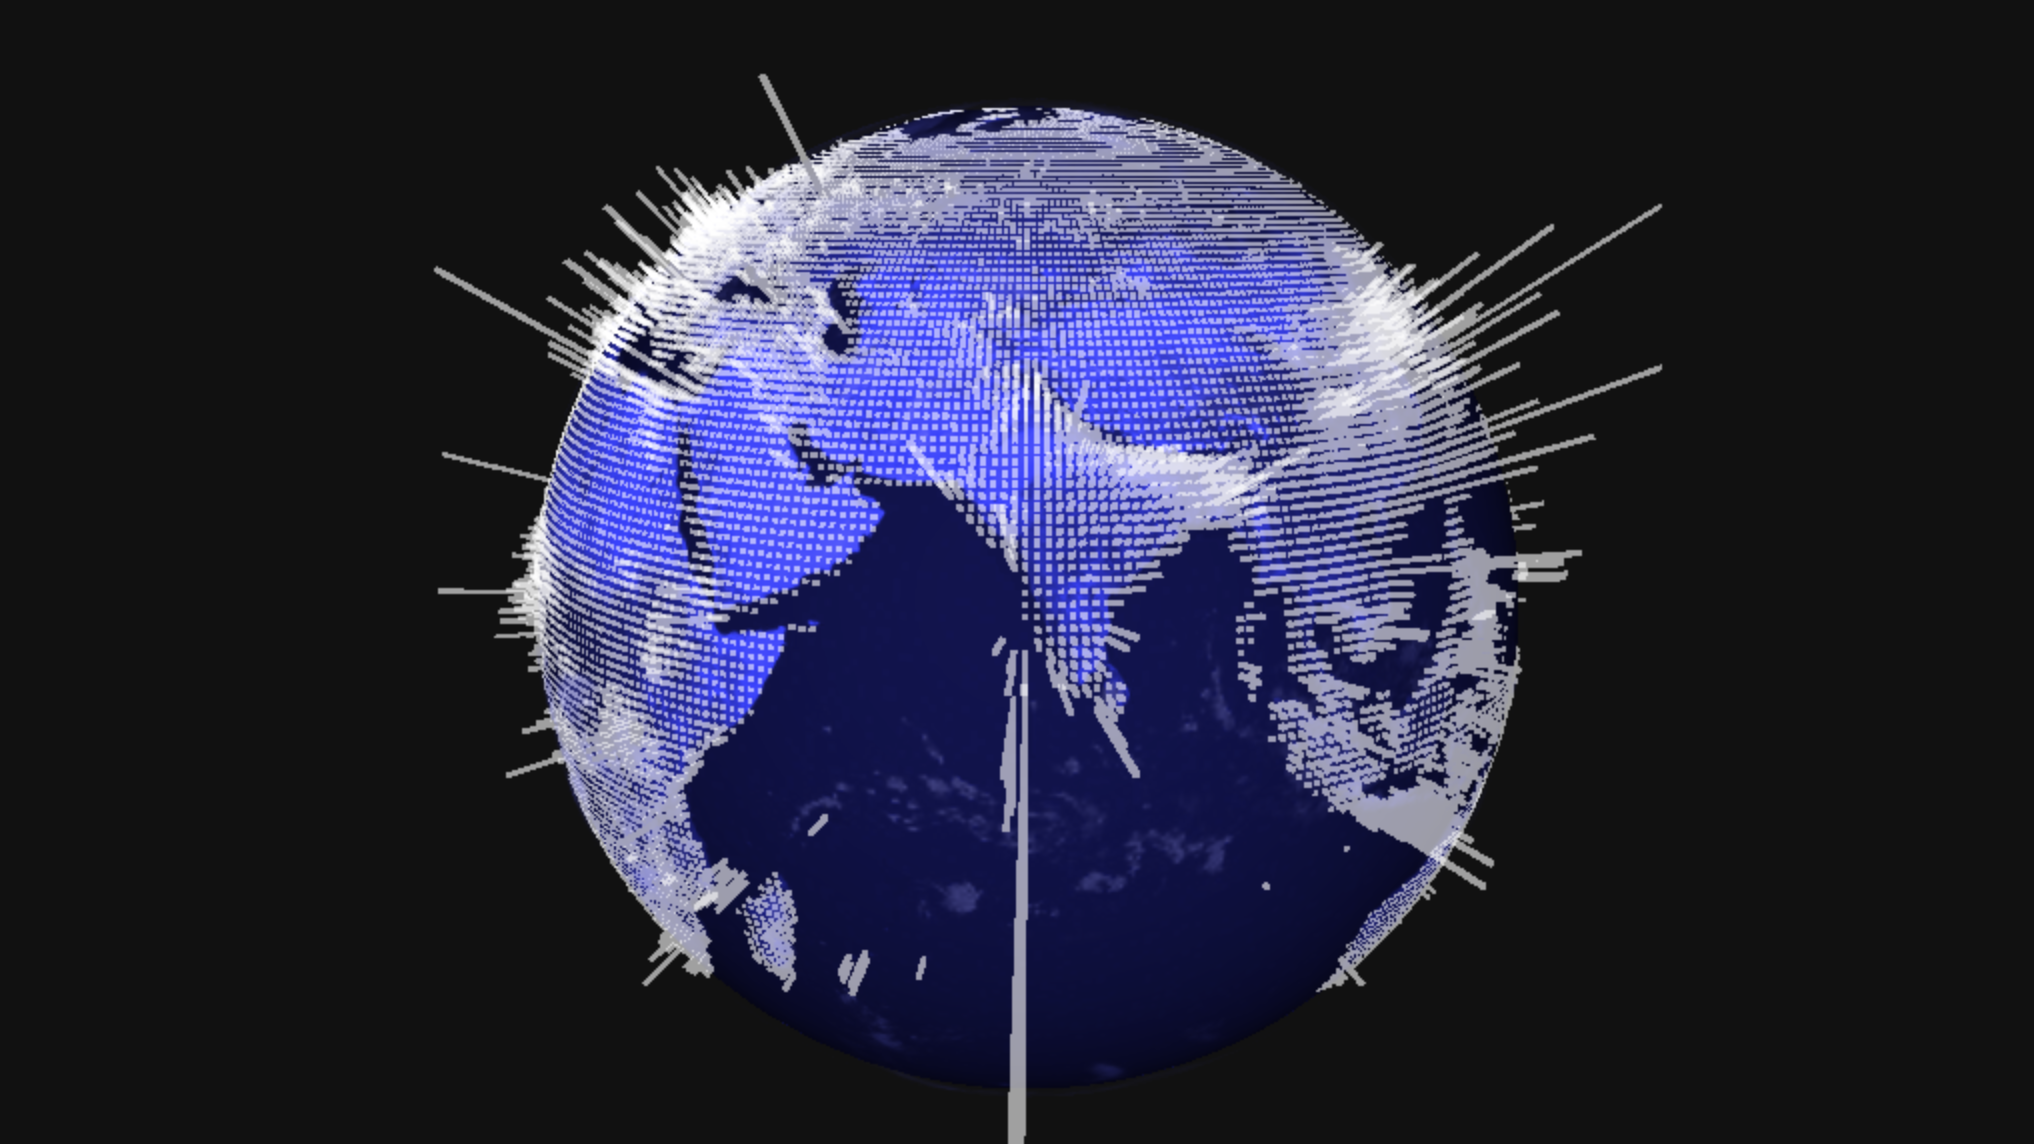
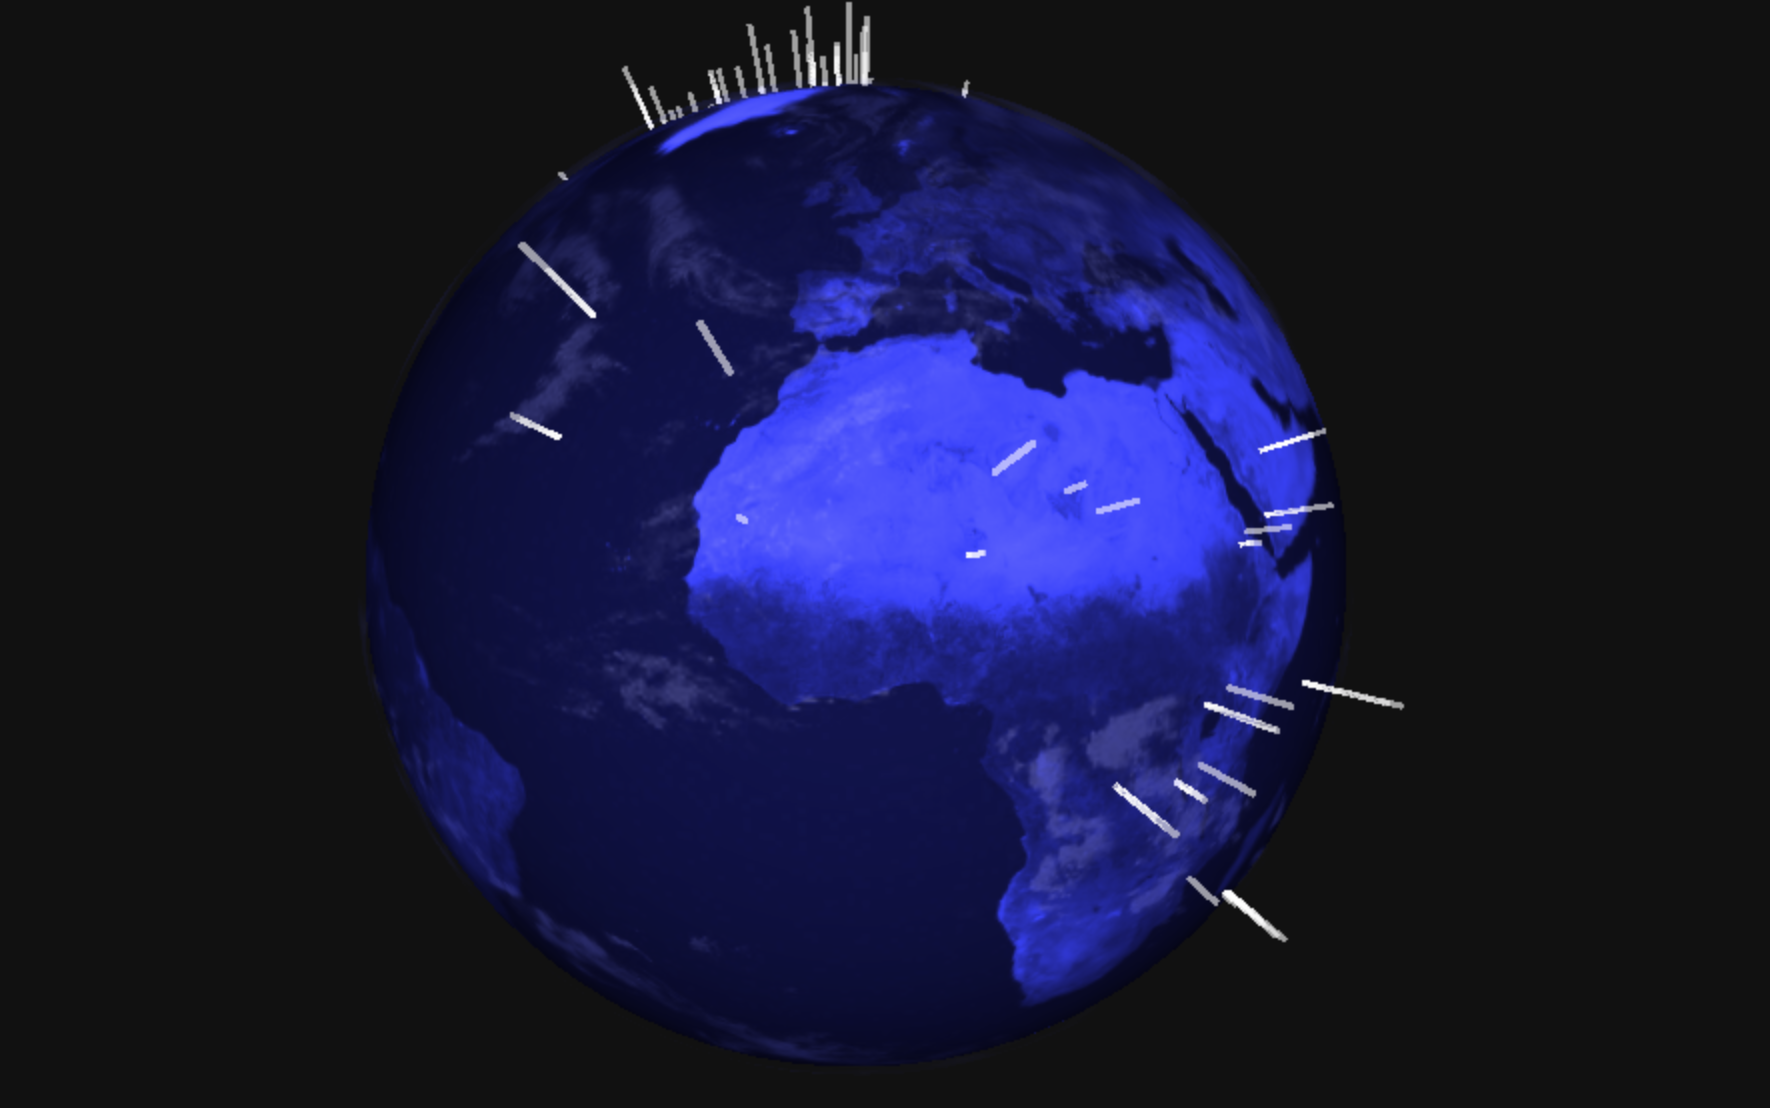
3D sentiment view
-

3D sentiment view when you run out of api calls


Inspiration
With the recent elections, we found it hard to keep up with news outside of the states, and hear of people's perspectives on a global scale. We wanted to make it easier to see and read of news all across the world, to bring a bird-eye's-view on our local problems and our local popular opinions. Geovibes was built to inform.
What it does
Geovibes is a news feed infograph, displaying news articles from all across the world on an interactive map in real time. We've included pictures of our previous version, from which we pivoted about 7 hours ago. We were attempting to build a 3D interactive globe displaying the same news as the current iteration of Geovibes does.
How we built it
Frontend
- amchart (https://www.amcharts.com/)
- lots of handcrafted javascript
- lots of handcrafted css
- mapping coordinates to png
- REST requests to flask api
Backend
- flask api server
- threads and file lock
Data pipeline
- lots of quota exceeding api subcriptions
- lots of batch processing
- mapping coordinates to locations
- piping one api's results to the next (Bing News Search, Microsoft Text Analytics)
Challenges we ran from
Things we pivoted from
- angular 2
- three.js
- web gl
- twgl (thin wrapper for web gl)
- kartograph.js
- d3.js
- coordinate mapping, especially from window cursor location to 3D globe coordinates within an HTML canvas
- an overambitious idea for an unprepared team
Accomplishments that I'm proud of
Everything
What I learned
- batch processing
- concurrency and thread communication
- web gl stuff, and three.js, and the struggles
- coordinate mapping, especially from window cursor location to 3D globe coordinates within an HTML canvas
- angular 2
What's next for geovibes
get the fkin three.js version working


Log in or sign up for Devpost to join the conversation.