🚀 GeoTaste: The Journey of Building an AI-Powered Business Intelligence Platform
💡 The Inspiration
The idea for GeoTaste was born from a simple yet powerful question: "What if we could instantly understand any location's business environment using AI and real-time data?"
As someone passionate about both business intelligence and emerging technologies, I wanted to create a tool that could bridge the gap between raw location data and actionable business insights. The concept of an "agentic" consultant that could autonomously analyze markets fascinated me - imagine having a business advisor that never sleeps and has access to global data!
🎯 The Vision
I envisioned a platform that would:
- 🌍 Analyze any location globally using real-time business data
- 🤖 Provide AI-powered insights that rival human business consultants
- 📊 Create beautiful visualizations that make complex data understandable
- ⚡ Deliver instant results without the weeks of traditional market research
🛠️ How I Built It
Phase 1: Foundation & Architecture 🏗️
I started by designing a modern full-stack architecture:
- Frontend: React 19 with Vite for lightning-fast development
- Backend: Python Flask for robust API handling
- Database: Real-time data from Qloo's global business database
- AI Integration: OpenAI's GPT-4 for intelligent analysis
Phase 2: Core Features Development ⚙️
The development process was iterative and exciting:
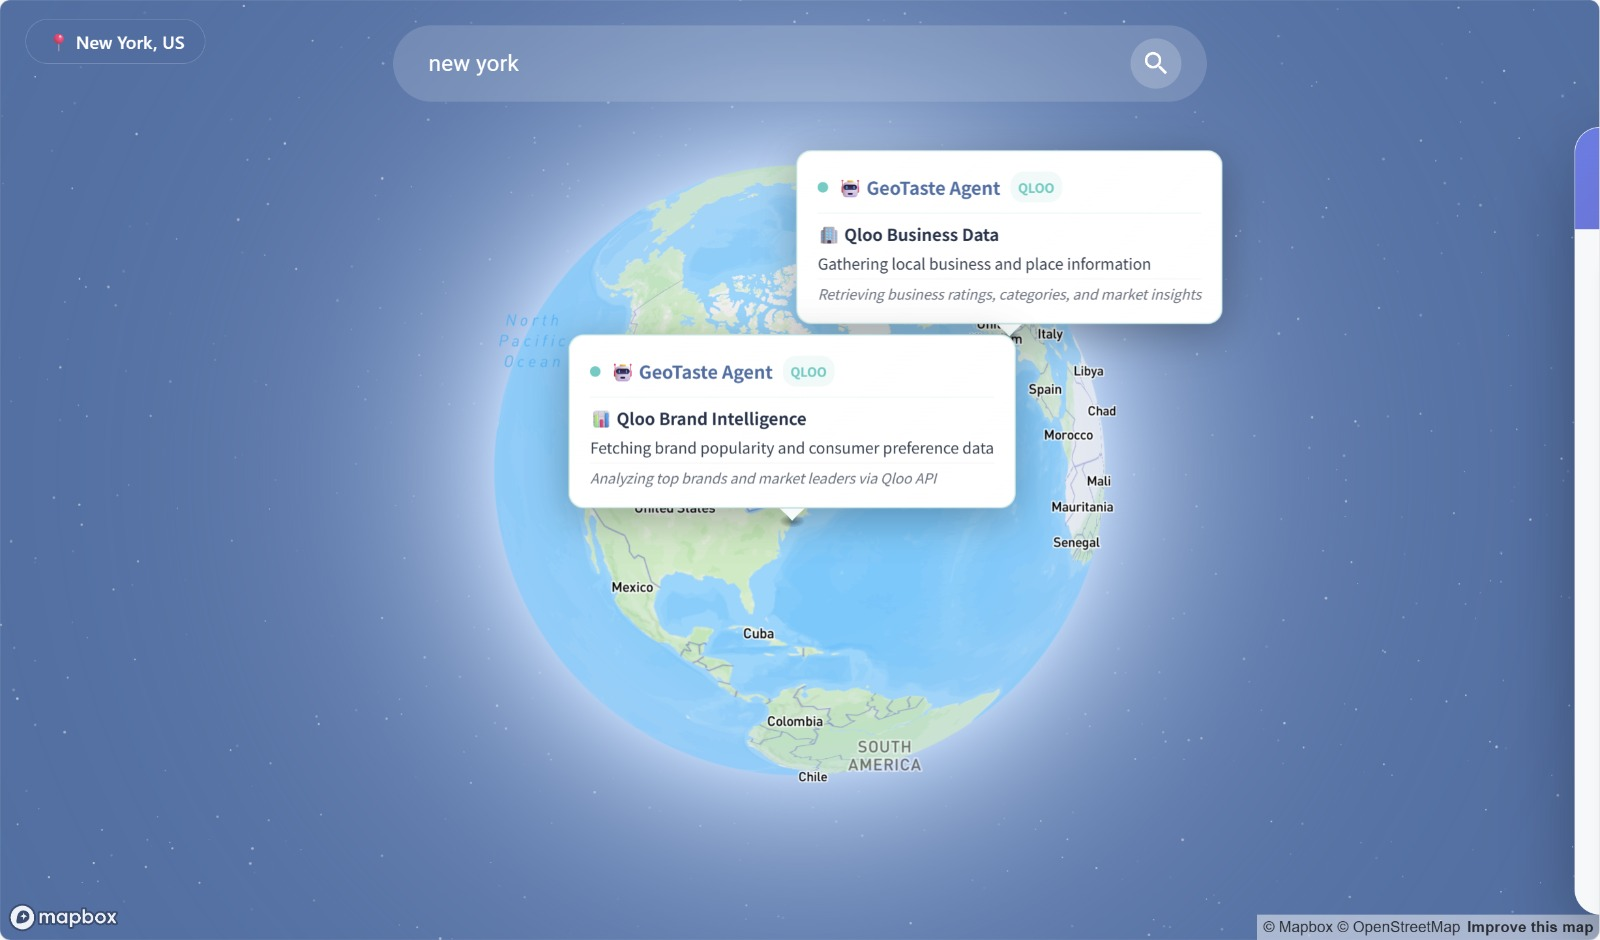
Interactive Map Interface 🗺️
- Integrated Mapbox GL JS for smooth, responsive mapping
- Implemented real-time location search with geocoding
- Created custom popups with business insights
Data Visualization Engine 📈
- Built 13+ different chart types using Plotly.js
- Implemented dynamic chart generation based on location data
- Created responsive, interactive visualizations
AI Analysis System 🧠
- Integrated OpenAI's latest API for intelligent business analysis
- Developed structured prompts for consistent, professional insights
- Created a chat interface for interactive business consulting
Phase 3: User Experience & Polish ✨
- Modern UI Design: Implemented glassmorphism design with Material-UI
- Responsive Layout: Ensured perfect functionality on all devices
- Performance Optimization: Optimized for fast loading and smooth interactions
🎓 What I Learned
Technical Skills 💻
- Advanced React Patterns: Mastered React 19's latest features and hooks
- API Integration: Learned to work with multiple external APIs (Qloo, OpenAI, Mapbox)
- Data Visualization: Gained expertise in Plotly.js and chart optimization
- Deployment: Mastered cloud deployment with Railway and production optimization
Business Intelligence 📊
- Market Analysis: Deepened understanding of business environment factors
- Data Processing: Learned to transform raw data into meaningful insights
- User Experience: Developed empathy for business users' needs and workflows
Problem-Solving 🧩
- API Challenges: Learned to handle rate limits, authentication, and error handling
- Performance Optimization: Discovered techniques for fast, responsive applications
- Cross-Platform Compatibility: Ensured consistent experience across devices
🚧 Challenges I Faced
1. Plotly.js Loading Issues 📊
The Problem: Plotly.js was failing to load in production builds with cryptic errors like "Cannot read properties of undefined (reading 'prototype')".
The Solution: Implemented a robust CDN fallback system with retry mechanisms and better error handling. This taught me the importance of graceful degradation and user feedback.
2. OpenAI API Integration 🤖
The Problem: The OpenAI API structure changed from client.chat.completions.create() to client.responses.create(), causing integration failures.
The Solution: Updated to the latest API version and implemented proper environment variable handling for production deployment.
3. Deployment Complexity ☁️
The Problem: Initial deployment attempts failed due to build issues, missing dependencies, and configuration problems.
The Solution:
- Switched from Render to Railway for better reliability
- Created comprehensive deployment documentation
- Implemented proper environment variable management
- Added health checks and monitoring
4. Real-time Data Synchronization ⚡
The Problem: Ensuring consistent data flow between frontend and backend while maintaining performance.
The Solution: Implemented efficient API caching, proper error handling, and loading states for optimal user experience.
🌟 Key Achievements
Technical Milestones 🏆
- ✅ Full-Stack Development: Successfully built a complete web application
- ✅ AI Integration: Seamlessly integrated multiple AI services
- ✅ Real-time Data: Implemented live data fetching and processing
- ✅ Production Deployment: Successfully deployed to Railway with full functionality
User Experience 👤
- ✅ Professional Interface: Created a business-ready, intuitive UI
- ✅ Responsive Design: Ensured perfect functionality across all devices
- ✅ Fast Performance: Optimized for quick loading and smooth interactions
Business Value 💼
- ✅ Comprehensive Analysis: Provides 13+ different types of business insights
- ✅ Global Coverage: Works with any location worldwide
- ✅ Instant Results: Delivers insights in seconds, not weeks
🔮 The Future Vision
GeoTaste represents just the beginning of what's possible with AI-powered business intelligence. I envision:
- Advanced Analytics: Machine learning models for predictive market analysis
- Multi-language Support: Global accessibility for international markets
- Enterprise Features: Team collaboration and advanced reporting
- Mobile App: Native mobile experience for on-the-go insights
🙏 Gratitude
This project wouldn't have been possible without:
- Qloo for providing comprehensive global business data
- OpenAI for making AI accessible and powerful
- Mapbox for reliable mapping and geocoding services
- Railway for seamless deployment and hosting
- The React and Python communities for amazing tools and documentation
GeoTaste is more than just a project - it's a testament to the power of combining cutting-edge technology with real business needs. Every challenge overcome and every feature built has been a learning experience that pushes the boundaries of what's possible in business intelligence. 🚀✨


Log in or sign up for Devpost to join the conversation.