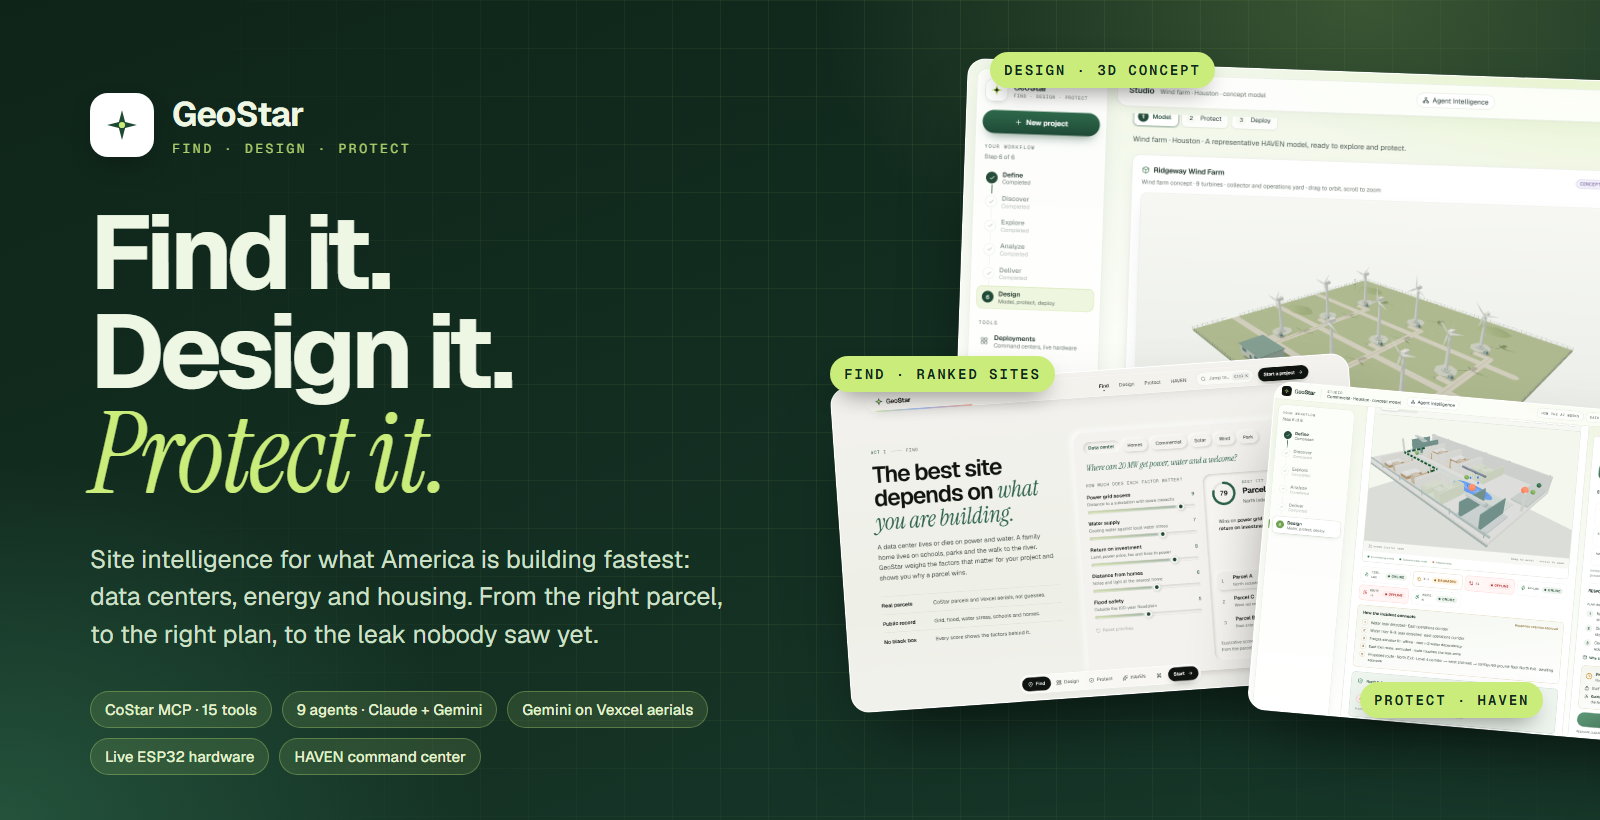
GeoStar
Find it. Design it. Protect it. GeoStar is site intelligence for what America is building fastest: data centers, energy and housing. It finds the right parcel, designs what goes on it, and watches over the building once it is running, with live hardware on the bench to prove it.
Built at HackPrinceton Fall 2026.
Built with: Next.js · React · TypeScript · three.js · FastAPI · Python · LangChain Deep Agents · LangGraph · LangSmith · Anthropic Claude · Google Gemini · CoStar · Vexcel · Matterport · MongoDB Atlas · Neon Postgres · Clerk · ElevenLabs · Cartesia · ChatOverflow · ESP32 · Arduino UNO R4 · Tello · SwiftUI · Vercel
Inspiration
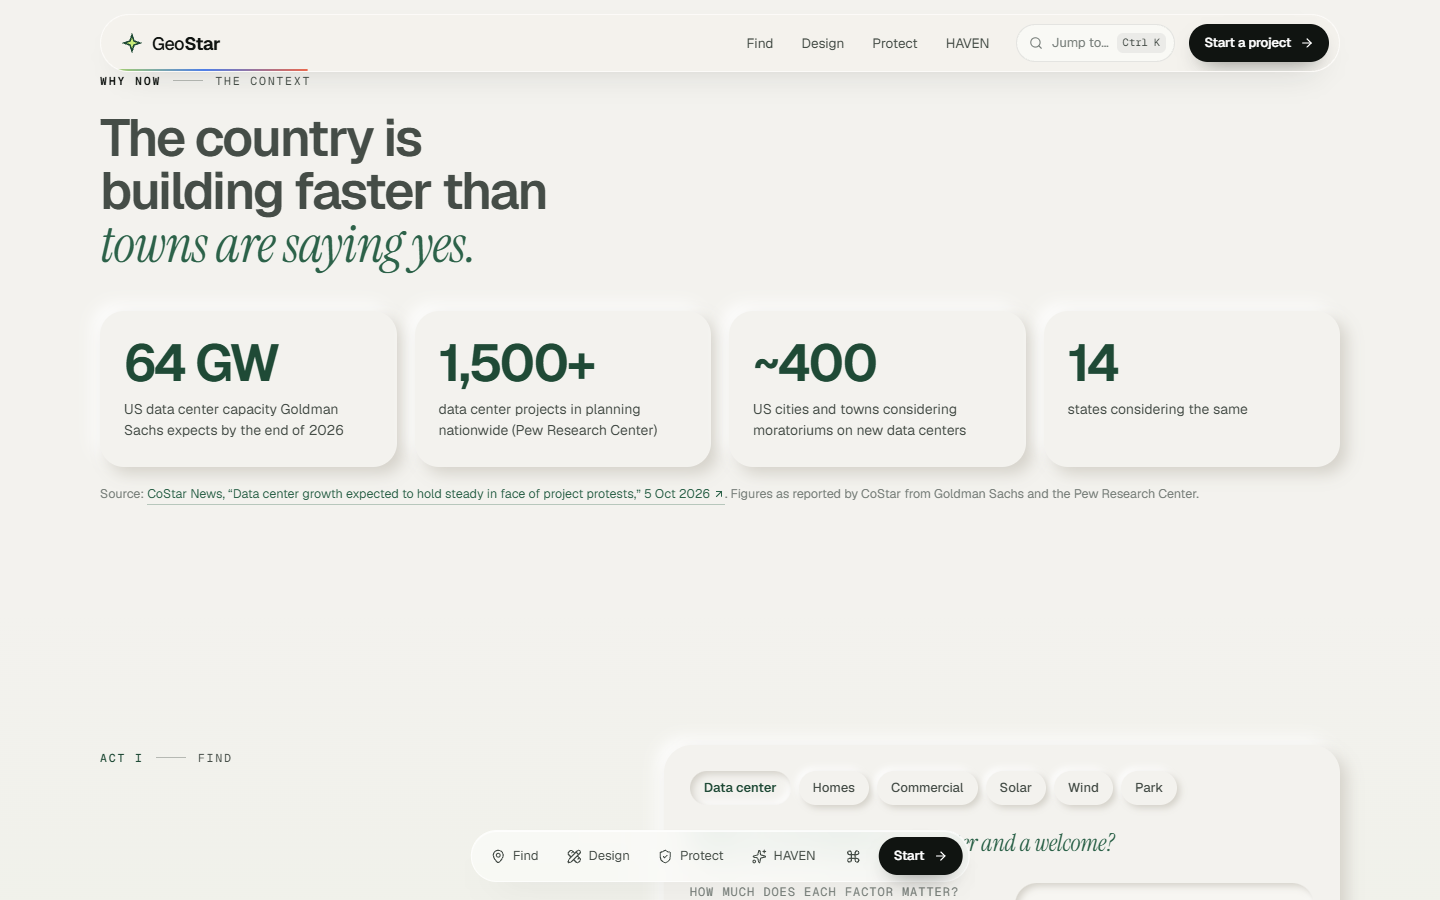
The country is building faster than towns are saying yes.
- 64 GW of US data center capacity is expected by the end of 2026 (Goldman Sachs, as reported by CoStar News).
- 1,500+ data center projects are in planning nationwide (Pew Research Center).
- About 400 cities and towns in 14 states are considering moratoriums on new ones.
- ERCOT is tracking more than 438 GW of large-load requests, nearly 89% of them data centers.
Projects get blocked when they land in the wrong place: too close to homes, in a floodplain, on a stressed aquifer, or years from a grid connection. And once a building is up, the most expensive damage starts quietly. A coolant line weeps under a raised floor. A connection heats up behind a panel. Nobody sees it until it's a fire or a flood.
Today those are three jobs done with three tools by three teams. We wanted one product that follows a building through its whole life.
What it does
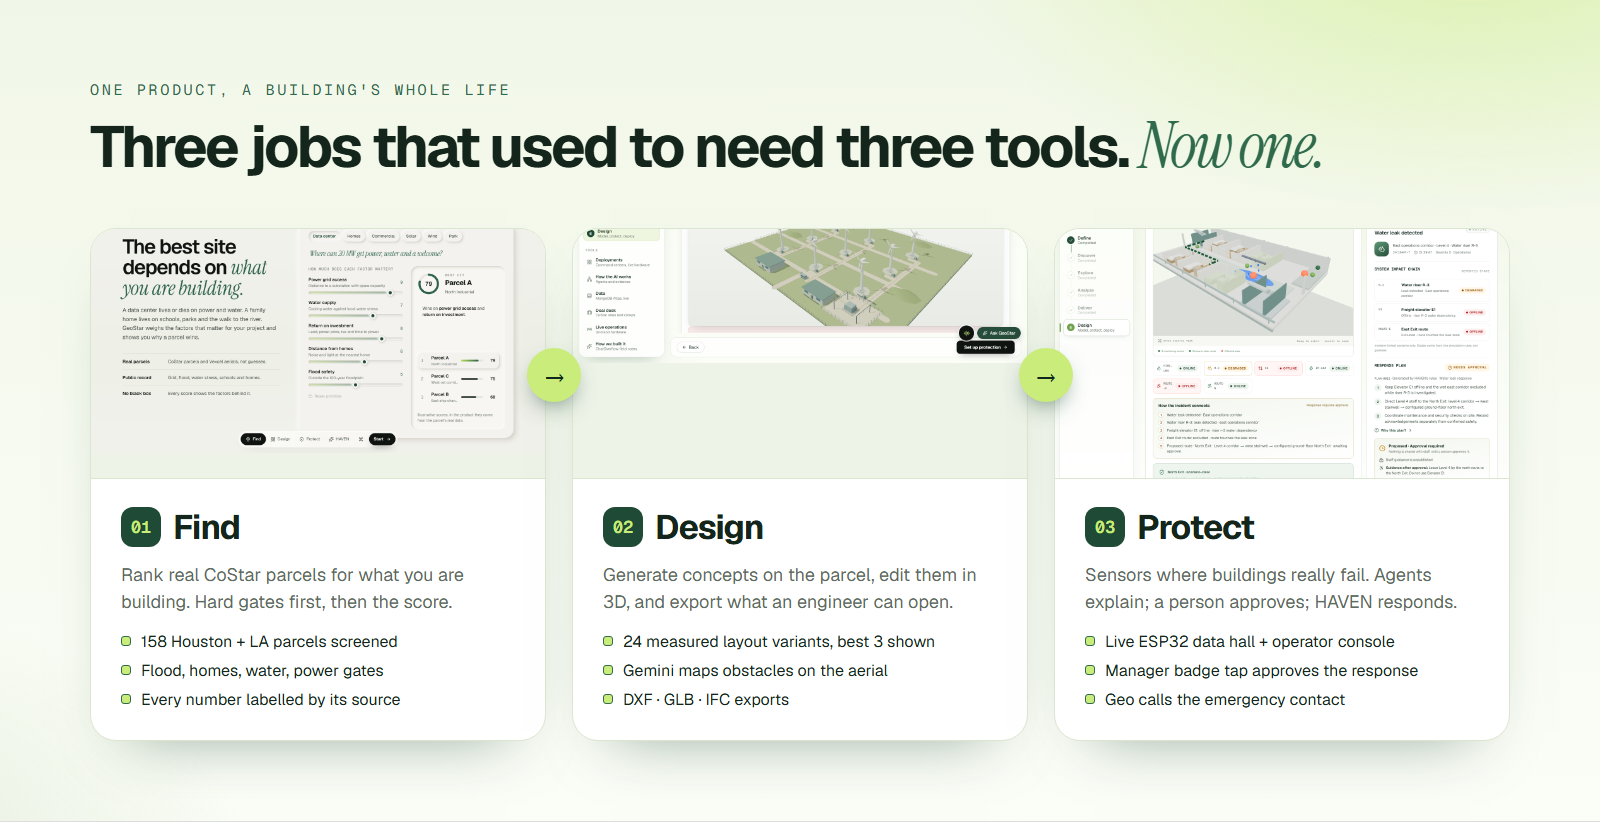
GeoStar runs on one rule: models explain, code computes. Agents decide what to look at and say what it means. Every score, cost and gate comes from a deterministic function, and every number is labelled Measured, Sourced, Estimated, Simulated or Unknown.
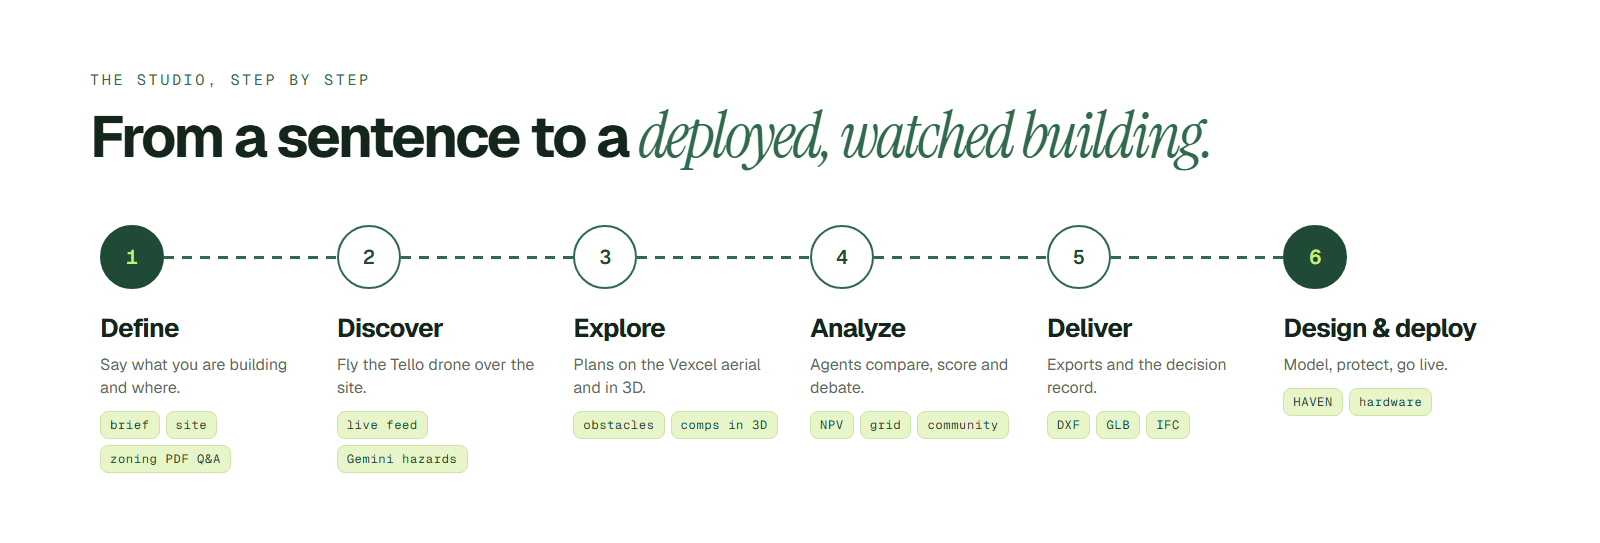
🟢 The Studio: one place for the whole project
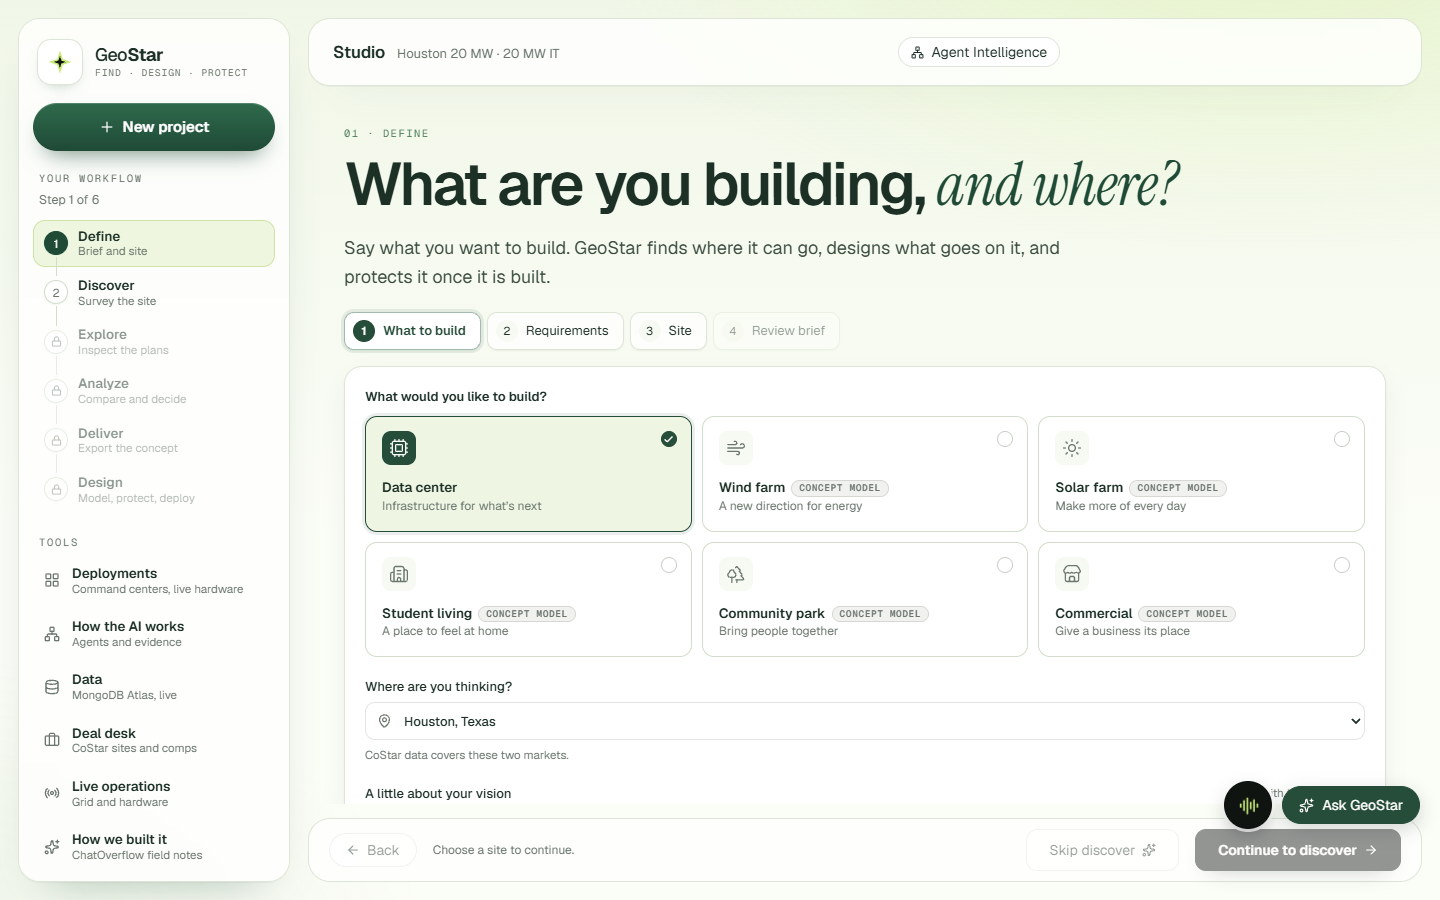
Start by saying what you want to build and where. A floating sidebar walks you through six steps, and the tools you need (deployments, agents, data, the CoStar deal desk, live operations) stay one click away.
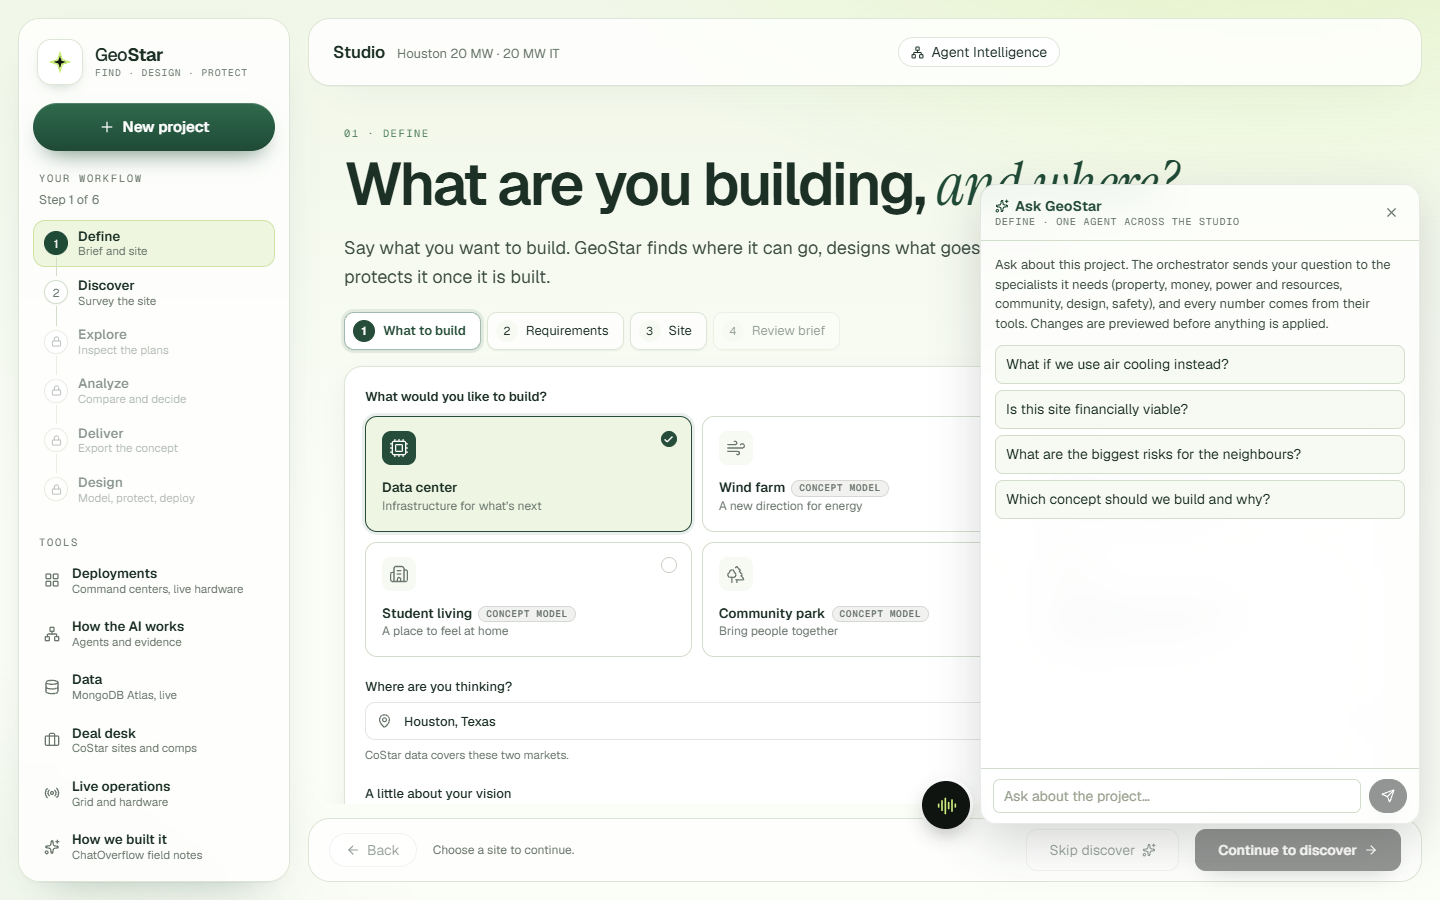
Ask GeoStar is one agent for the whole Studio. Each question goes to the orchestrator with the live project state (stage, site, brief, active concept, selected object). It brings in only the specialists the question needs, and any change comes back as a preview you approve.
Hey Geo is an on-screen voice assistant. Say "Hey Geo" or press Alt+G. Geo reads the page, answers out loud (Cartesia voice, Claude reasoning), points at things and circles them, sketches on a whiteboard, draws the evacuation plan from the live protection state, and runs GeoStar tasks once you allow them.
📍 1. Find the right place
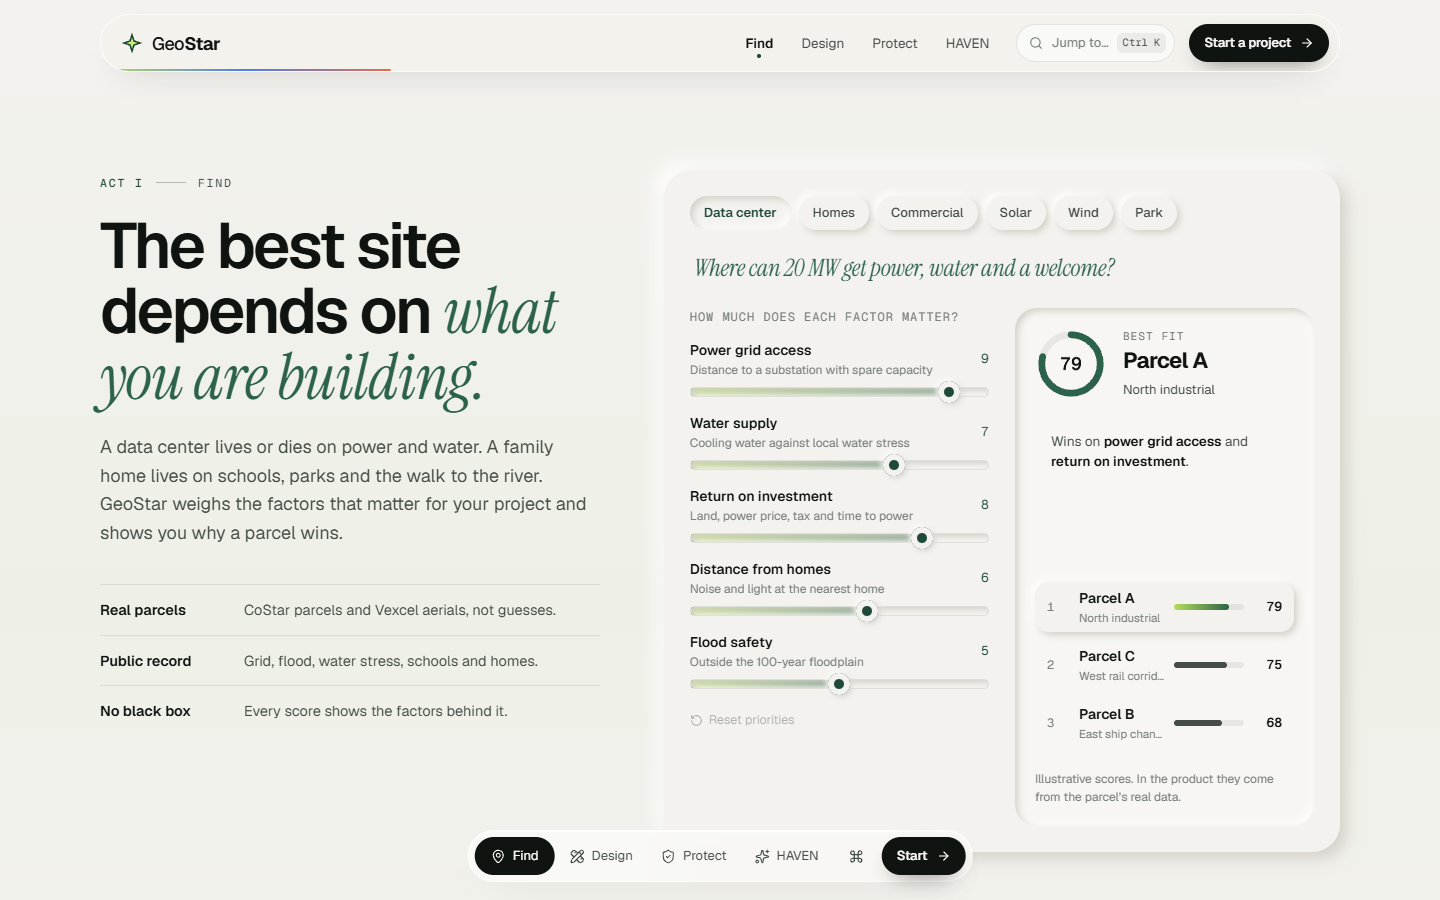
The best site depends on what you are building. A data center lives or dies on power and water. A family home depends on schools, parks and the walk to the river. GeoStar weighs the factors that matter for your project and shows why a parcel wins.
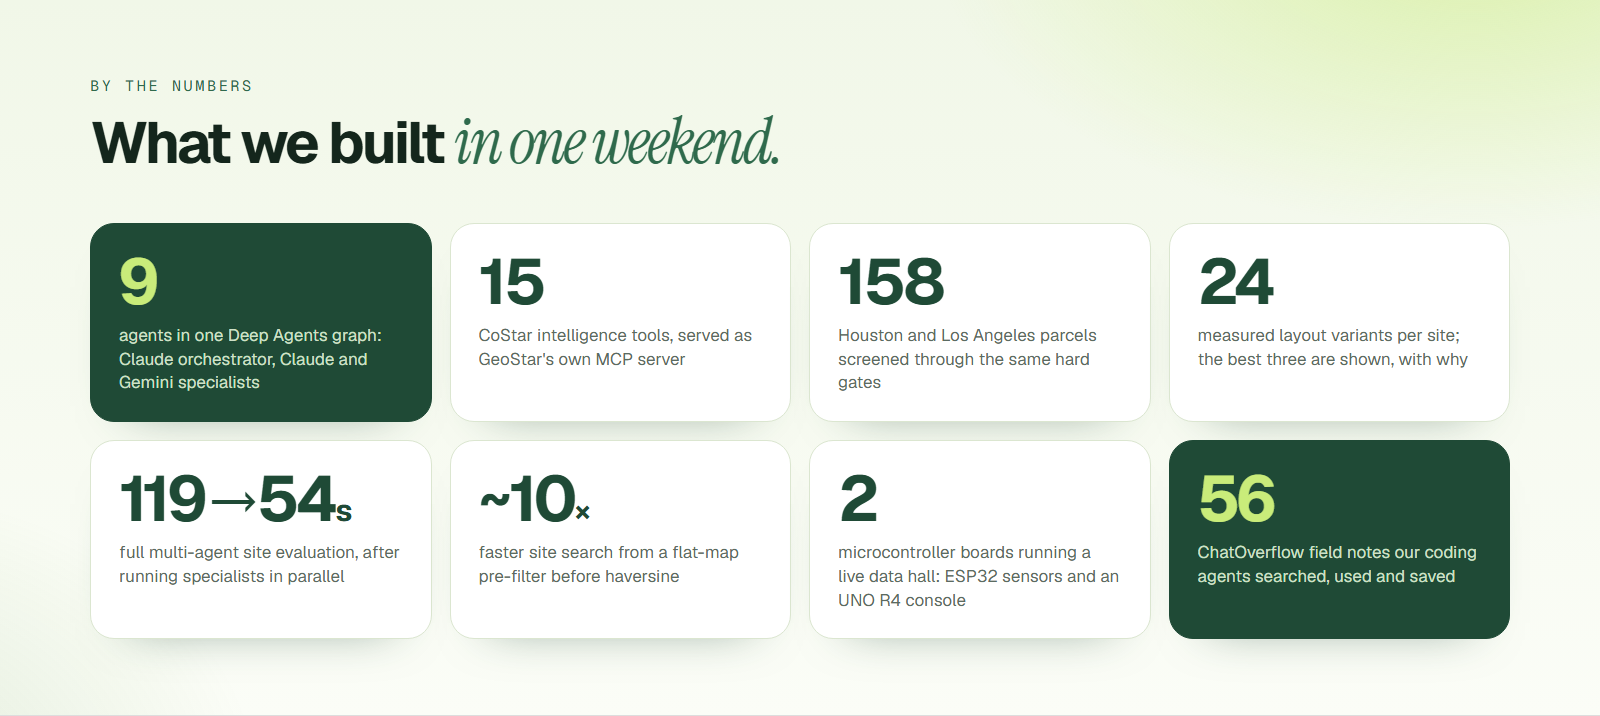
For data centers, GeoStar screens 158 real CoStar parcels in Houston and Los Angeles, and every one has to pass four hard gates before it gets a score:
- Flood: fails in FEMA zones A or V (FEMA National Flood Hazard Layer)
- Homes: fails too close to a residential area (CoStar apartments, MLS listings, OpenStreetMap)
- Water: WRI Aqueduct water stress
- Power: distance to a 138 kV or larger substation (OpenStreetMap)
A site that fails a gate is "Not suitable" however cheap it is. Hard-gate status ranks ahead of any score. "Find" also runs Deal-to-Design on the top candidates: acquisition, NPV, an investment memo and the full tool-call log land on each row.
CoStar in 3D, with citations. Nearby CoStar properties appear as blocks around the site, coloured by asking rent or availability. Every CoStar figure in an agent's answer is tied back to its record id and field and shows up as a clickable chip that opens the dossier. The model never sees the fields it cites.
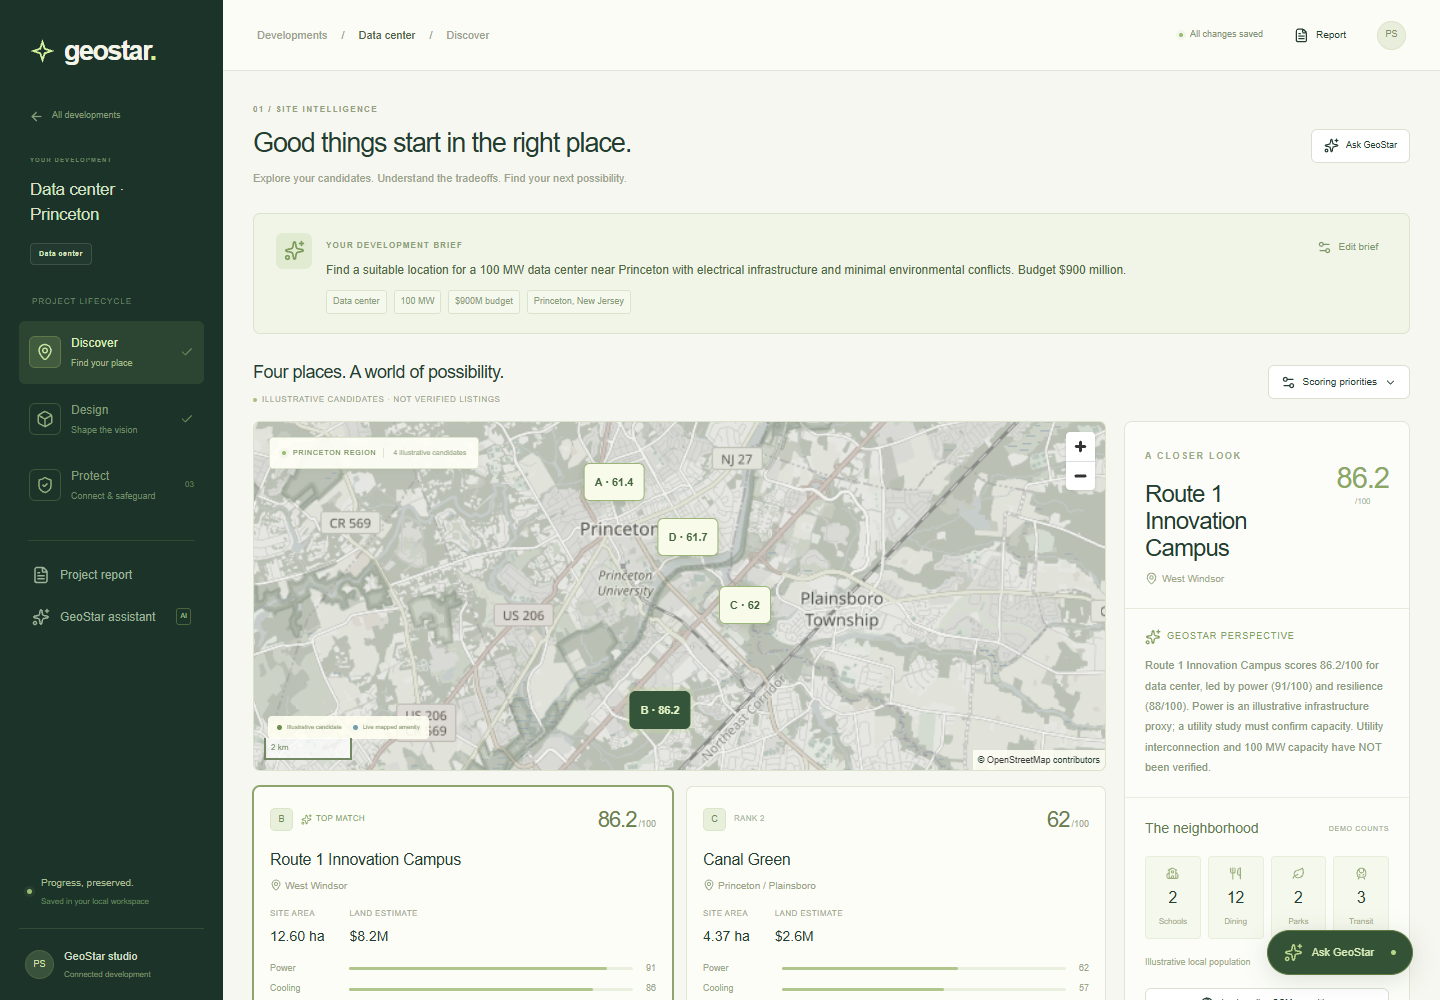
The original workspace screens other project types the same way, using real OpenStreetMap tiles and on-demand amenity lookups:
📐 2. Design what goes on it
A layout engine that measures everything. For a data center, GeoStar builds every hall arrangement in both orientations, with the outdoor plant on each side: 24 variants, each fully measured. It shows three: the best overall for your priorities, plus the best on your top priorities, each a different arrangement and each with a "why" that quotes the real numbers.
Gemini reads the aerial. GeoStar pulls the Vexcel orthophoto (7 cm resolution) for the site and asks Gemini to box buildings, trees, water, parking and roads as structured JSON. The boxes become keep-out areas, the engine places around them, and a required check reports them. You decide which boxes to keep.
Vexcel, more than a picture. You can compare captures from different years with a then/now slider, view obliques from four directions, and see neighbour heights measured as surface minus bare earth (DSM − DTM), labelled Measured.
A real design editor. You can add, move, resize, rotate or delete objects from an asset library, with undo. AI proposes objects (Gemini structured output, with Claude as the fallback). An inspector shows each element's sources, Compare Systems sets cooling and power options side by side, and Deliver exports DXF, GLB, IFC and the decision record.
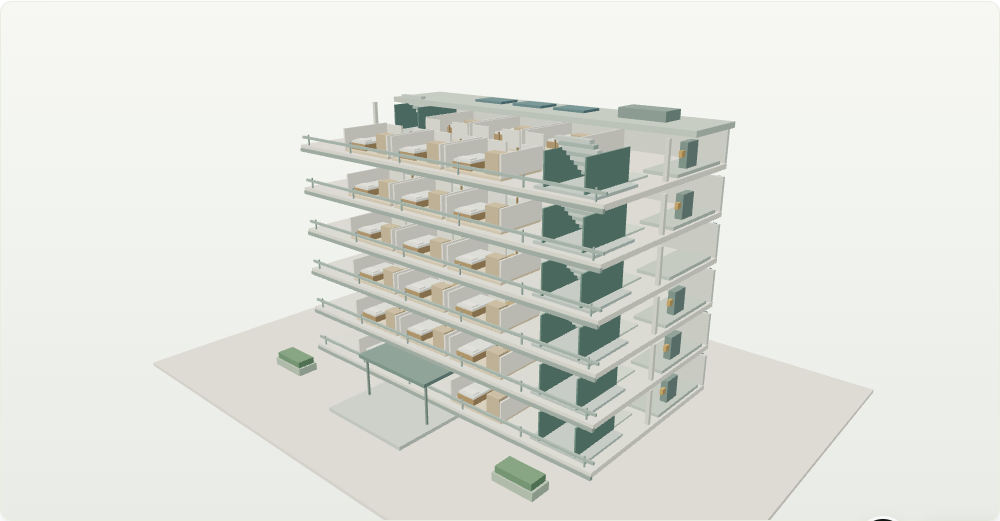
Other project types open an orbitable 3D concept model:
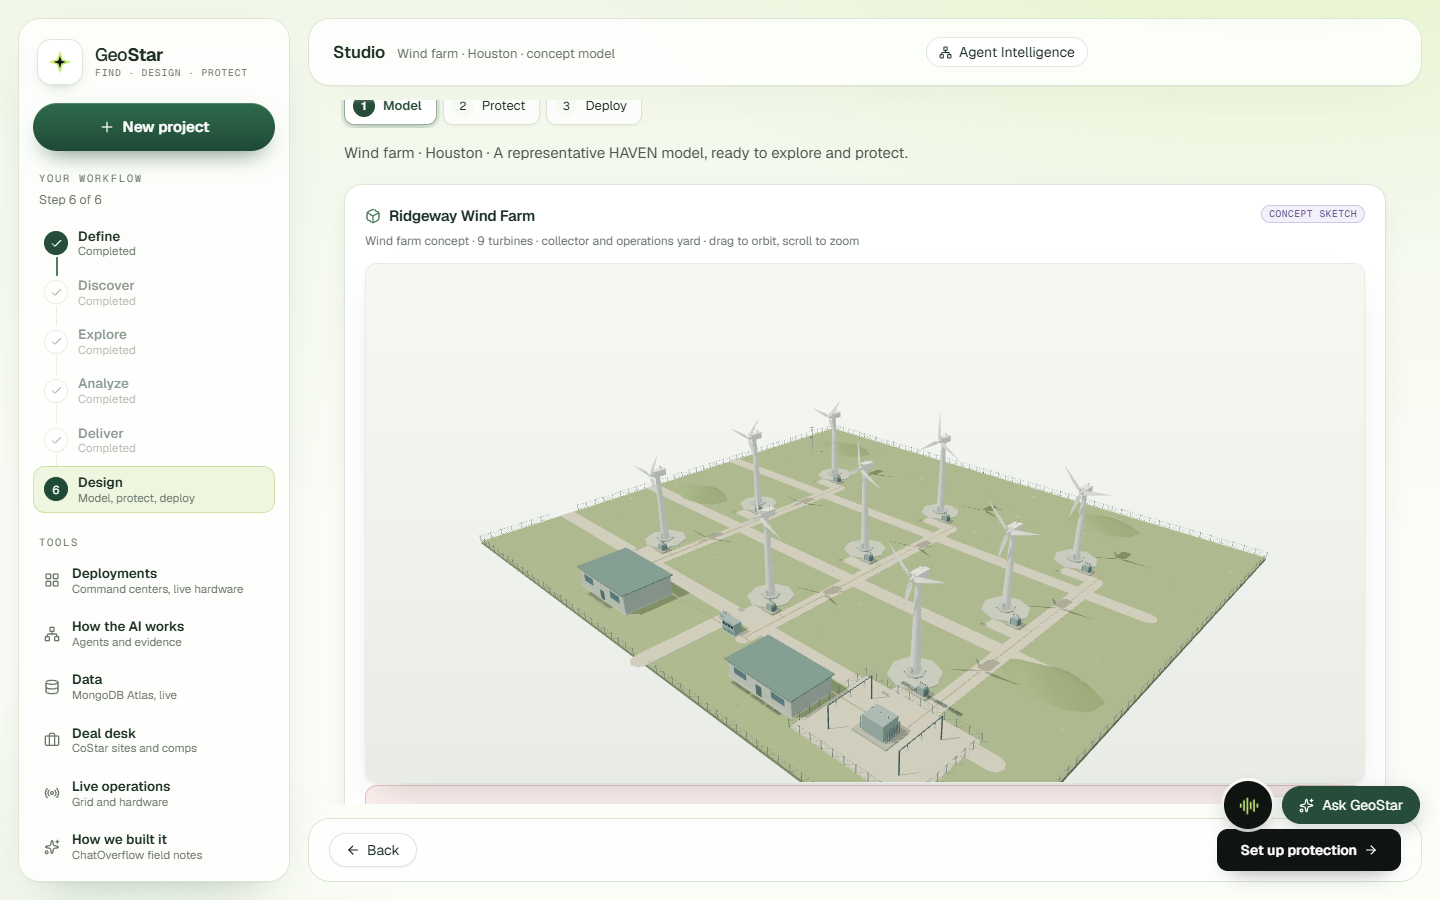
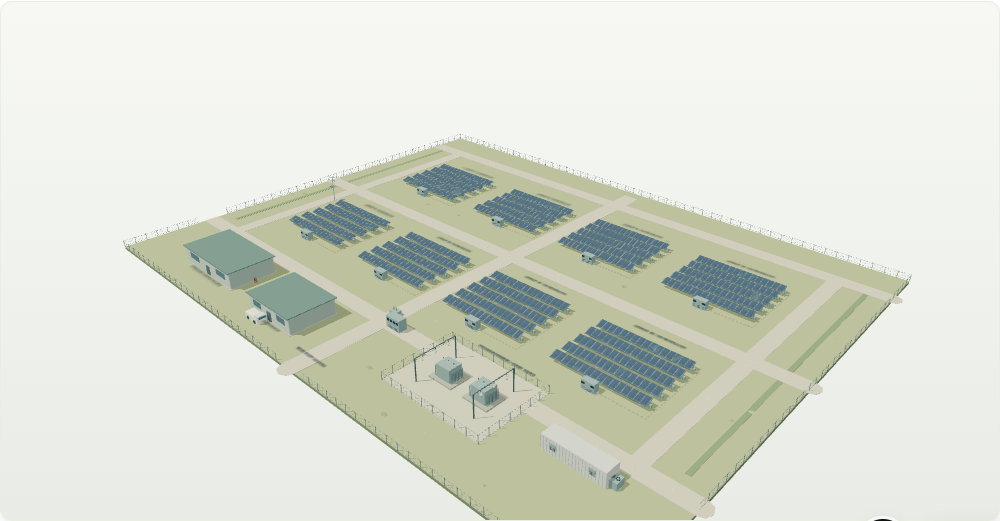
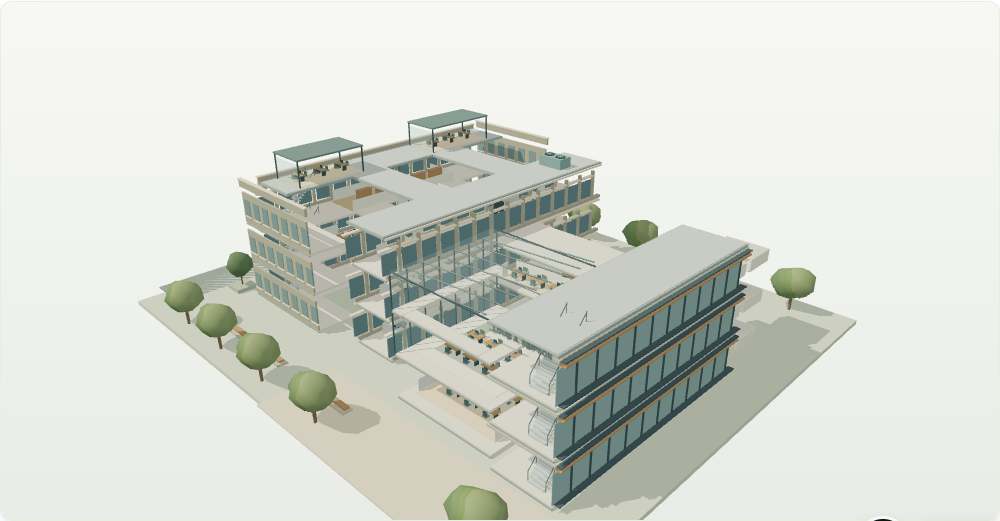
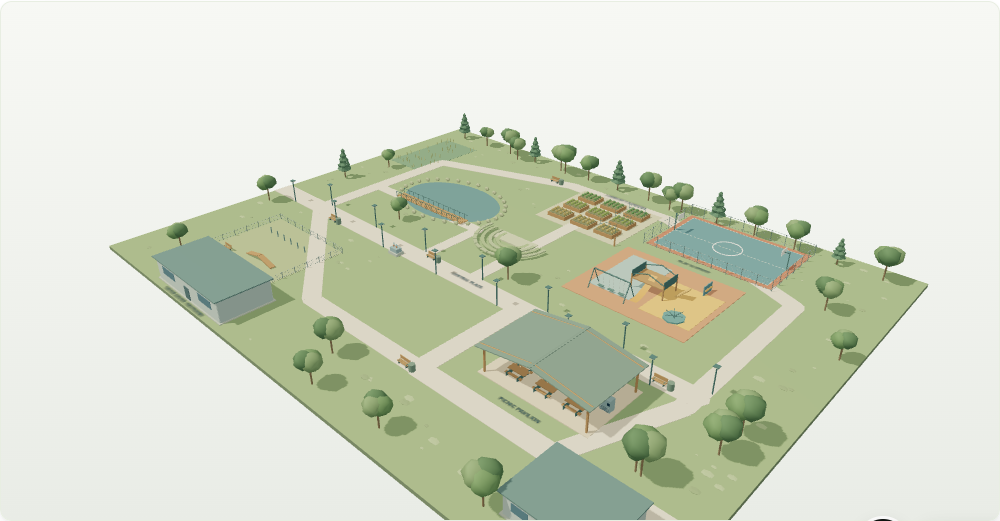
Discover with a drone. A Tello flies the site. Its live feed and captured frames appear in the Studio, and Gemini flags hazards in each frame. In Define, you can upload a zoning or permit PDF and ask it questions; answers come back with page citations.
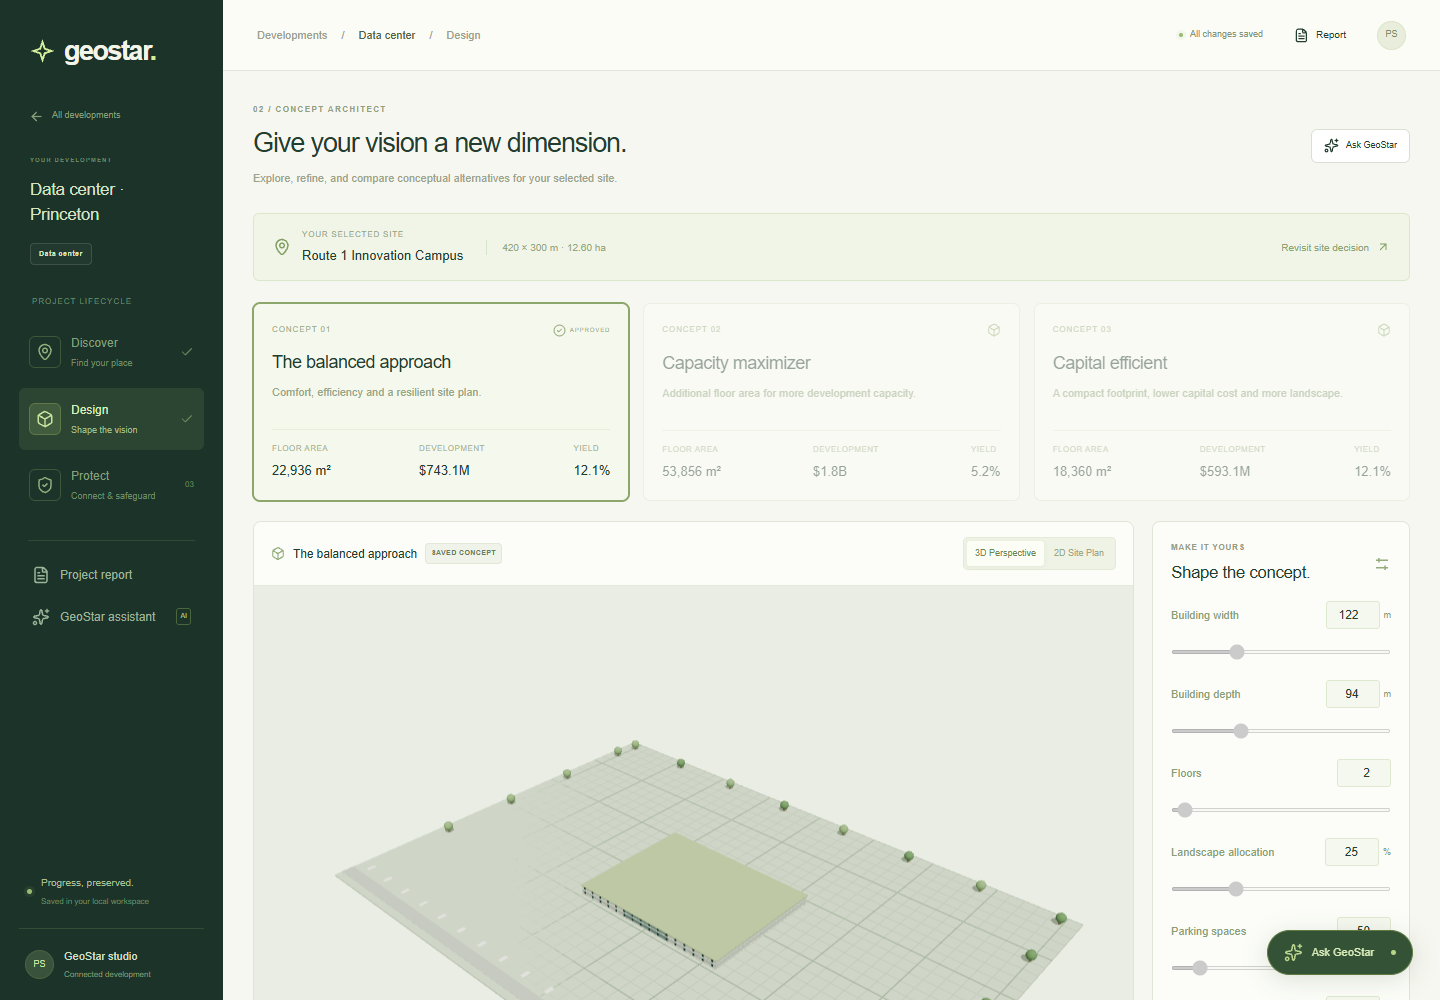
In the workspace, you shape the massing directly. Width, depth, floors, landscape and parking drive the geometry, the cost and the yield together:
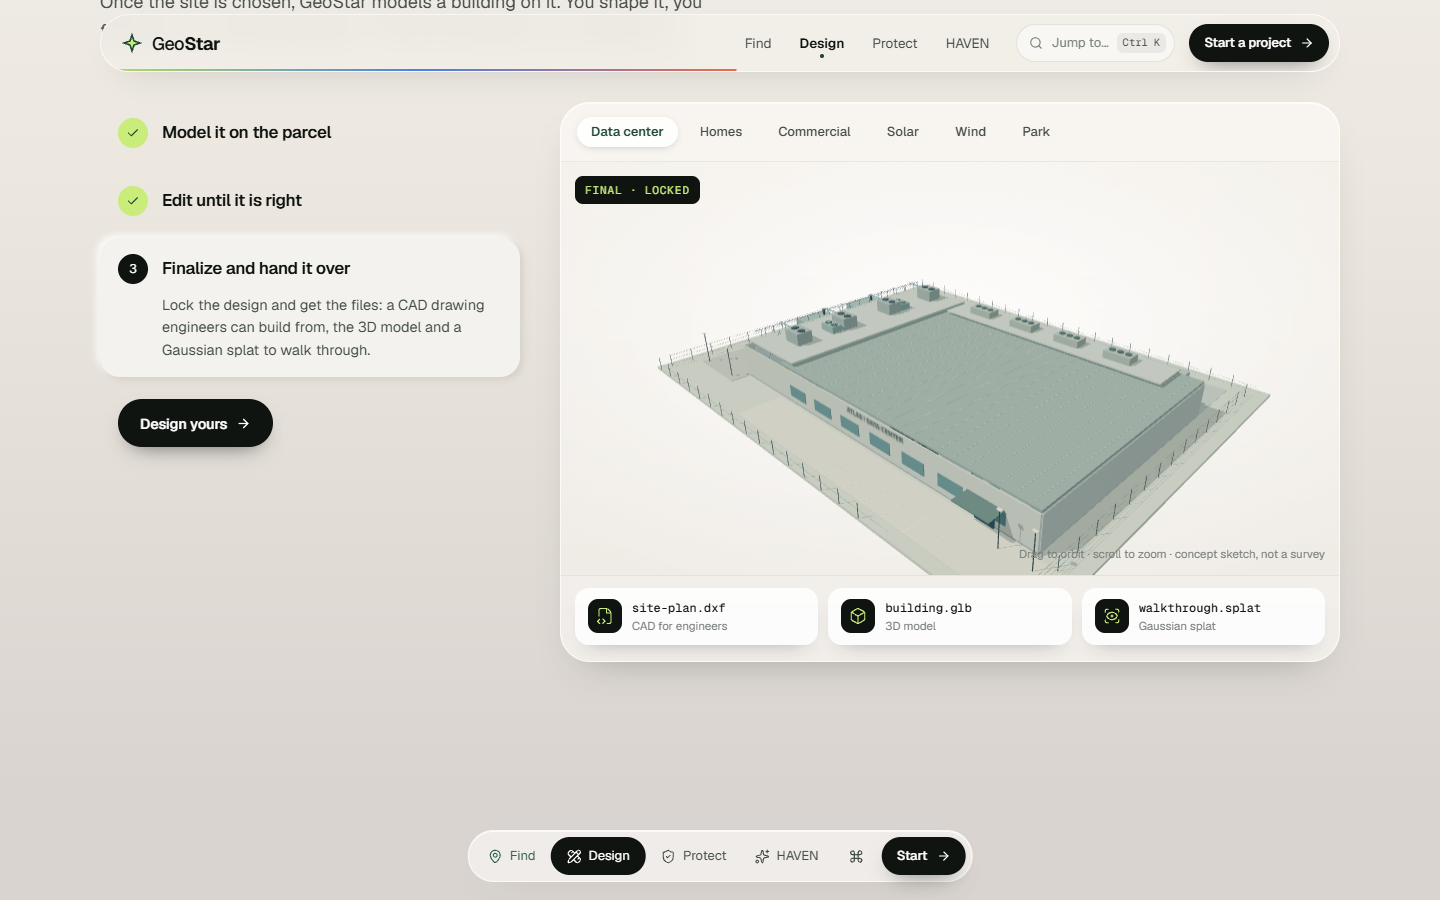
The landing page tells this part of the story with a live model you can play with: draft it, edit it, finalize it.
🛡️ 3. Protect it for life
Smoke alarms catch fires. GeoStar catches what causes them. Sensors go where buildings really fail: water risers, coolant loops, electrical panels, corridors.
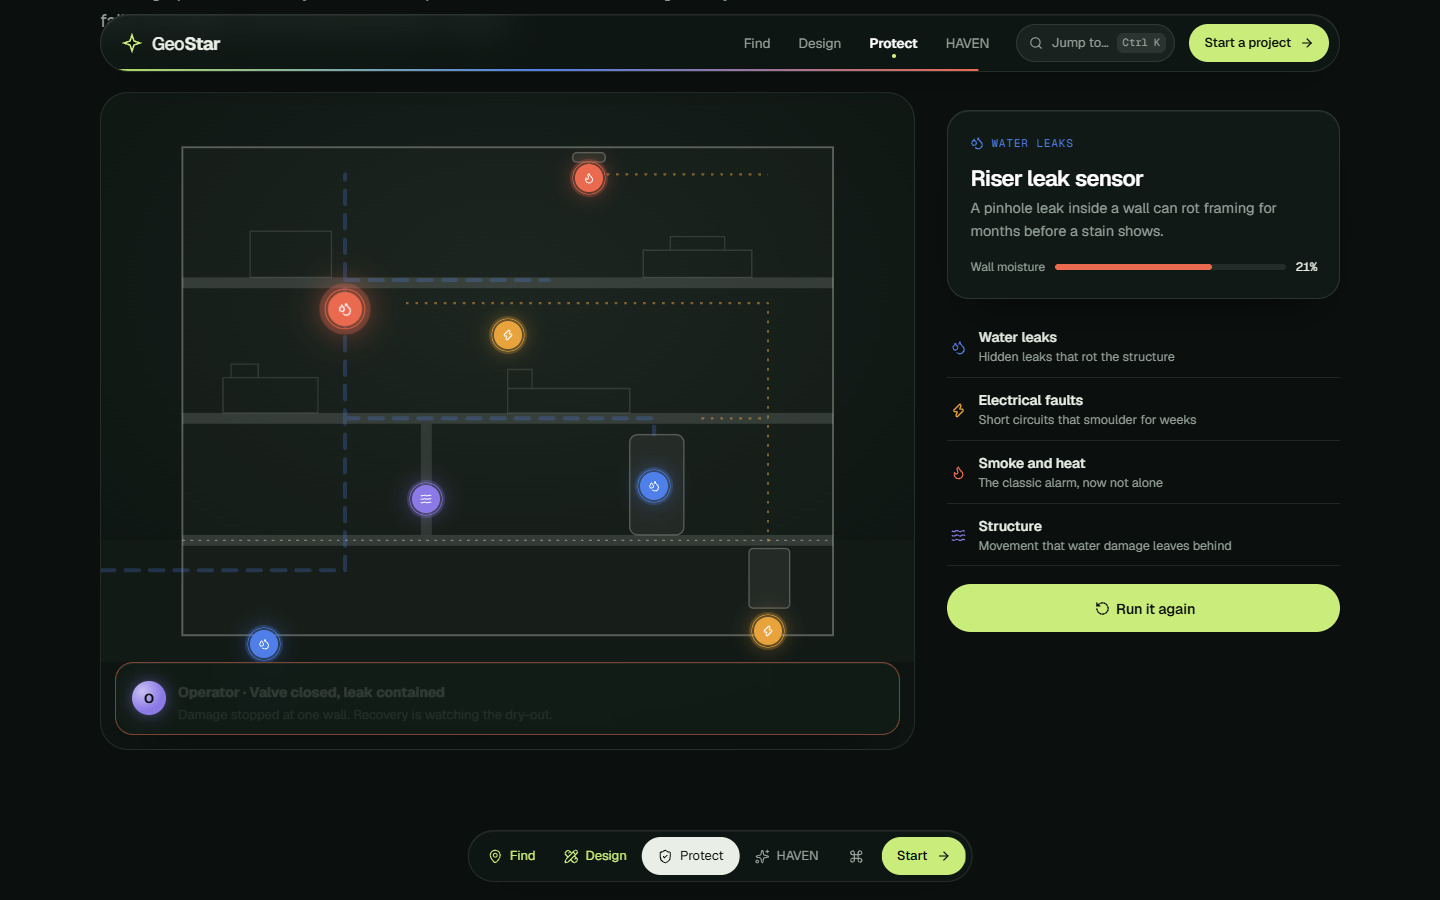
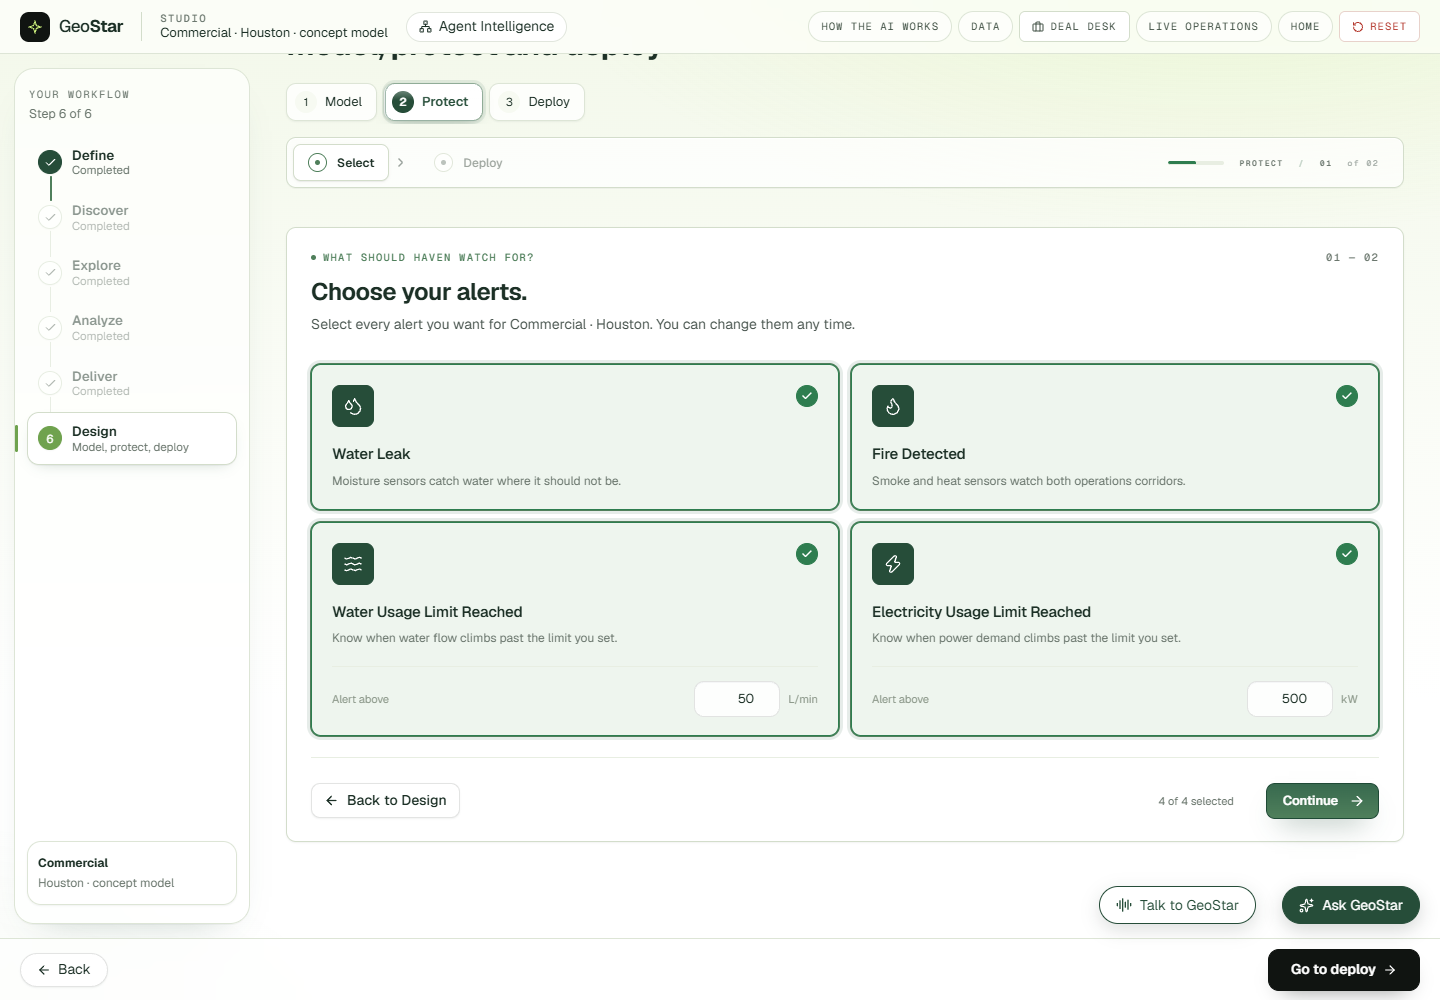
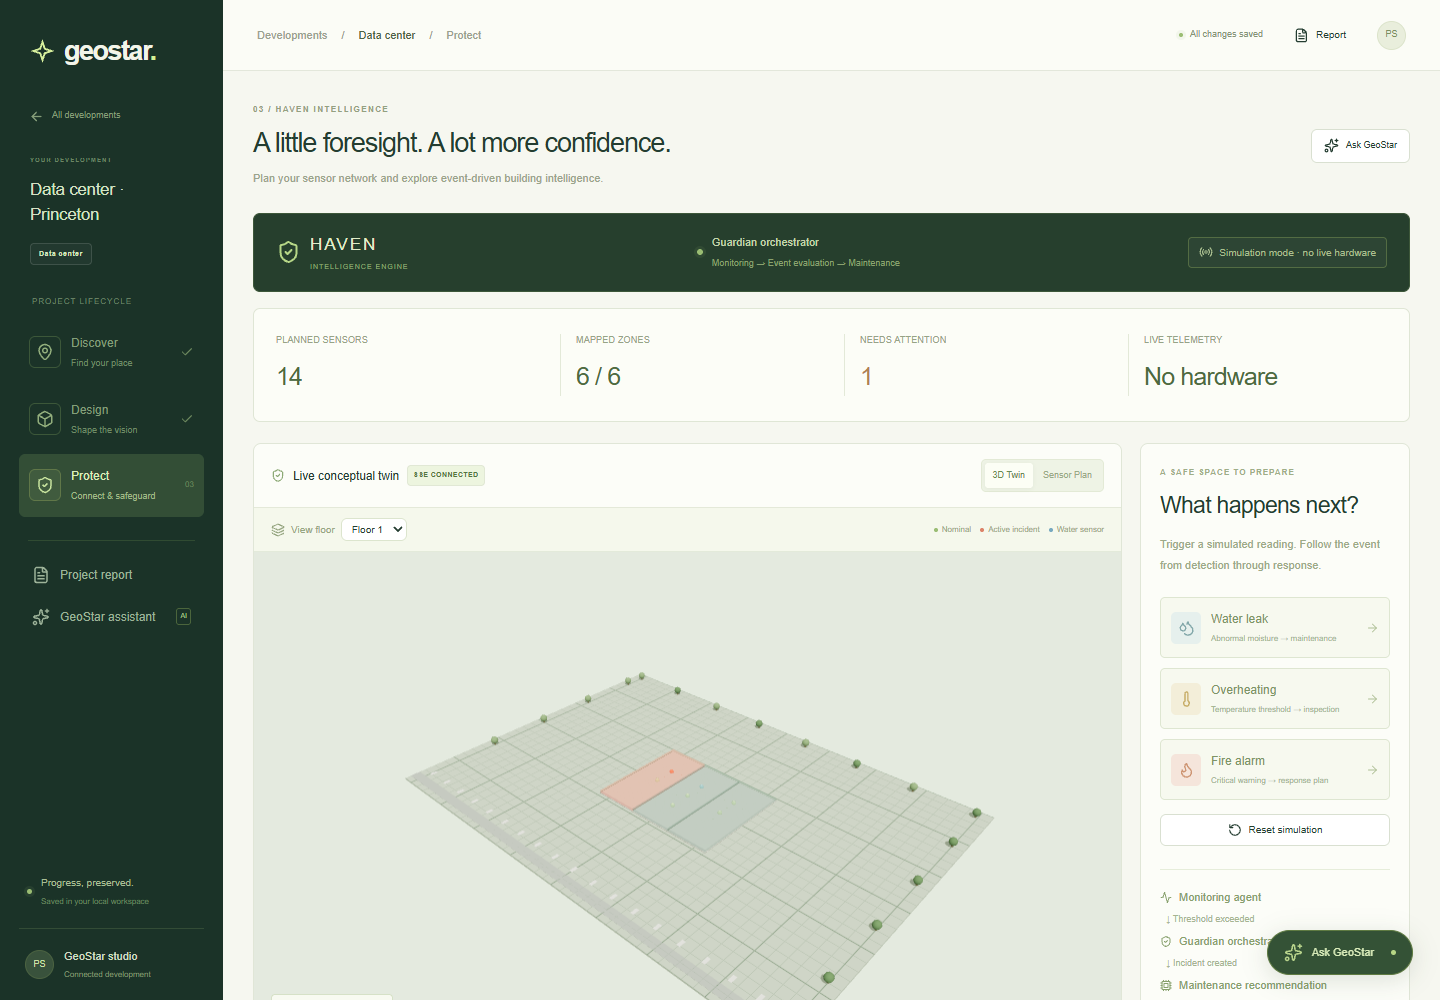
Protection takes two steps. First, choose what to watch and set your limits:
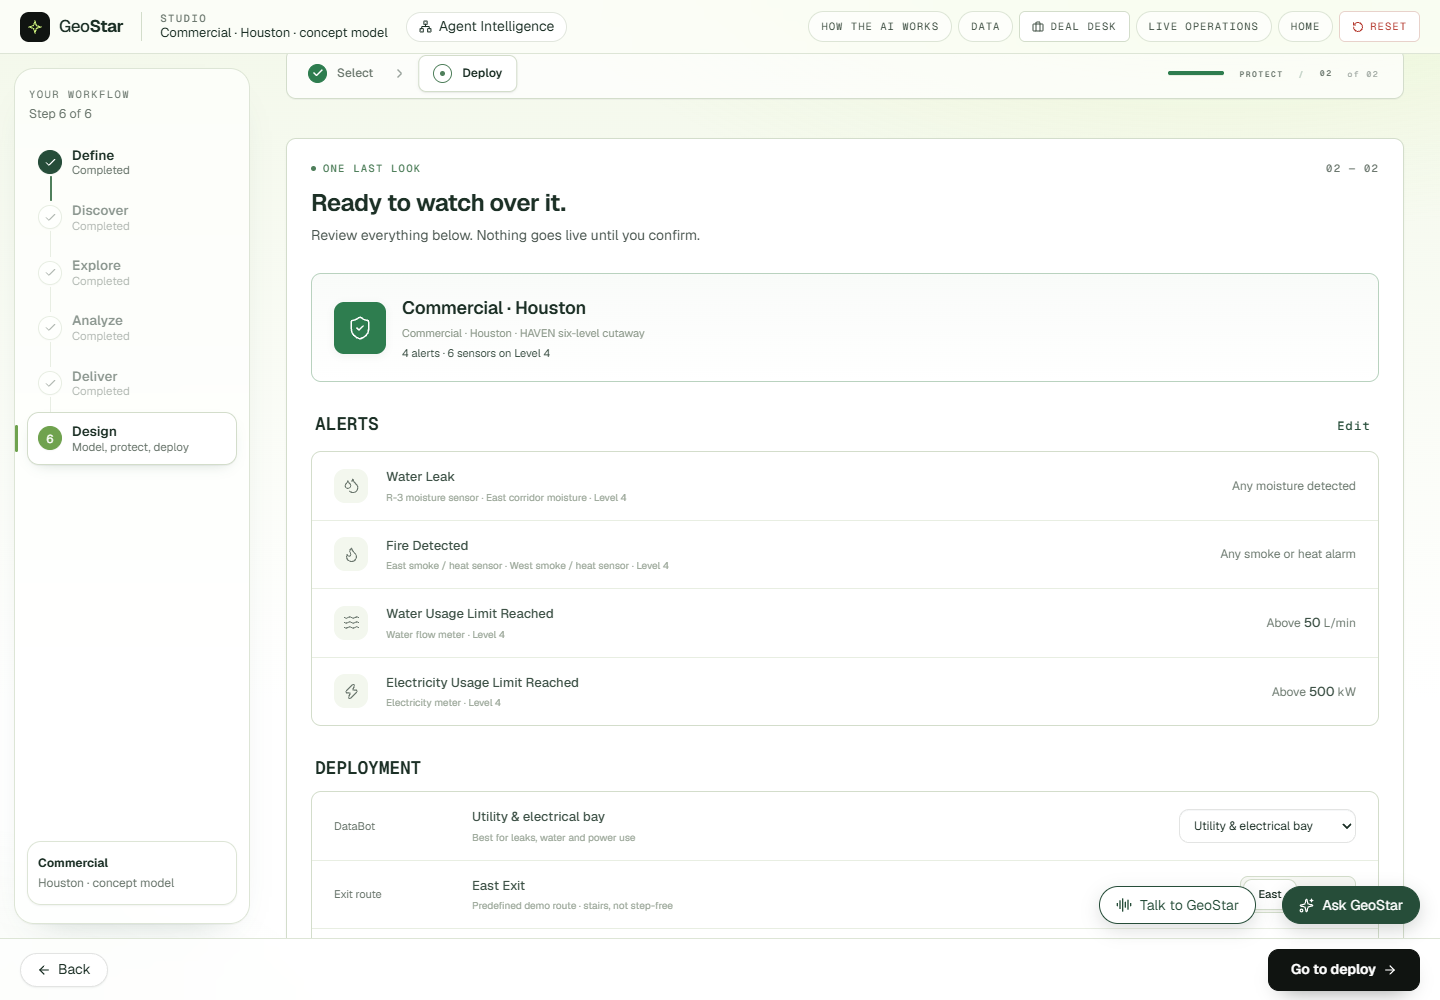
Then review the plan, place the hub, pick the exit route and deploy:
🚨 HAVEN: the command center
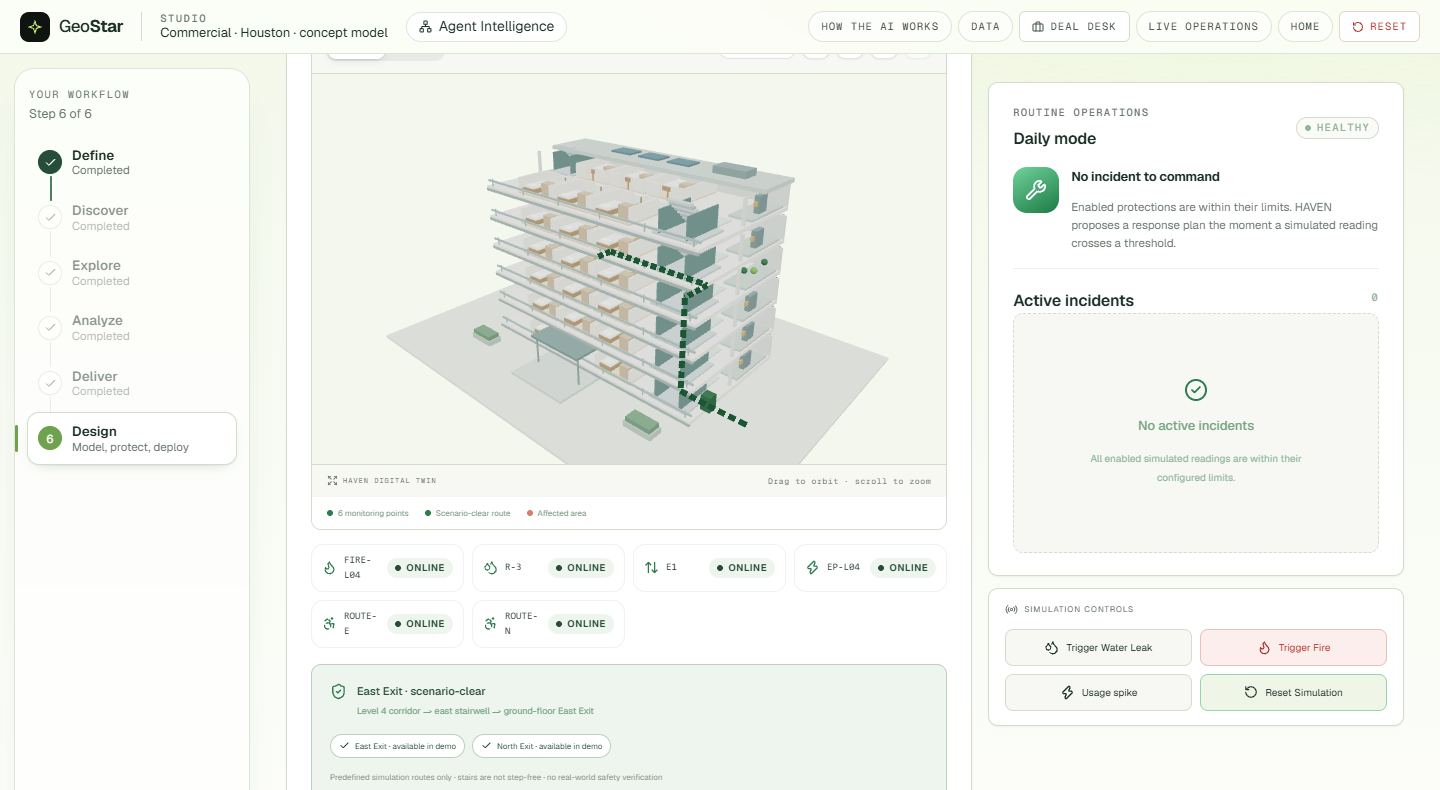
Every deployed facility gets a HAVEN command center: a digital twin, live readings against your limits, and a team of agents that explain what is happening in plain words.
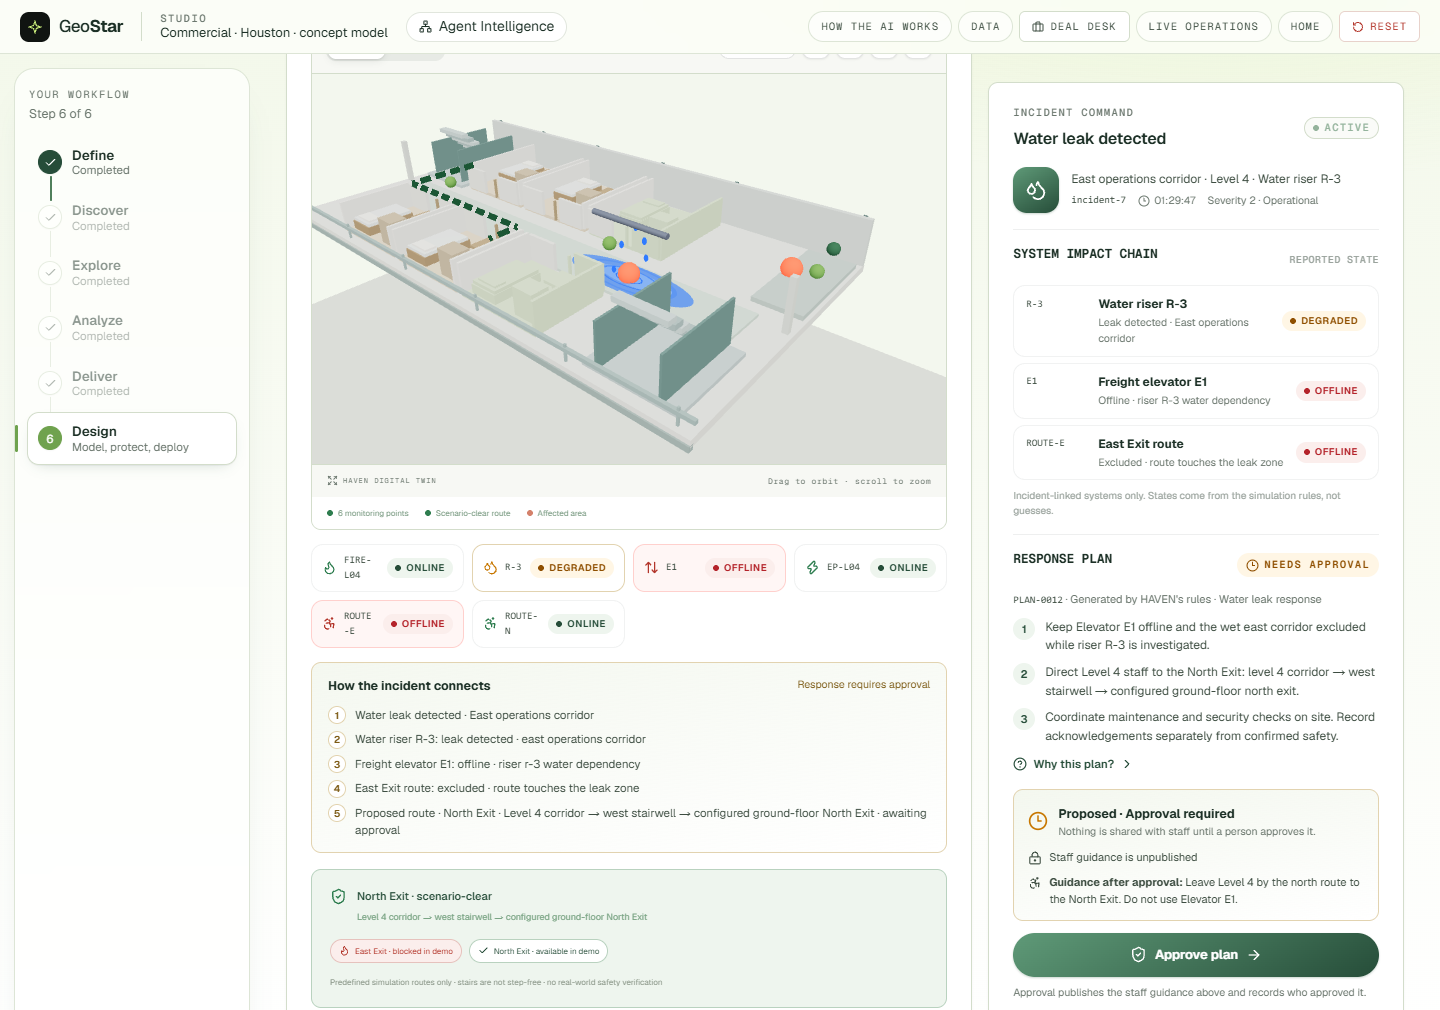
Trigger a water leak, and HAVEN traces the impact chain (riser, elevator, exit route), proposes a response plan and reroutes the evacuation path. It then waits for a person to approve before any guidance goes to staff.
A fire is a confirmed emergency. The twin shows the affected zone, the blocked exit and the clear one.
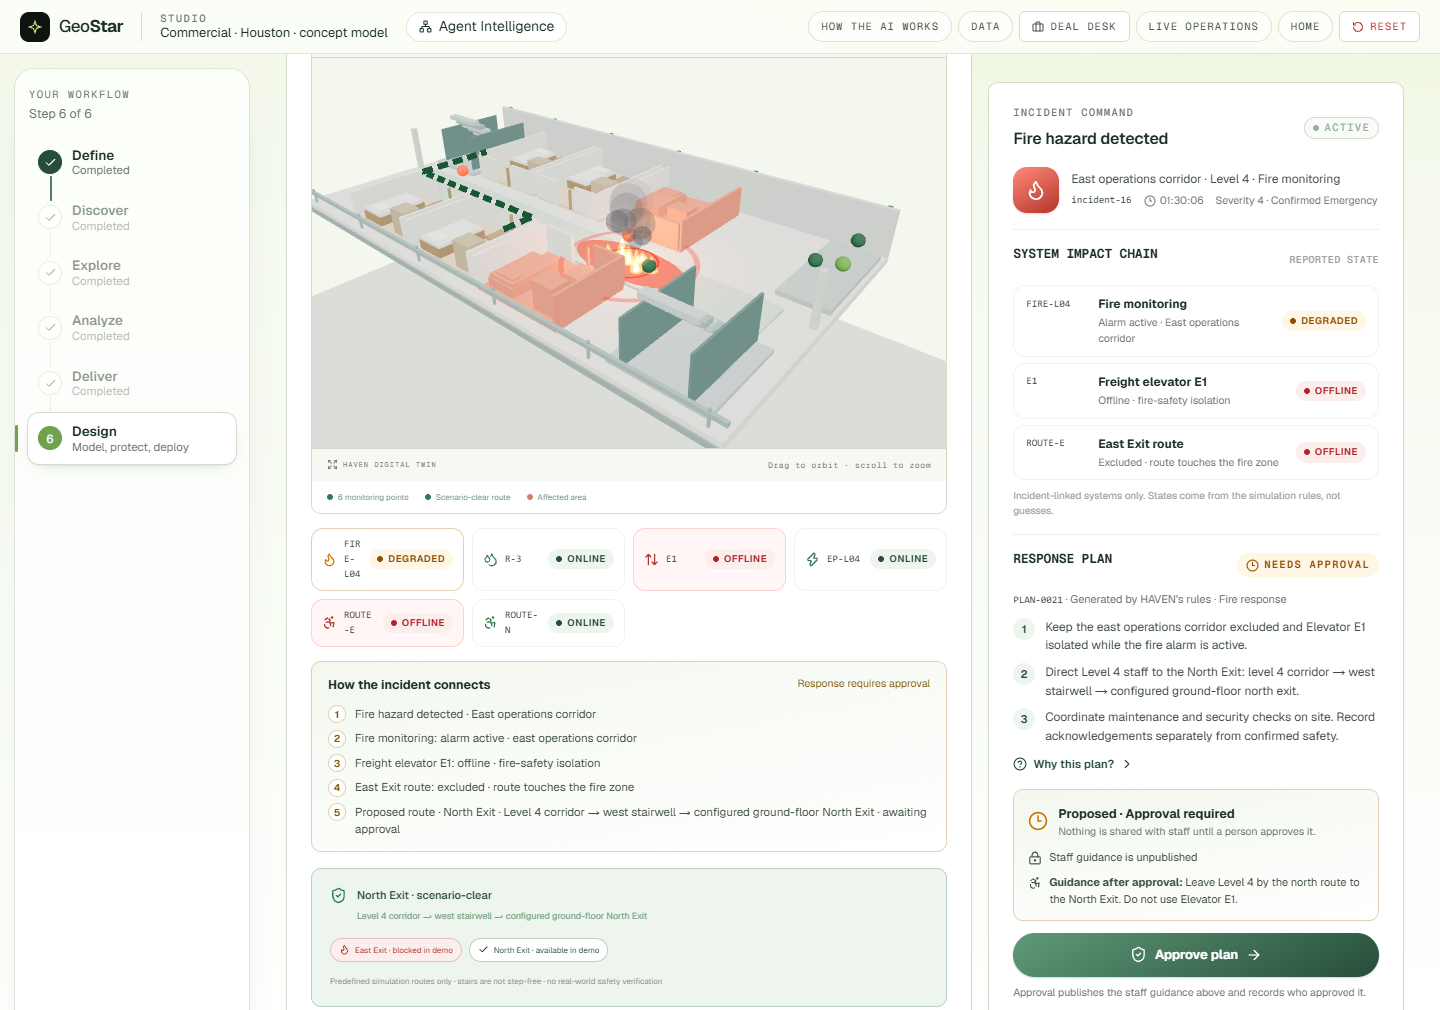
Geo makes the call. For a fire or a leak, HAVEN can phone the facility's emergency contact. Geo's voice reads out the incident and answers questions using only the incident details, through Cartesia, with ElevenLabs Agents as the fallback. It never dials 911. It tells the contact to call 911 if anyone is in danger. Dialling takes two taps, it allows one call a minute, and the browser only ever sees the last four digits of the number.
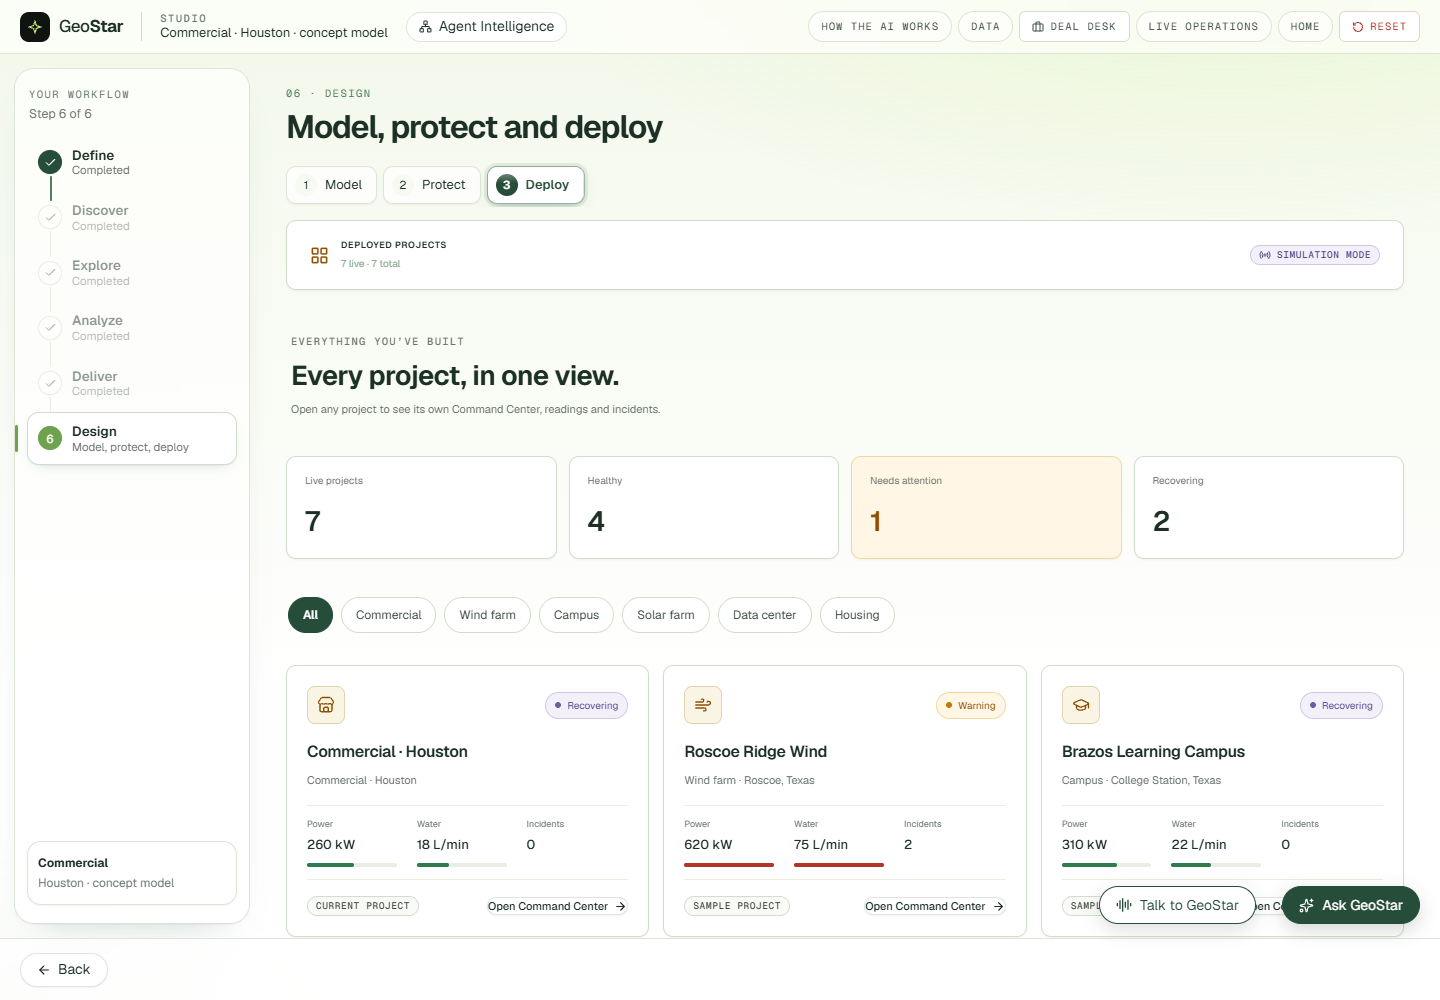
Every deployed project sits in one view, with the ones that need attention first:
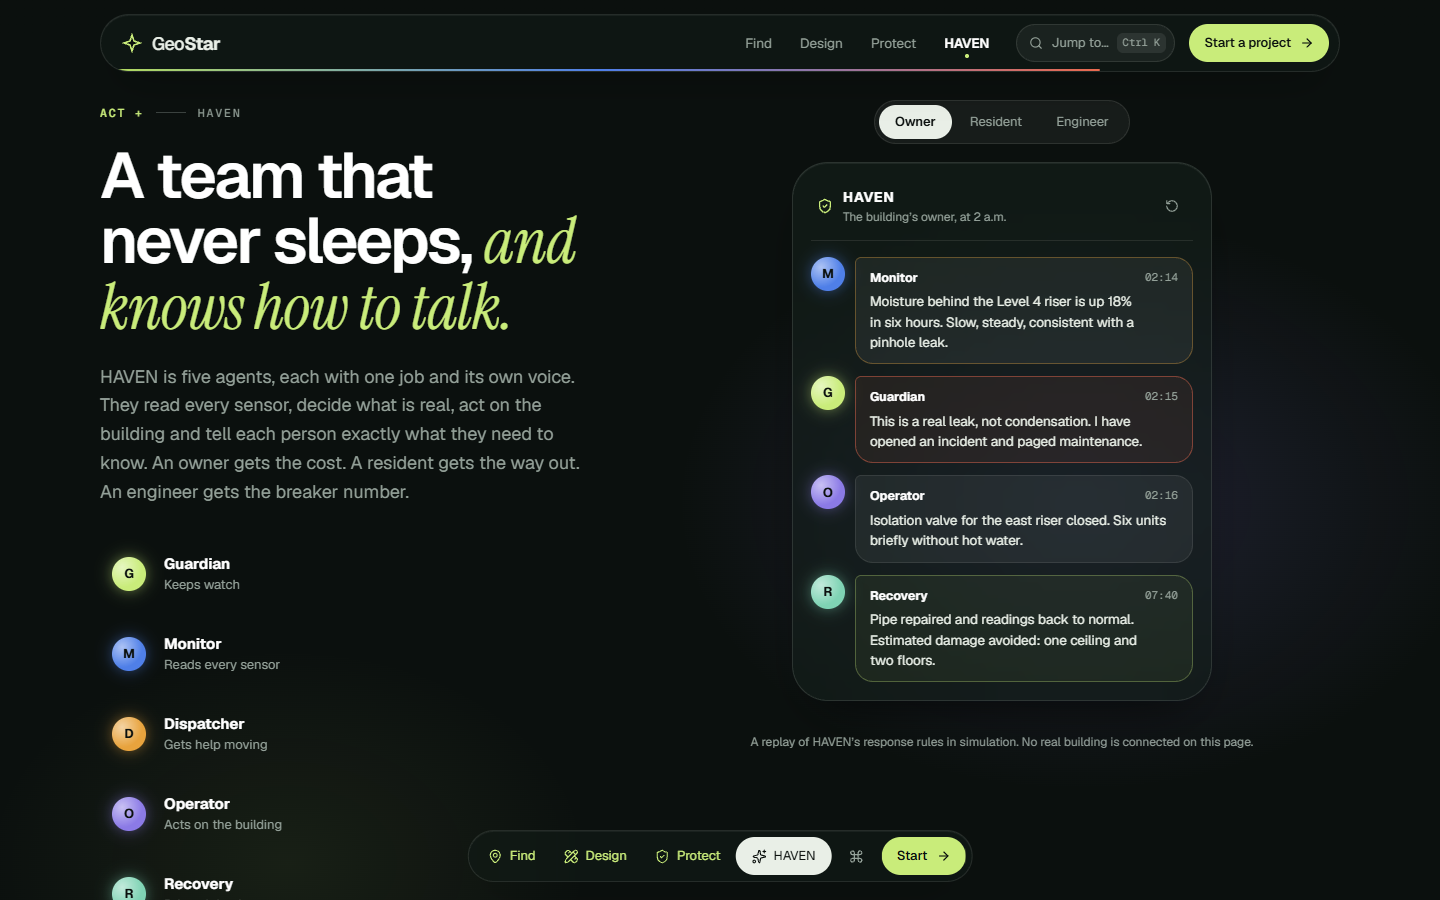
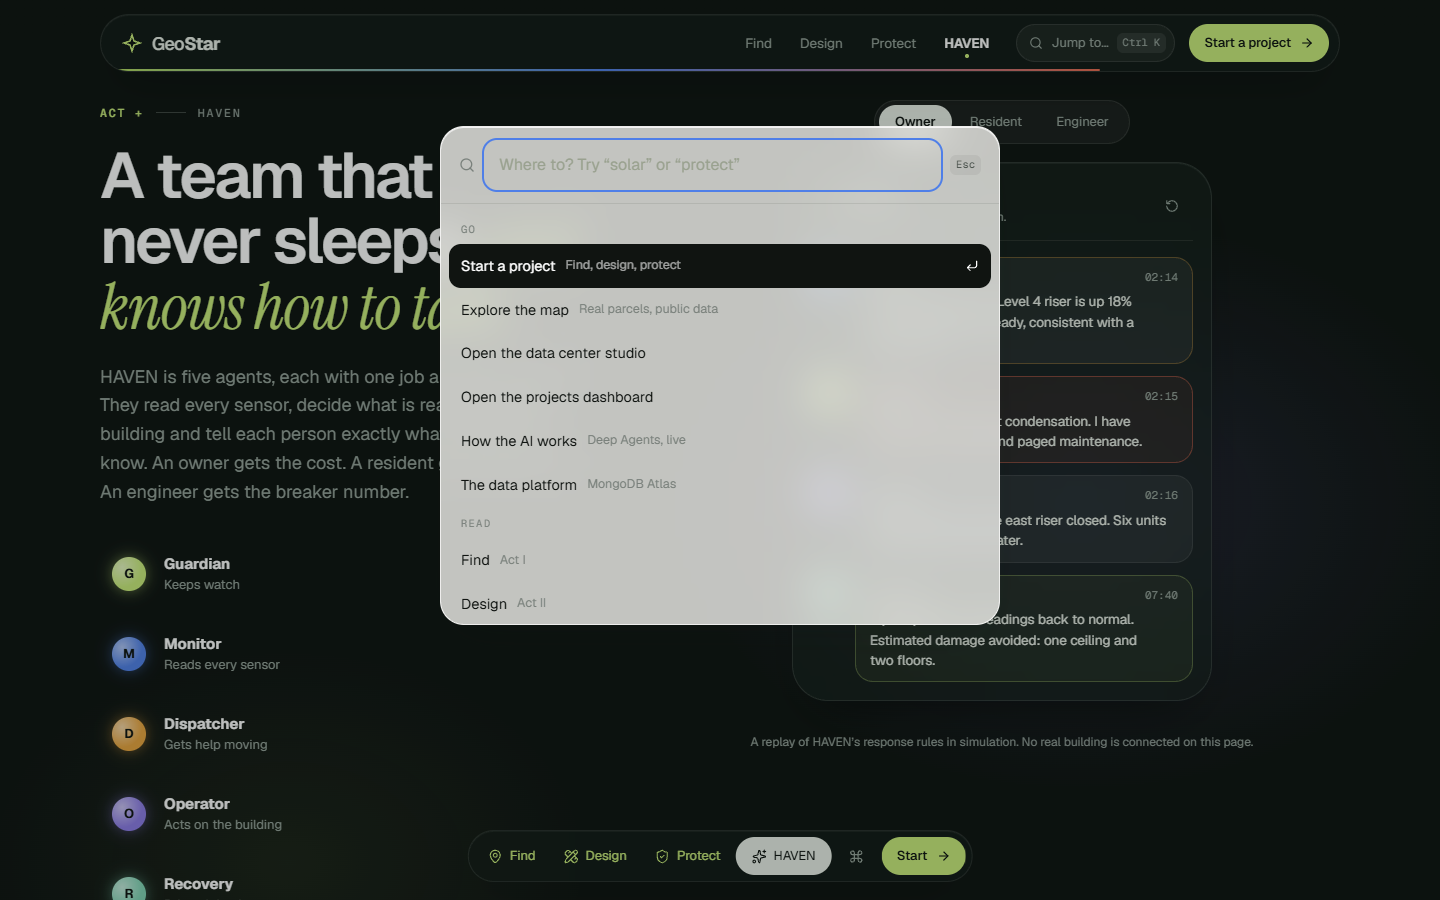
HAVEN speaks to each person differently. An owner gets the cost, a resident gets the way out, and an engineer gets the breaker number.
🔌 Live hardware: a real data hall on the bench
We built the protection hardware and ran it. Two boards feed the same incident pipeline as the simulator, so a real leak opens a real incident in the Command Center.
- Board 1, ESP32 (sensors and safety): a soil-moisture leak probe on the coolant loop, a servo coolant valve with a micro-switch that catches a stuck valve, a DHT11 for hot-aisle temperature, PIR for people in the hall, a PWM cooling fan, a buzzer, RGB AI status, an OLED, and an RC522 RFID reader. A manager's badge tap is the approval.
- Board 2, UNO R4 WiFi (operator console): a 4-digit display of live watts, a keypad to start a grid event and type the cut depth, and an LED matrix that shows the power graph, the fan's real speed and alarm animations.
- The laptop is the "AI load". It runs a real AI job and measures its own power. On a grid event, the request waits for the manager's approval, then the flexible jobs pause, cooling slows and the measured before/after is reported.
- A leak sounds the alarm until the probe reads dry or a manager acknowledges. The valve stays shut. A live leak places the emergency call automatically, once per incident.
- Taps are matched to questions. On the bench, a slow AI commander once let a queued badge tap approve the next question and reopen the valve. Now every tap records when it happened and approves only the question that was on screen.
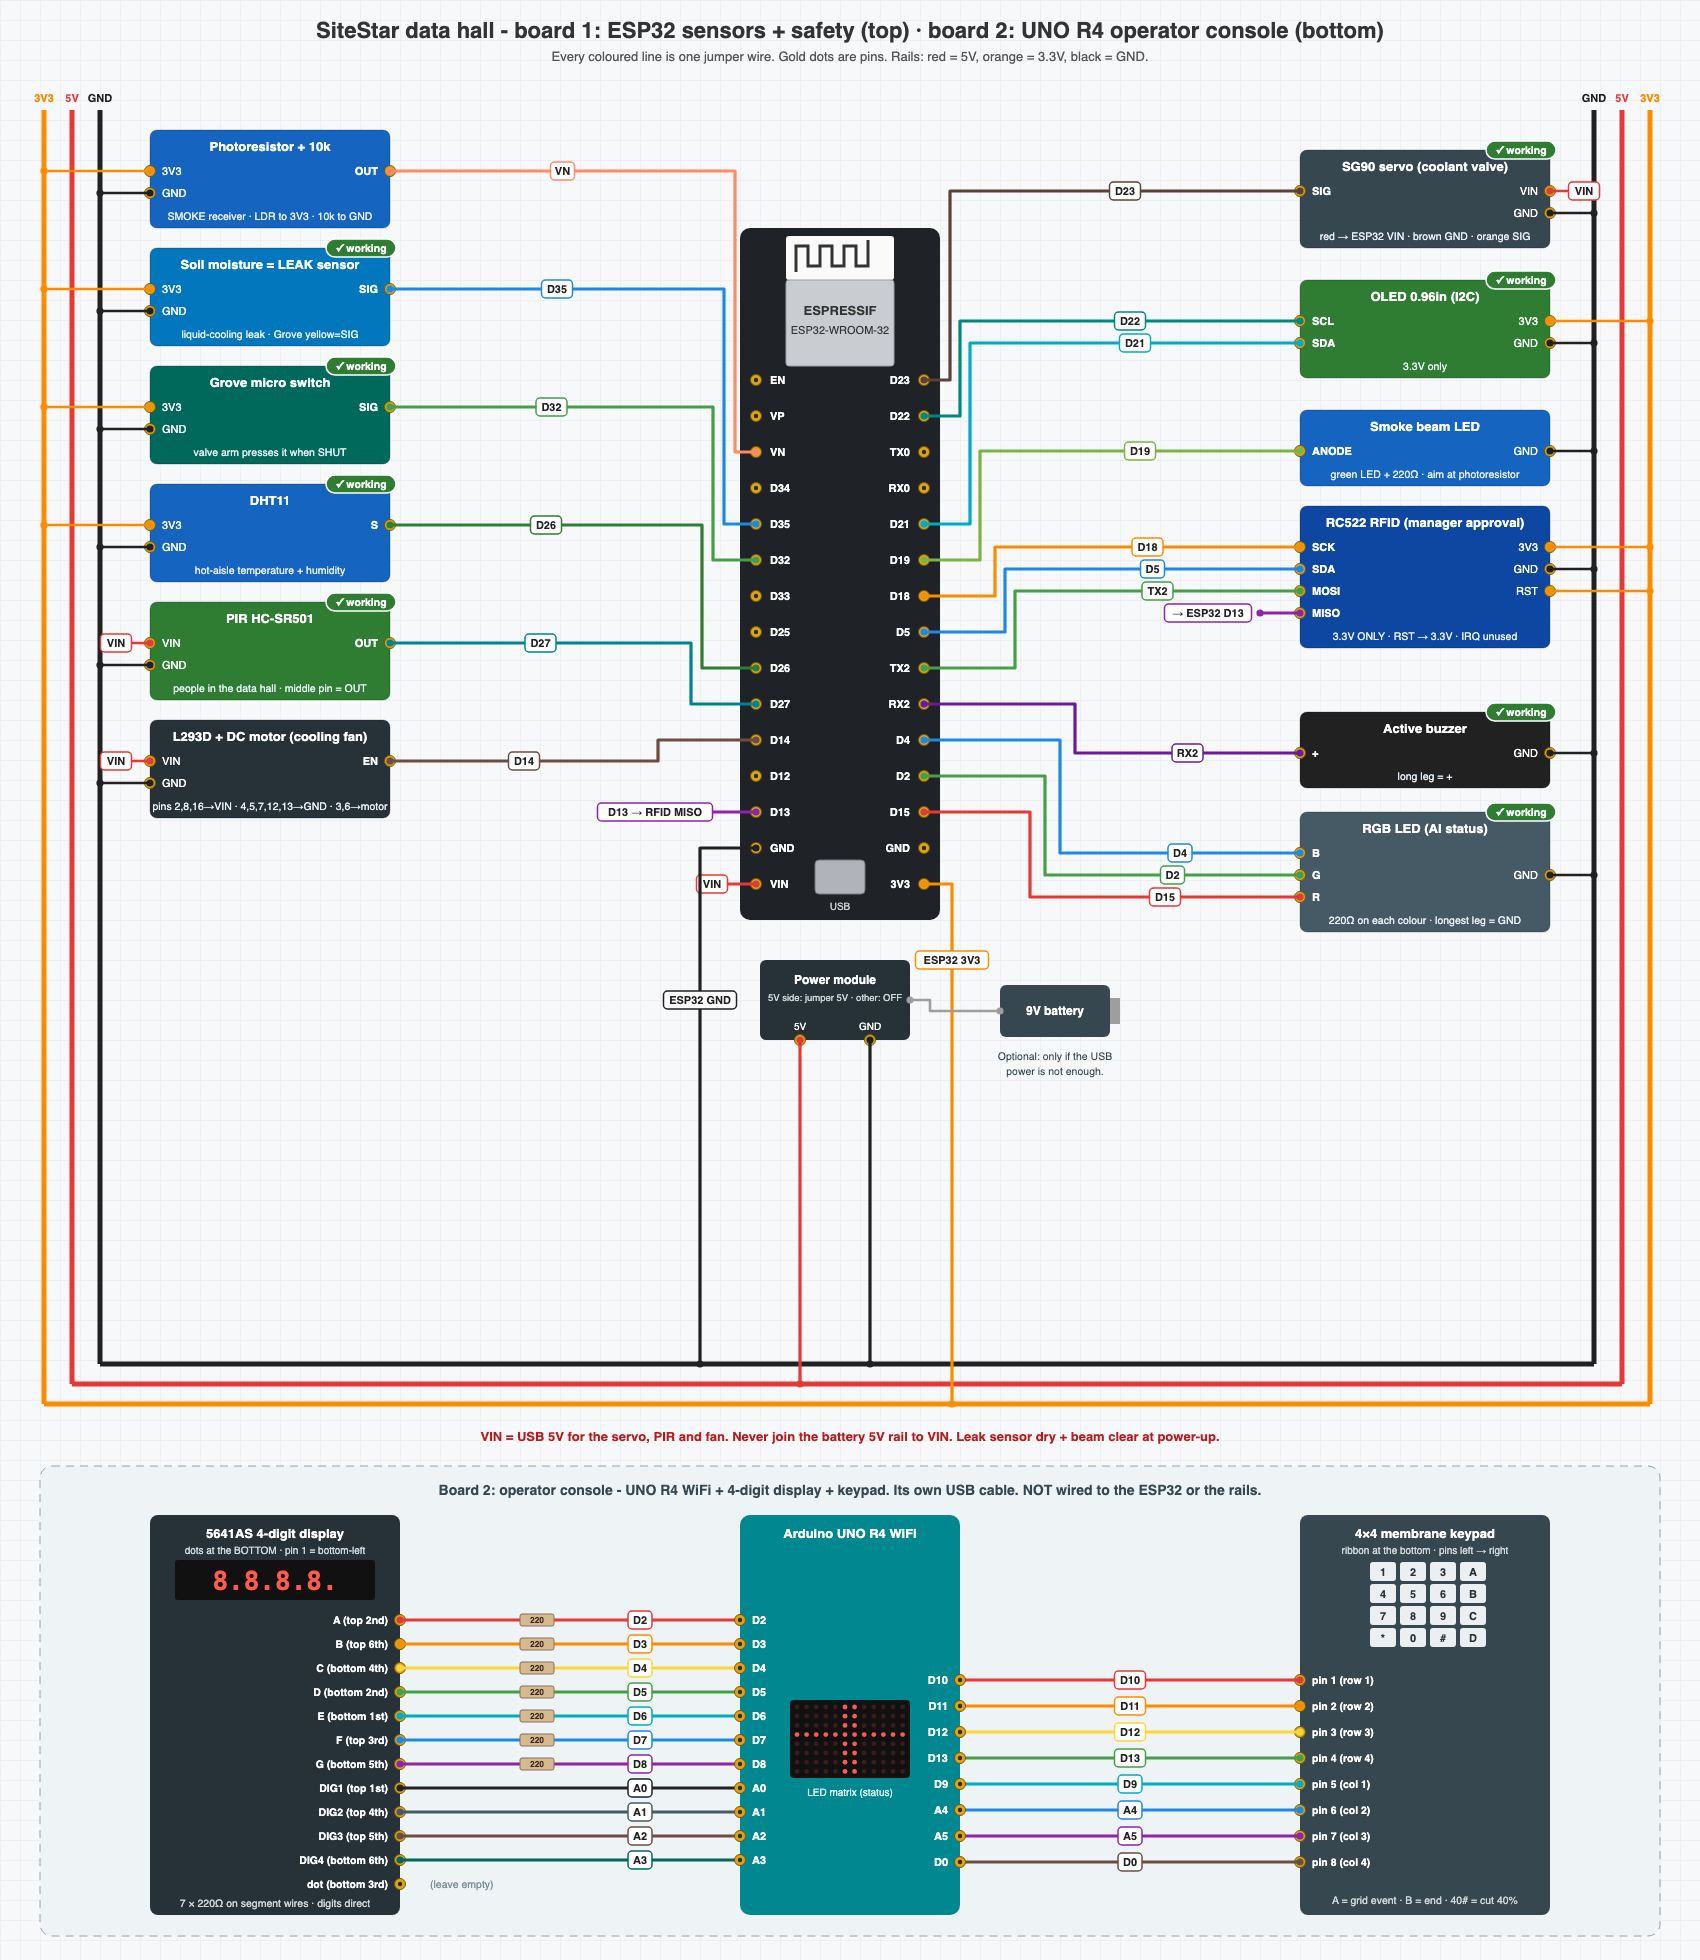
Any deployed project can be connected to the kit, and deploying a project connects it. Data centers get the data hall, the coolant loop and grid events. Other project types get water leak, temperature, humidity, ventilation and people on site.
🤖 Agents that show their work
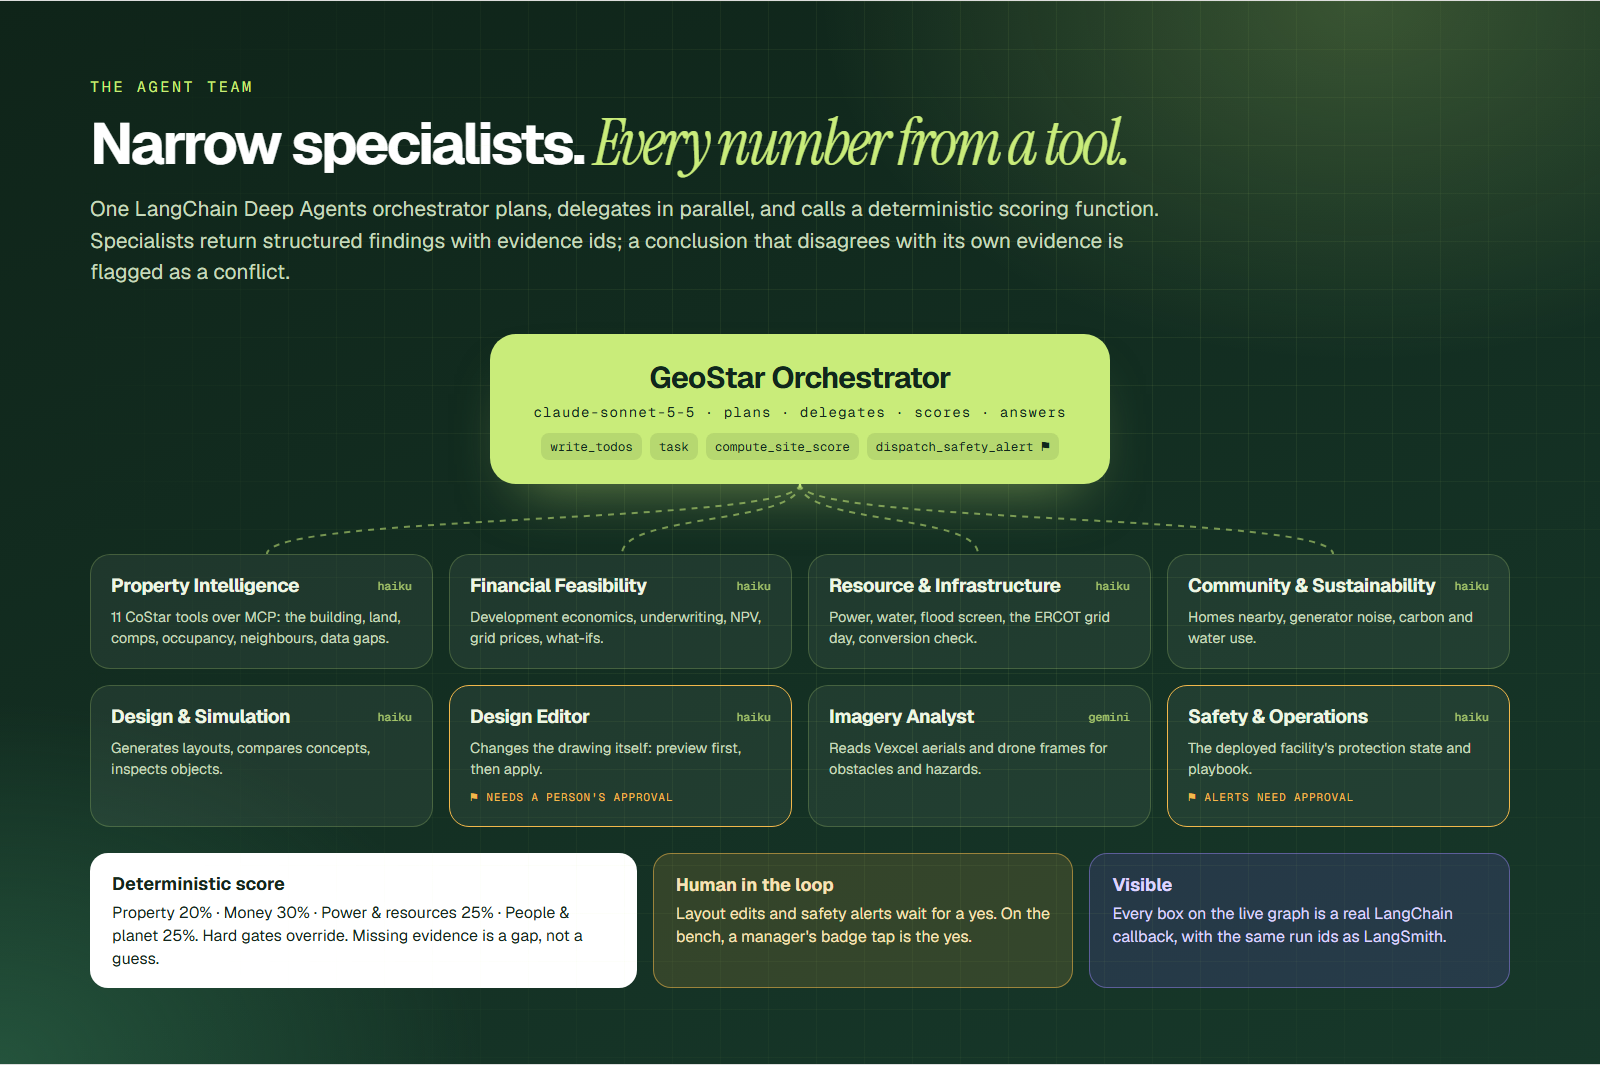
One orchestrator and eight specialists, built with the LangChain Deep Agents SDK on LangGraph and traced in LangSmith. The orchestrator writes a plan and delegates to the specialists in isolated contexts, in parallel when their work is independent. Running the four site-evaluation specialists together cut a full evaluation from ~119 s to ~54 s.
- Orchestrator (
claude-sonnet-5-5): plans, delegates, scores, answers - Property Intelligence (
claude-haiku-5-5): 11 CoStar tools over MCP - Financial Feasibility: development economics, underwriting, NPV, what-ifs
- Resource & Infrastructure: power, water, flood, the ERCOT grid day
- Community & Sustainability: homes nearby, noise, carbon, water use
- Design & Simulation: layouts, concept comparison, inspection
- Design Editor: changes the drawing itself (preview, then apply with a person's approval)
- Imagery Analyst (Gemini): reads Vexcel aerials and drone frames
- Safety & Operations: the deployed facility's protection state and playbook
The score has four pillars (Property 20%, Money 30%, Power and resources 25%, People and planet 25%). A criterion with no evidence is reported as a gap. Hard gates override the score. Sending a safety alert needs a person's approval.
The CoStar tools are an MCP server. The 15 CoStar intelligence tools (comps, underwriting, occupancy, submarket, conversion, residential impact, investment memo and more) are served as GeoStar's own MCP server. Our agents use it in-process, and Claude Code or Claude Desktop can connect over stdio.
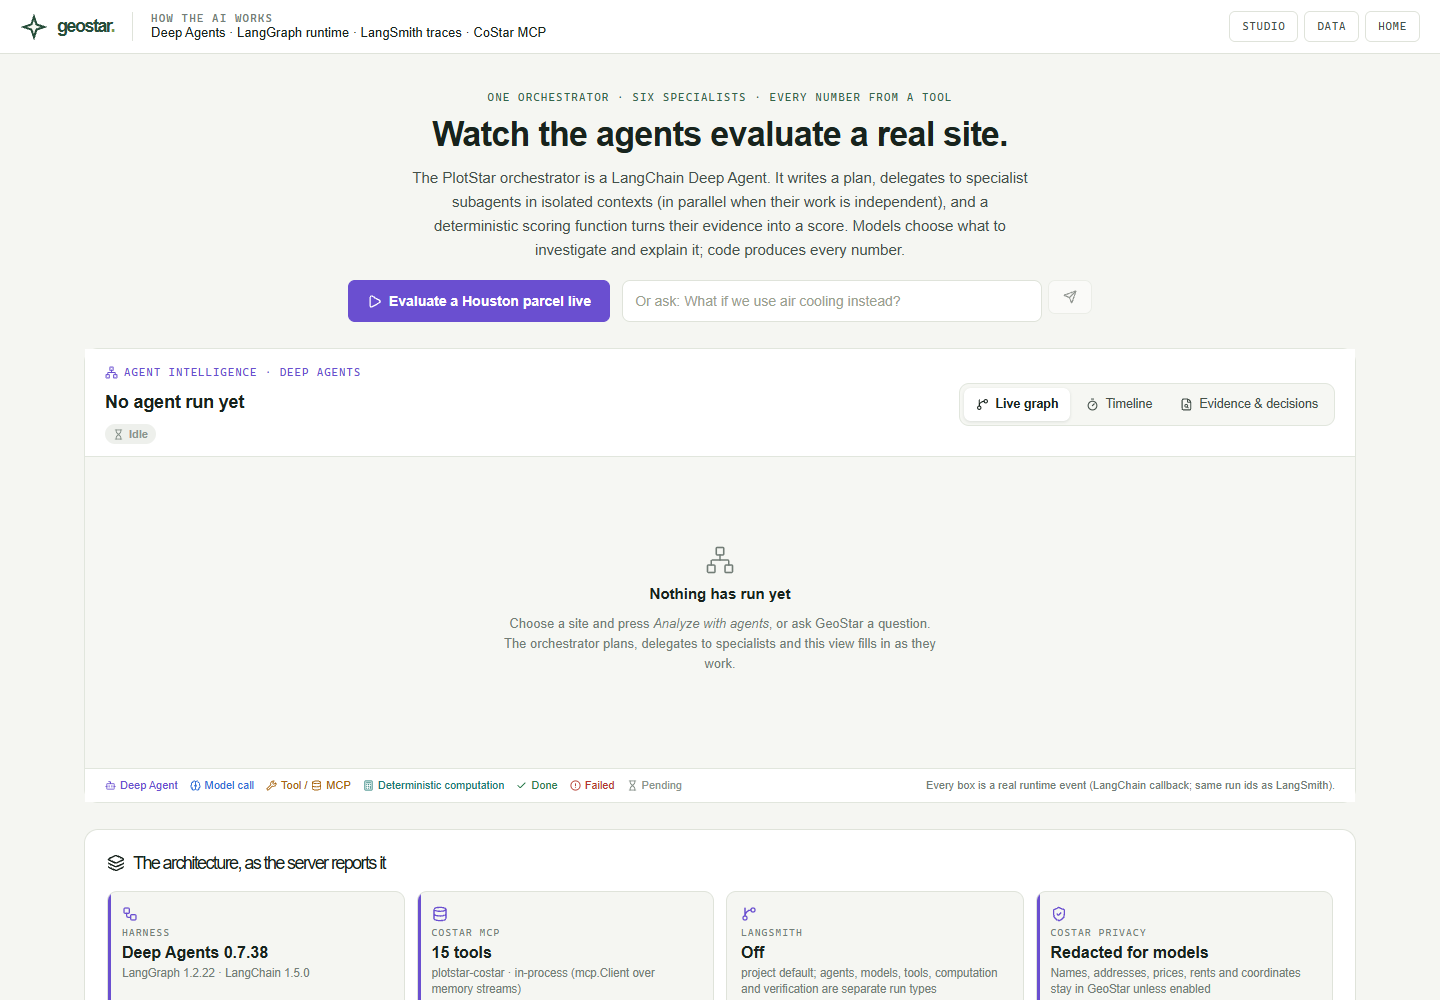
The Agent Intelligence page draws the live graph from real runtime events. Every box is a LangChain callback with the same run id as in LangSmith:
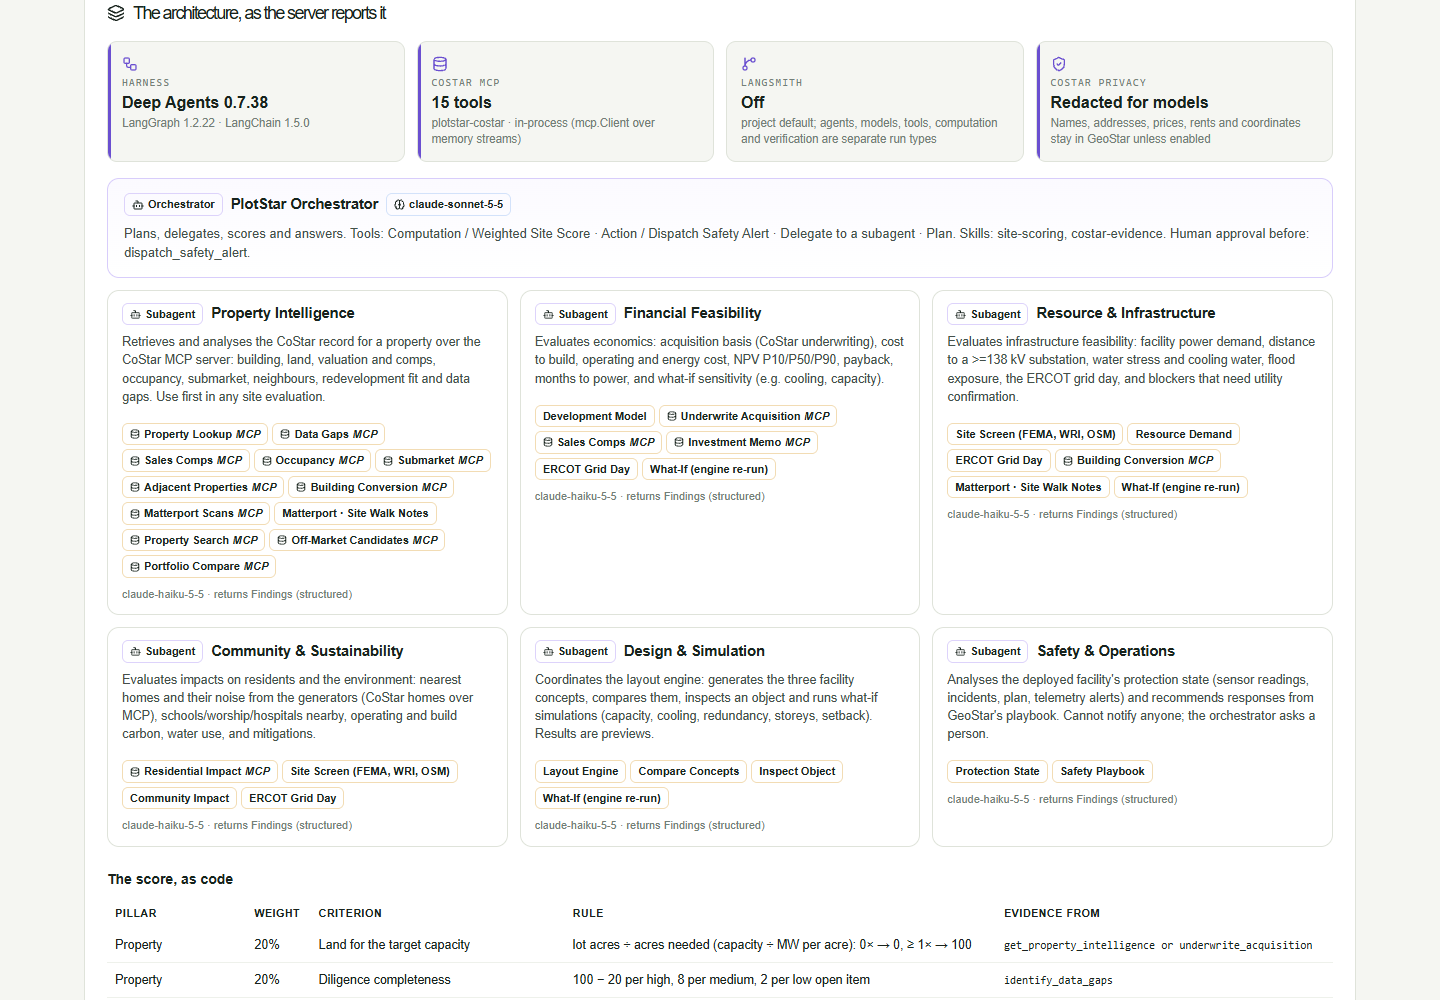
It also reports its own architecture from the running server: each agent, its model, its tools, and the scoring rule as code.
🗂️ One project, start to finish
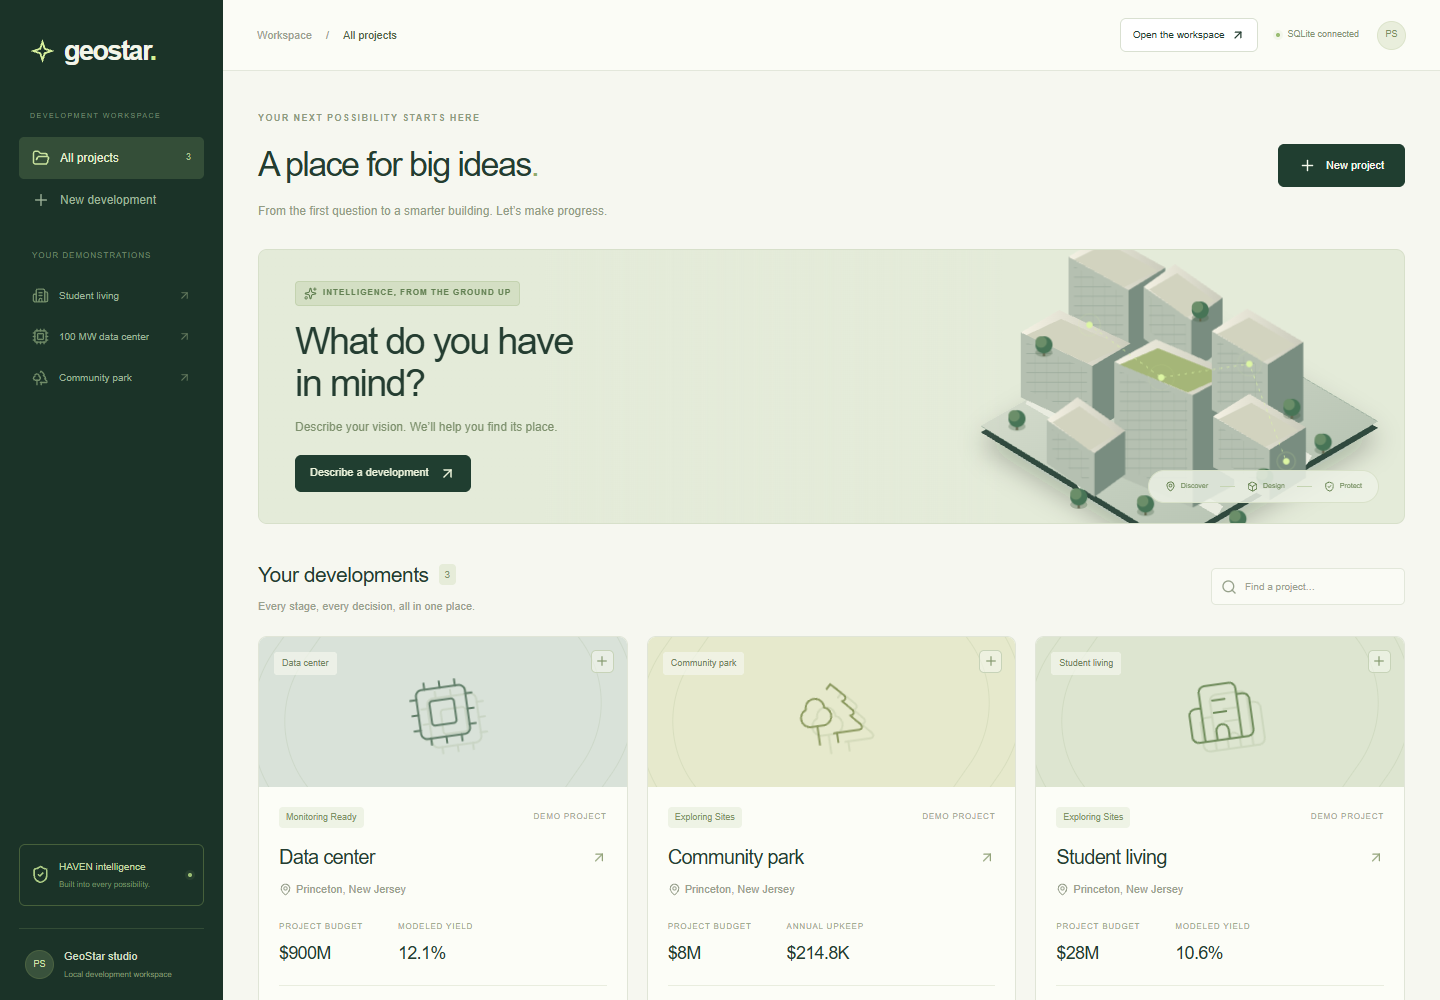
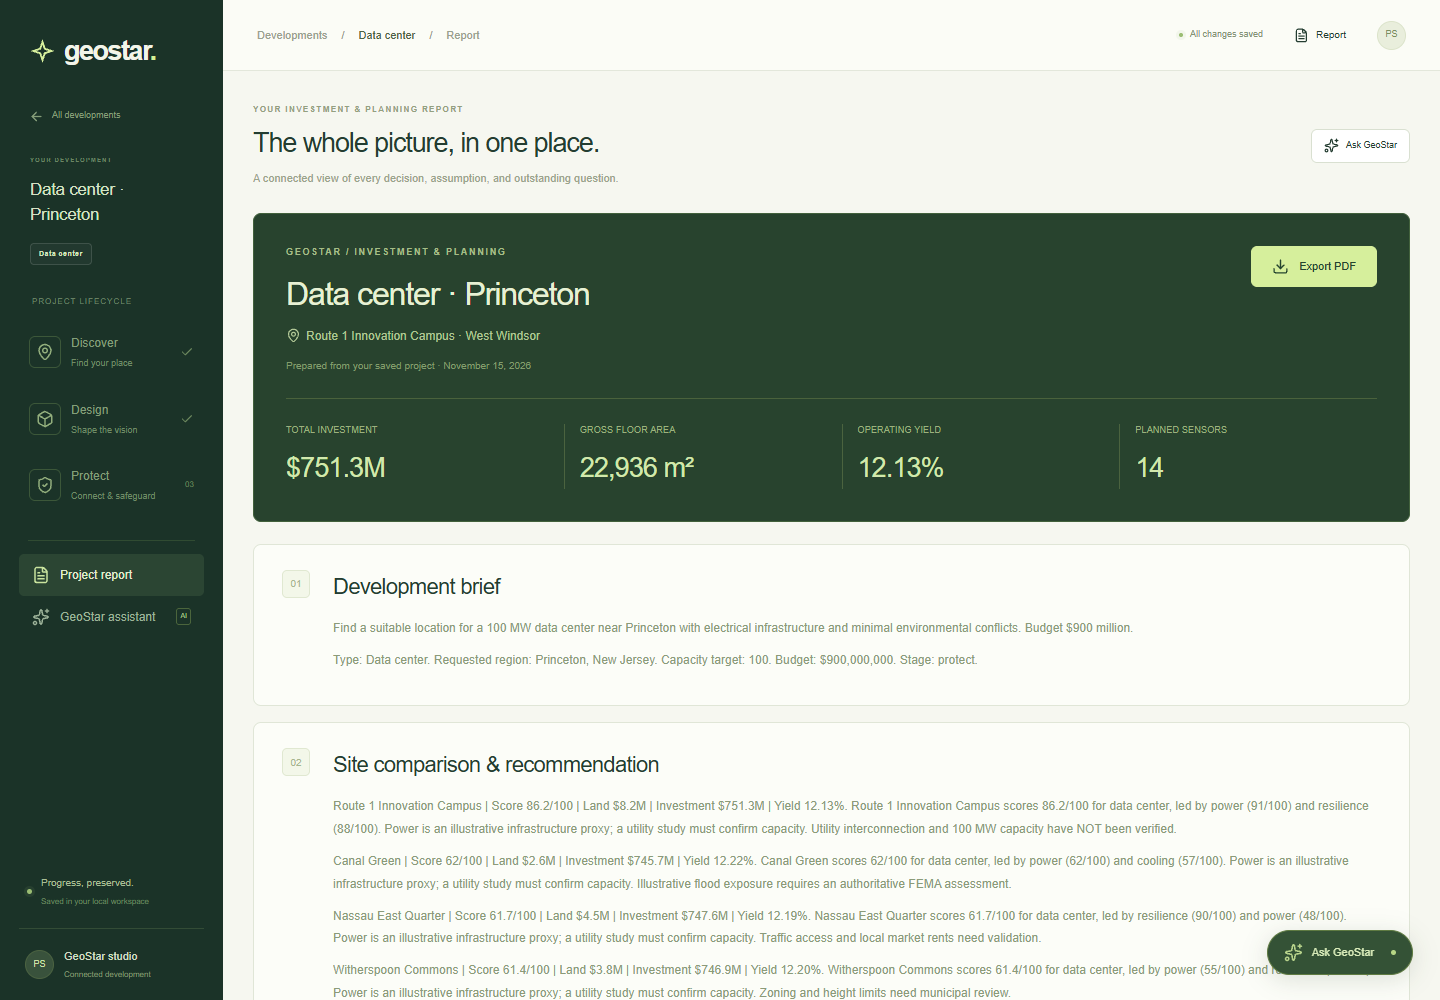
The workspace keeps the whole journey in one saved project: discover, design, protect, and a report you can export as a PDF.
✨ A landing page that tells the story
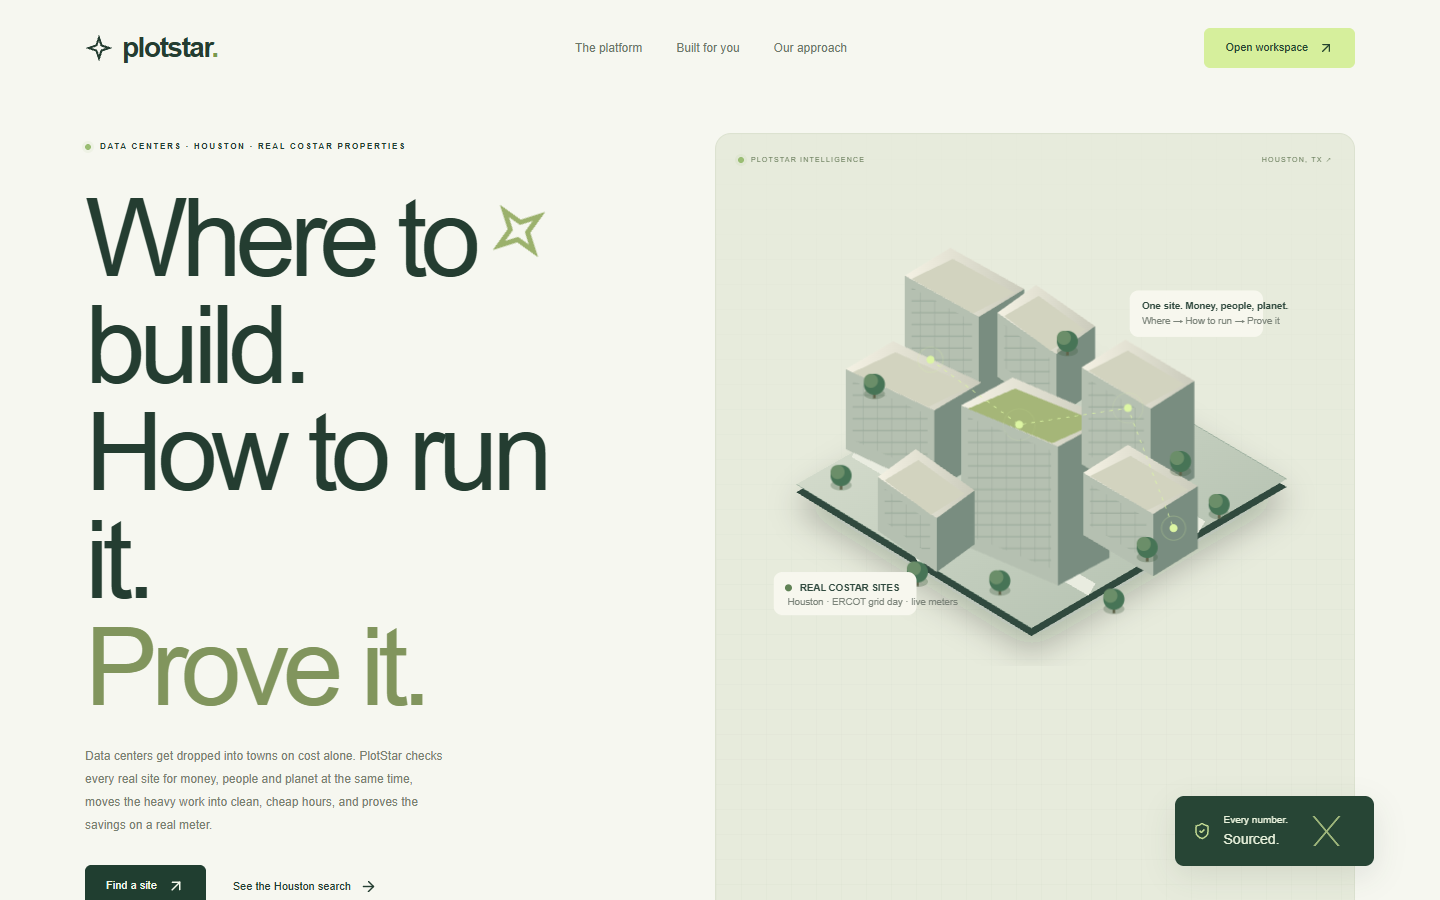
The landing page is the pitch. It's an inverted pyramid (the answer first, then the three acts, then the detail), with an action bar that follows you down the page and a command menu on Ctrl K.
📱 Also in the repo
- iPhone app (
mobile/): native SwiftUI, for HAVEN incident response away from the laptop, plus a tab to fly the Tello drone. - Live grid twin (
twin/,hardware/): an ESP32 tabletop grid replays a real ERCOT day. Press the grid emergency button and the flexible AI work pauses. - SiteStar (
web/): a companion site that screens existing Houston buildings for conversion into AI data centers. - How we built it (
/studio/built-with): the ChatOverflow field notes our coding agents searched, used and saved while building GeoStar. When a Vexcel, Matterport, Gemini or CoStar call fails, the API looks up the error on ChatOverflow and attaches the matching note ids, sending only scrubbed generic words.
How we built it
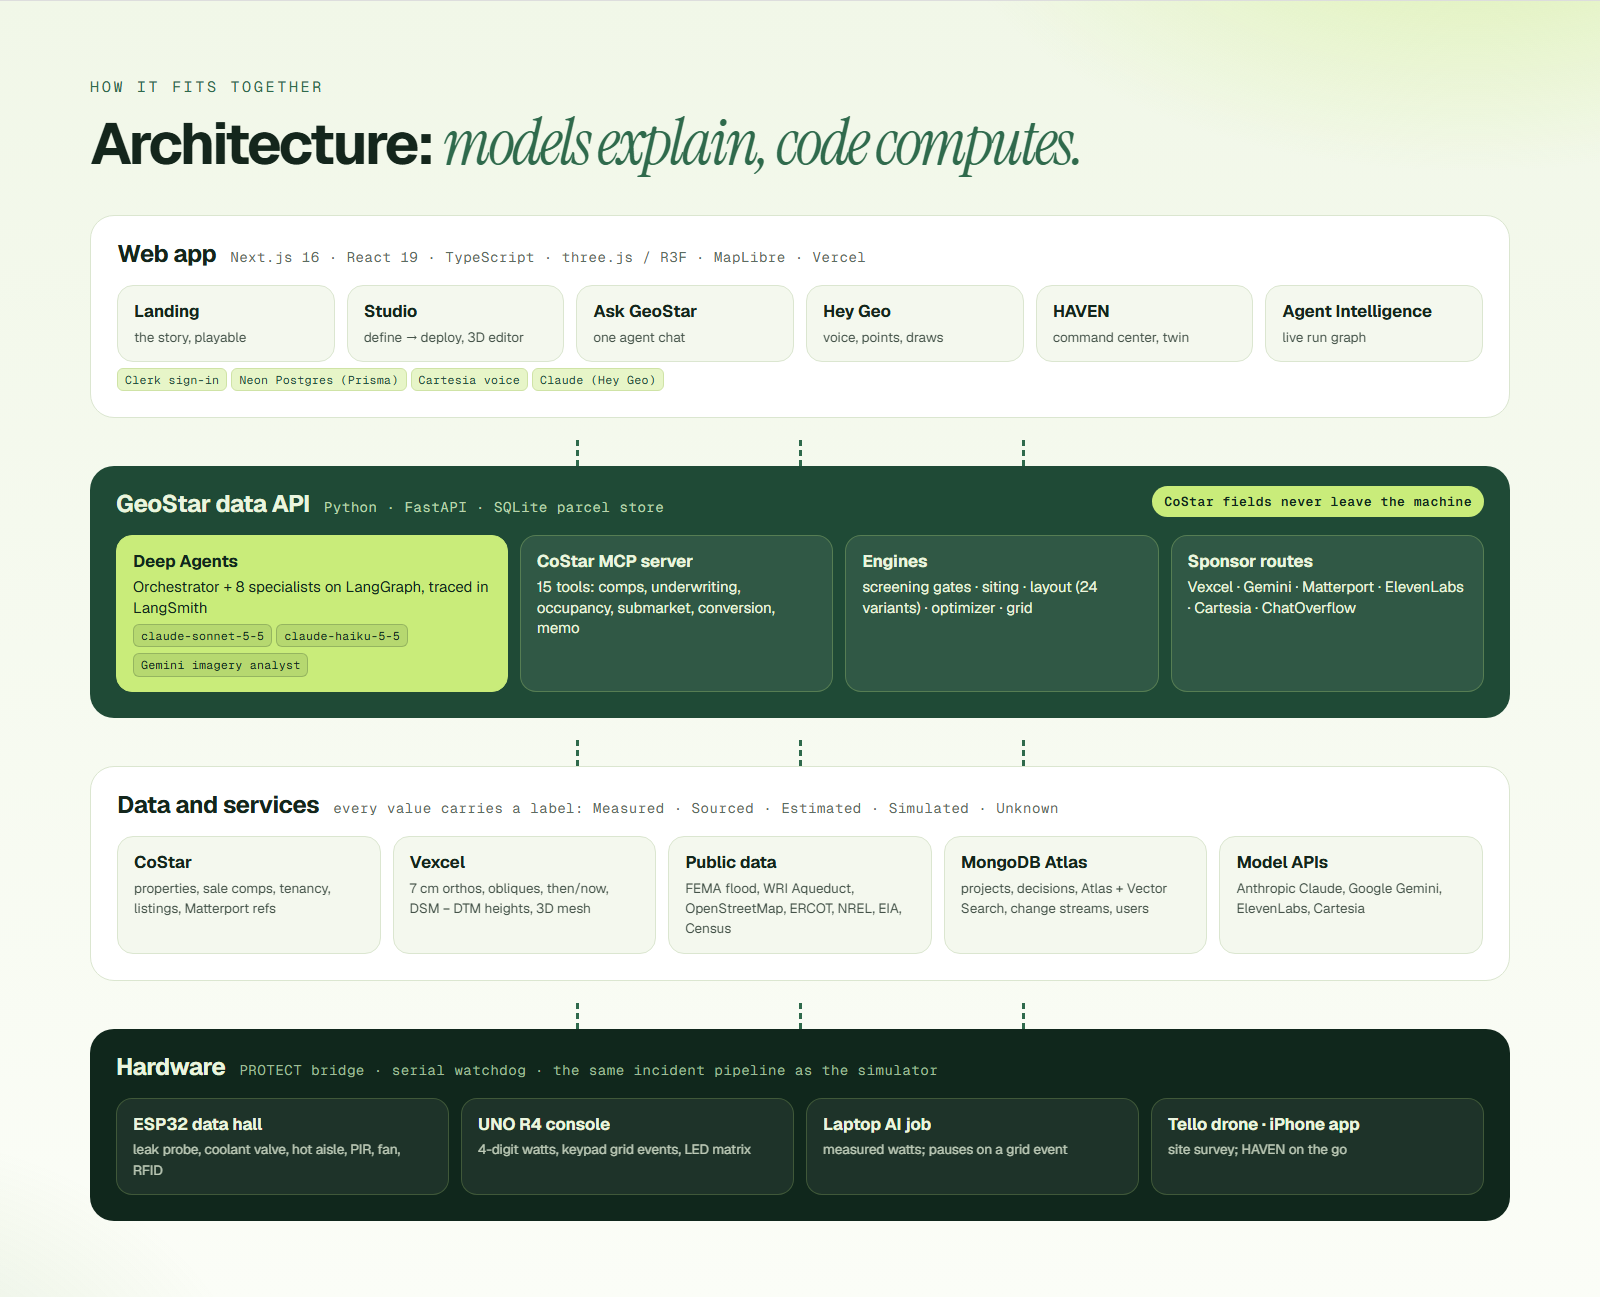
- Web app: Next.js 16, React 19, TypeScript, Tailwind CSS 4, deployed on Vercel
- 3D: three.js, React Three Fiber, drei, 3D Tiles renderer for the Vexcel city mesh
- Maps: MapLibre GL with OpenStreetMap tiles, Overpass for amenities
- Data API: Python and FastAPI, with a local SQLite store for the licensed CoStar extract
- Agents: LangChain Deep Agents SDK, LangGraph, LangSmith tracing, Anthropic Claude (Sonnet orchestrator, Haiku specialists), Google Gemini (imagery, documents, embeddings), MCP
- Data: CoStar (properties, comps, tenancy, listings), Vexcel (orthos, obliques, DSM/DTM, 3D mesh), Matterport scans, FEMA, WRI Aqueduct, OpenStreetMap, ERCOT, NREL, EIA, Census
- Storage: Neon Postgres through Prisma for projects, sensors, incidents and protection workspaces. MongoDB Atlas for Studio projects, decisions, Atlas Search, Vector Search, geo queries, change streams and user accounts
- Accounts: Clerk sign-in and sign-up, with users synced to Atlas
- Voice: Cartesia and ElevenLabs (Hey Geo, the voice guide, the emergency call)
- Hardware: ESP32 and Arduino UNO R4 firmware, a Python PROTECT bridge with a serial watchdog, and a Tello drone bridge
- Mobile: SwiftUI
- Tests: Node test runner, Playwright, pytest
- Go-live: one script starts the local services, opens a Cloudflare tunnel to the data API and redeploys Vercel with the tunnel address. Licensed data never leaves the laptop.
Each sponsor integration has its own folder on both sides of the app (services/api/app/sponsors/<name>/ and src/components/sponsors/<name>/). The full map is in docs/sponsors/.
Two rules shaped the build:
- Models explain, code computes. Scores, costs and gates come from deterministic functions. Agents decide what to look at and say what it means.
- Licensed data stays local. CoStar names, addresses, prices and coordinates don't go to MongoDB Atlas, to Gemini, or into model prompts and traces by default.
Challenges we ran into
- Keeping licensed data on the machine while using cloud models. Agents work with redacted records and evidence ids, and the app fills names back in locally. Citations are attached after the answer is written, from tool output the model never saw.
- Making an agent's answer checkable. Every number has to come from a tool, and every tool call is a visible event. A specialist whose conclusion disagrees with its own evidence gets flagged as a conflict.
- Hardware that tells the truth. Servos browned out the board, a silent serial port froze the console, and a queued badge tap once approved the wrong question. We added a serial watchdog, slow servo ramps, and taps that are matched to the question on screen.
- Speed. Site search took 4–11 s until a flat-map pre-filter cut the distance checks about tenfold, bringing it to around 1 s. Agent evaluations halved once the specialists ran together.
- Being honest about what is real. Much of a hackathon demo is simulated. We labelled every value by where it came from and marked every simulation on screen.
- One product from three ideas. Site selection, concept design and building protection started as separate builds. They now share one project, one visual language and one story.
Accomplishments that we're proud of
- A site that fails a hard gate can't be rescued by a good price.
- A real leak on the bench opens a real incident, sounds the alarm, shuts the valve and calls the contact. A manager's badge tap approves the response.
- The agent page draws its graph from real runtime events and reports its own architecture from the server.
- Gemini turns a 7 cm aerial into keep-out areas that the layout engine actually respects.
- HAVEN proposes and a person approves. Nothing reaches staff until someone says yes.
- A landing page a first-time visitor can play with: move a slider, finalize a building, spring a leak.
What we learned
- Provenance is a feature. People trust a number more when they can click it.
- Agents are most useful when they're narrow and the arithmetic is taken away from them.
- The quiet failures (water, wiring) make a better story than the alarm.
- Hardware forces honesty. A timeline that looks fine in a simulator falls apart when a real person taps a real card.
What's next for GeoStar
- Utility-confirmed capacity and interconnection timelines in place of distance-to-substation.
- More markets than Houston and Los Angeles.
- Real sensor deployments, starting with moisture and panel temperature.
- Layout generation for housing, solar and wind to match what data centers have today.
- Roles and teams on top of the new accounts, so an owner, an operator and a resident each see their own view.
Run it
Requires Node.js 22.12+ and npm, plus a Postgres database (Neon or local; see docs/database.md).
npm install
cp .env.example .env
npm run setup
npm run dev
Open http://127.0.0.1:3000.
/is the landing page: the story/studiois the Studio: define, discover, explore, analyze, deliver, then model, protect and deploy/studio/deploylists every deployed project and its Command Center/studio/agentis Agent Intelligence: how the AI works/studio/datais MongoDB Atlas, live/studio/built-withshows how we built it: ChatOverflow field notes/exploreis live operations: grid and hardware/projectsis the original workspace: discover, design, protect, report
Real sites, layouts and agents need the data API:
cd services/api
python -m venv .venv
.venv/Scripts/pip install -r requirements.txt
.venv/Scripts/python -m app.sponsors.costar.loader
.venv/Scripts/python -m uvicorn app.main:app --port 8000
On macOS or Linux the virtual environment's programs are in .venv/bin/. The loader needs the CoStar kit extracted outside the repo, with COSTAR_KIT_DIR set in .env. Agents need ANTHROPIC_API_KEY. Gemini, Vexcel, Matterport, MongoDB, Clerk, ElevenLabs and Cartesia are optional and switch on when their keys are set.
Setup details, hardware ingest, the calculations and the data API are in the technical reference. Hardware wiring and firmware are in hardware/README.md.
Tests
npm run typecheck
npm test
npm run test:e2e
Retake the screenshots and graphics
With the app running:
node scripts/readme-shots.mjs http://127.0.0.1:3000
node scripts/readme-graphics.mjs
What is real and what is simulated
- Site screening: real CoStar properties and public data (FEMA, WRI Aqueduct, OpenStreetMap). It runs locally with the CoStar kit.
- Aerials and heights: real Vexcel captures. Heights are measured (DSM − DTM). The site rectangle is assumed to be centred on the parcel point, because the true boundary isn't in the data.
- Grid prices: real ERCOT day-ahead prices. Carbon is estimated from the fuel mix.
- Grid capacity: a scenario until a utility confirms it. Distance to a substation is not capacity.
- Layouts and concept models: conceptual. They are not engineering or permit drawings.
- HAVEN incidents: simulated readings through a deterministic rules engine, unless the hardware kit is connected, in which case the readings are real and marked live.
- Emergency call: a real call to a configured contact, refused through the tunnel or a hosted page. It never dials 911.
- Exit routes: predefined demo routes. They are not a real-world safety verification.
- Workspace candidates and landing-page numbers: illustrative, and labelled so.
GeoStar is a planning prototype. It is not a property listing service, an engineering tool or a life-safety system.
Repository map
src/app/                         Next.js pages and API routes
src/components/landing/          landing page
src/components/studio/           the Studio: brief, plan, 3D model, design editor, deploy
src/components/hey-geo/          Hey Geo, the on-screen voice assistant
src/components/dashboard-2/      Protect, deploy and the HAVEN command center
src/components/sponsors/<name>/  sponsor UI: costar, langchain, vexcel, gemini, matterport, mongodb, elevenlabs, chatoverflow
src/components/workspace/        the /projects workspace
src/lib/                         engine, monitoring, report, HAVEN store, Hey Geo
services/api/                    FastAPI data service: engines, sponsors, agents, CoStar MCP server
prisma/                          Postgres schema, migrations and seed
protect/, hardware/              PROTECT bridge, ESP32 and UNO R4 firmware, wiring
twin/, bridge/, web/             live grid twin, Tello drone bridge, SiteStar site
mobile/                          iPhone app
docs/                            sponsor notes, technical reference, graphics, screenshots
tests/                           unit and browser tests


