-
-
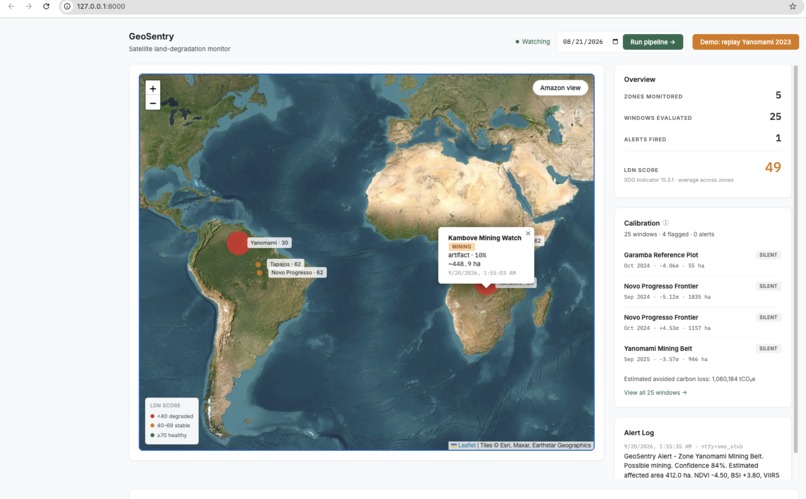
GeoSentry - frontend
-
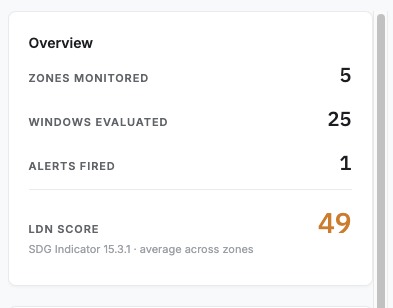
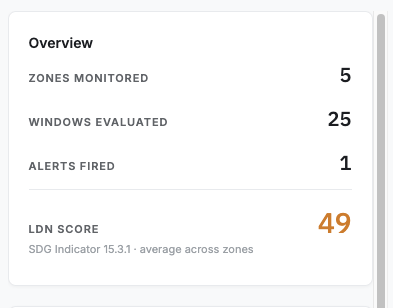
Overview: 5 zones monitored, 25 windows evaluated, 0 alerts fired, LDN score 56.
-
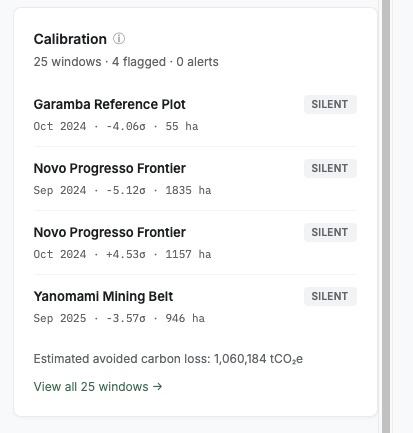
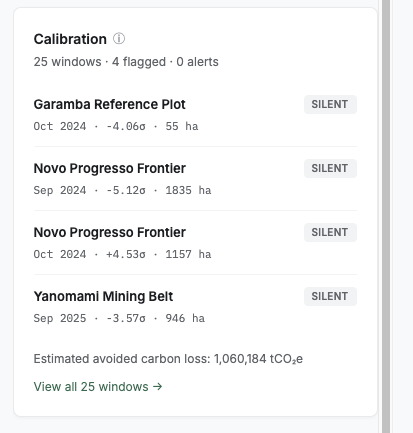
Calibration panel: 25 real historical windows, 4 events flagged, 0 alerts fired plus estimated avoided carbon loss
-
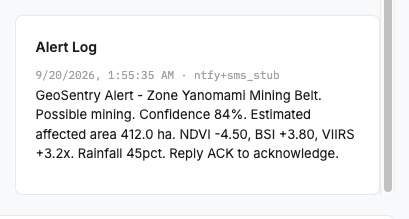
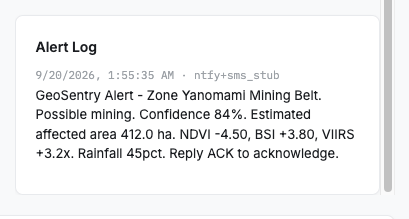
Alert log to get notified
-
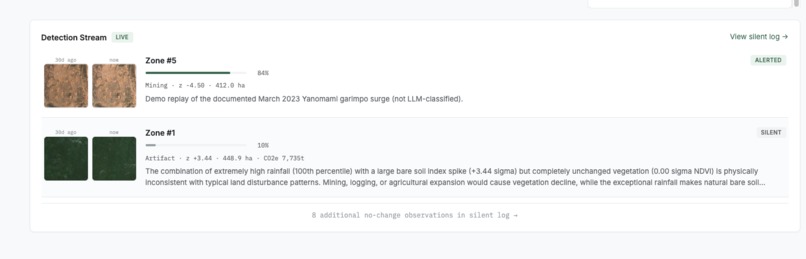
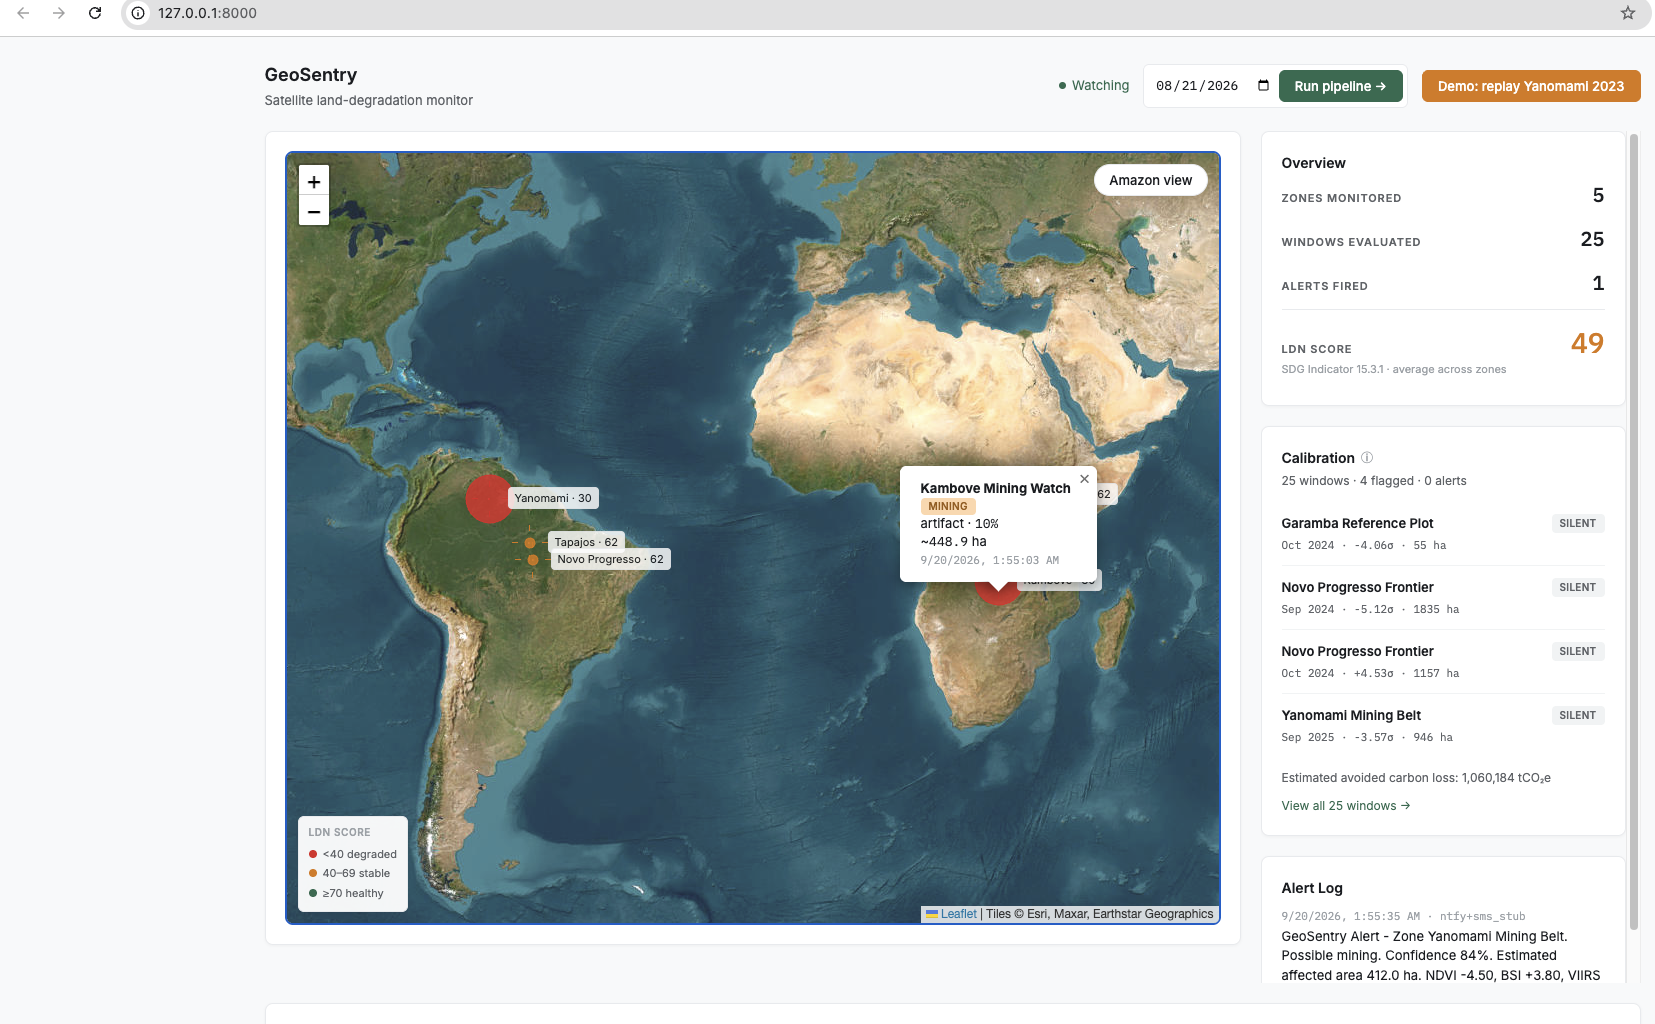
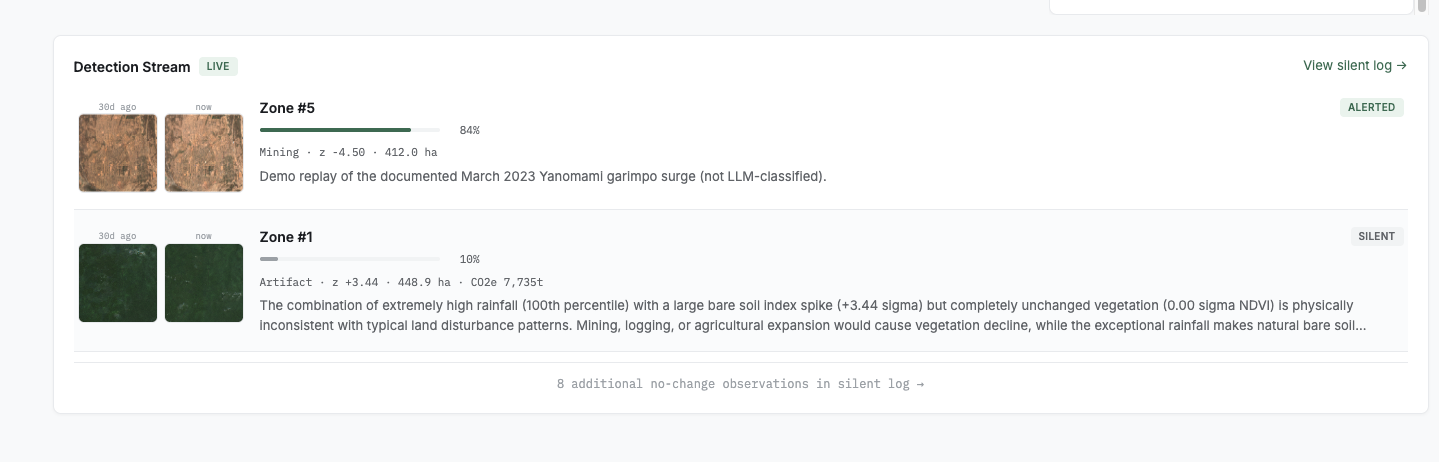
Detection Stream panel
-
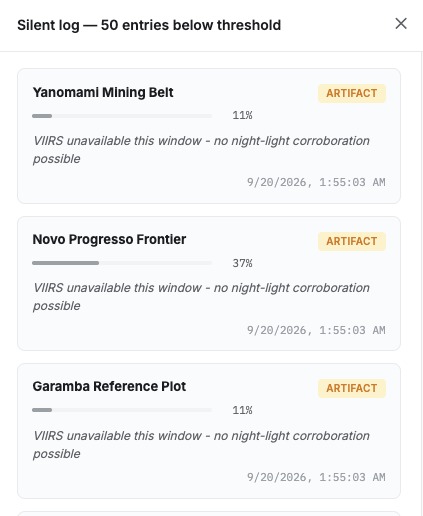
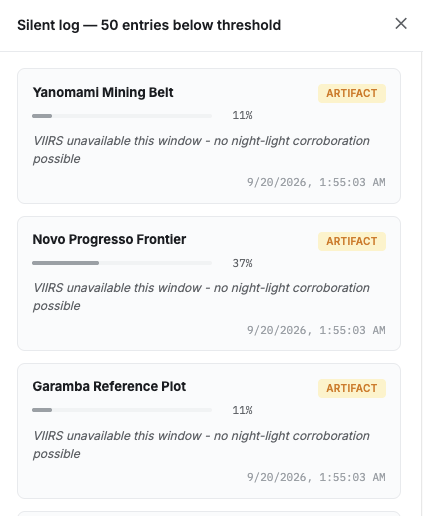
Silent log to display alerts that weren't fired
-
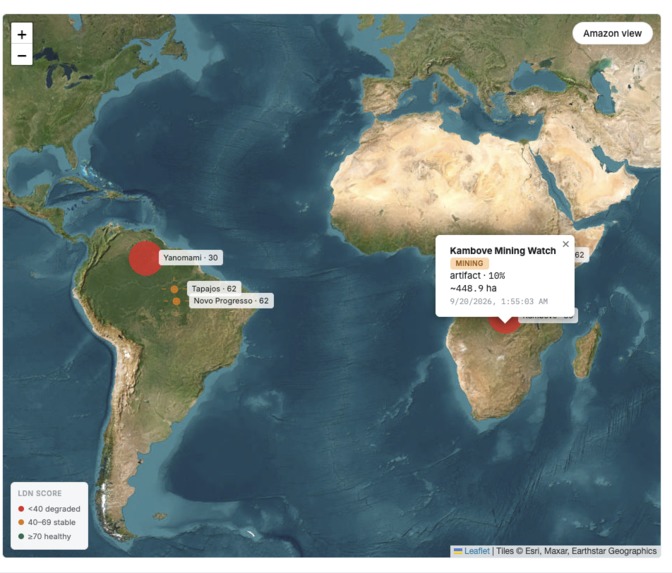
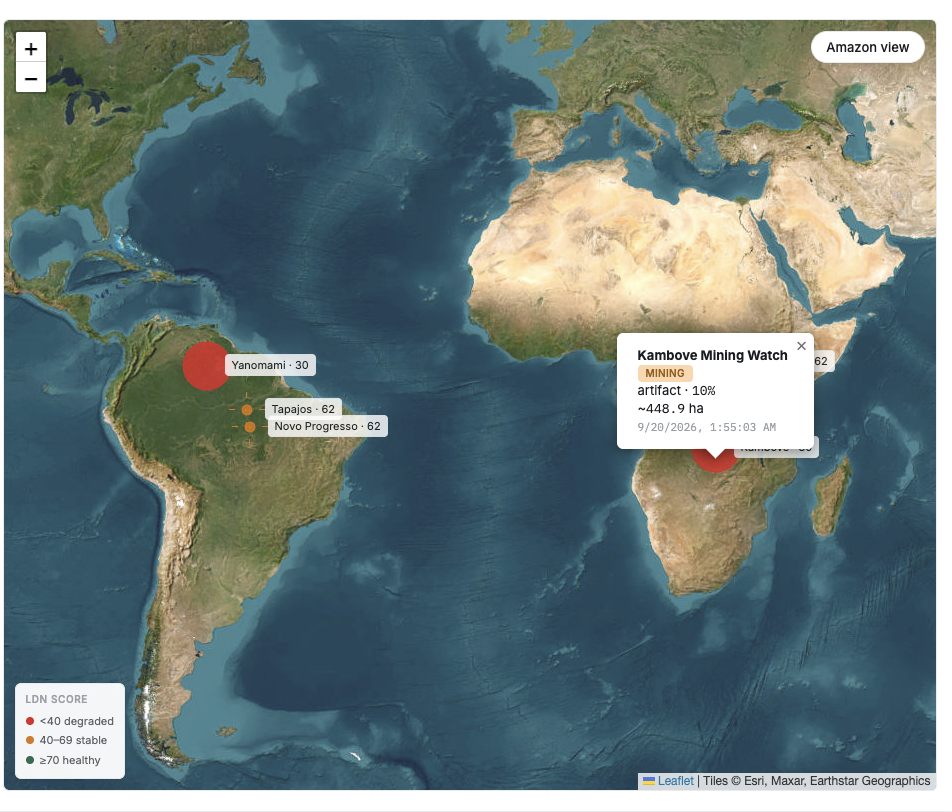
Zone map: 5 real AOIs across the Amazon, DRC, and Uganda tinted by live LDN score.
-
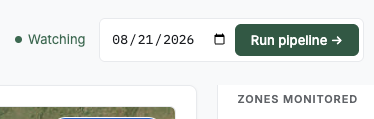
Run pipeline: executes the full detection pipeline against any historical date
-

GeoSentry's logo

Inspiration
Satellites have been photographing the entire planet for years. Sentinel-2 alone revisits every point on Earth every five days, at 10-meter resolution, free and public. The data to catch illegal mining and deforestation in near-real-time has existed for a decade.
And yet operations still run for weeks before anyone notices. Not because the satellites can't see it. Because somebody has to actually look at the pictures, and nobody is.
That gap bothered me. I kept thinking about the ranger in the Amazon who checks a satellite photo of a protected forest, sees nothing unusual, and moves on. Three weeks later, on patrol, they find 1,800 hectares gone. The mining operation had been there the whole time. The pixels were there. Nobody was looking at the right one on the right day.
So I wanted to build the opposite of a dashboard. Something that watches continuously and only pings you when it's actually sure.
Because a monitoring system that fires alerts every day is a system you learn to ignore, and a system you ignore is worthless.
What I built
GeoSentry is a satellite land-degradation monitor.
It watches five real zones:
- Three in the Amazon
- One in the DRC cobalt belt
- One control zone inside Garamba National Park
It uses real Sentinel-2, VIIRS, and CHIRPS data through Google Earth Engine.
When indicators cross a threshold, GeoSentry does not immediately fire an alert. It runs three independent checks:
- An LLM, Claude Sonnet 4.5, classifies the likely cause: mining, logging, agricultural expansion, drought, or sensor artifact
- CHIRPS rainfall data helps rule out seasonal drought
- VIIRS night-light radiance confirms or denies extraction-like activity
Everything fuses into a single confidence score using a naive-Bayes update.
Above 0.72, GeoSentry fires one plain-language alert. Below 0.72, it stays silent and logs the computed reason.
The system also computes an SDG Indicator 15.3.1-aligned Land Degradation Neutrality score per zone and an IPCC 2006 carbon-loss estimate in tCO₂e for every flagged detection.
How I built it
Backend: Python 3.10, FastAPI, SQLite via SQLModel, Google Earth Engine Python API with service-account authentication, and the Anthropic SDK for Claude calls.
Frontend: Vanilla JavaScript in a single-file HTML application. Leaflet handles the map, Esri World Imagery provides the satellite basemap, and Natural Earth provides country boundaries. IBM Plex Mono is used for numeric readouts and Inter for prose.
The baseline math
For each zone and calendar month, I pool every cloud-masked Sentinel-2 observation from the previous three years into a single distribution and compute the median absolute deviation.
For each current observation:
$$z=\frac{x_{\mathrm{current}}-\operatorname{median}(X_{\mathrm{baseline}})}{1.4826\cdot\operatorname{MAD}(X_{\mathrm{baseline}})}$$
The constant (1.4826) makes MAD a consistent estimator for the standard deviation of a normal distribution.
The fusion
Confidence starts at a prior of (0.05), representing the base rate that a randomly chosen zone is actively being disturbed on a given day.
Each independent piece of evidence multiplies the odds by a likelihood ratio:
$$\mathrm{Posterior\ Odds}=\frac{0.05}{0.95}\times LR_{\mathrm{LLM}}\times LR_{\mathrm{VIIRS}}\times LR_{\mathrm{rain}}\times LR_{\mathrm{area}}$$
The LLM term is magnitude-scaled. A classification at (0.85) confidence contributes roughly (4\times) to the odds, while a classification at (0.32) confidence contributes less than (1).
That means a low-confidence classification becomes evidence against the hypothesis, not evidence for it.
This was a bug in the first version. I was treating a hedged LLM answer as a positive signal.
It took seeing a 32% confidence classification clear the alert gate to notice.
The corroboration
VIIRS monthly composites lag real time by one to two months.
When the corroborator is genuinely unavailable, the code returns None, and the fusion skips that likelihood ratio entirely.
The posterior is lower because the evidence set is smaller.
A missing signal is not a silent signal.
Challenges
Challenge 1: Small-sample variance estimation is fragile
My first baseline implementation computed per-year median NDVI over three years, then took MAD across those three scalar values.
When I ran it on real DRC data, the MAD came back as 0.0001, essentially zero.
The math wasn't wrong.
The approach was.
When two of three yearly values cluster closely, which they often do, the median of absolute deviations collapses to the gap between the two close values, regardless of how far the third point sits.
With that MAD, a sub-pixel NDVI change of only (0.001) would produce:
$$z\approx6.6$$
Every zone would have fired on noise.
The fix was to stop collapsing each year into a scalar and instead pool every cloud-masked pixel from every observation into one distribution.
That gave me 20 to 44 real observations per zone instead of 3.
MAD values came back in the range:
$$0.009\text{ to }0.032$$
Those values were physically plausible, statistically stable, and the z-scores finally meant something.
Challenge 2: LLM classification isn't evidence if the prompt is wrong
I discovered this late.
Claude was wrapping its JSON responses in Markdown code fences, which broke my parser and silently triggered the synthetic fallback path.
The reasoning text looked identical to the heuristic output, so I didn't notice for weeks.
I only caught it when I added a real API key and compared outputs.
The "real Claude" classification was reading verbatim from the fallback.
One regex fix later, all four historical candidates were reclassified by the real model.
The Novo Progresso event, which the heuristic had classified as:
$$\mathrm{Drought\ at\ }32\%\mathrm{\ confidence}$$
became:
$$\mathrm{Agricultural\ expansion\ at\ }85\%\mathrm{\ confidence}$$
with Claude specifically citing the BR-163 corridor.
The model knew the region.
Challenge 3: The system stayed silent, and I had to decide whether that was a failure
After building everything, I ran the pipeline against 25 real historical windows across five zones.
It flagged four physical events.
It fired zero alerts.
The Novo Progresso detection was the most striking:
- 1,835 hectares of canopy loss
- (-5.12\sigma) NDVI
- Claude classification at 85% confidence
Rainfall conflicted with the classification.
The fused posterior came out at:
$$P=0.08$$
The alert did not fire.
I could have lowered the gate to make it fire.
It would have looked better on camera.
But then the alert would stop meaning anything.
An alert that fires whenever the evidence is strong, while ignoring whether it is corroborated, is just a dashboard with a lower bar.
So I left the threshold at:
$$P_{\mathrm{alert}}=0.72$$
The demo now shows both behaviors:
- 25 silent windows
- A "Replay a Confirmed Event" button that routes a documented 2023 garimpo surge through the real fusion pipeline
Same math.
Same gate.
Same ntfy push.
The phone buzzes. The contrast is the product.
What I learned
Robust statistics matter at small samples.
A MAD computed over three scalar values is not the same quantity as a MAD computed over forty pixel observations.
The first is noise. The second is a measurement.
An LLM's confidence score is not automatically positive evidence.
Below roughly (0.5), the classification can become evidence against the hypothesis.
The fusion math has to reflect that.
Missing data must be distinguishable from silent data.
VIIRS unavailable and VIIRS reading zero are different facts.
$$\mathrm{Unavailable}\neq0$$
The first means lower confidence.
The second is negative evidence.
Conflating them corrupts the posterior.
Google Earth Engine is powerful and slow.
A single reduceRegion over a three-year window can take 10 to 15 seconds.
Parallelization and caching are not optional.
A monitor that never fires is a hard sell. Even to myself.
I rebuilt the demo three times before landing on the honest framing.
The silence is the feature, and the one fired alert proves the gate works.
If I had more time
Replace the LLM with a fine-tuned classifier once labelled data exists.
Claude was the right starting point because it works on day one without training data, but a purpose-built model trained on confirmed events would be more consistent.
Compute a real NDVI trend slope for the LDN score's productivity sub-indicator.
It currently uses a documented neutral value of (50) because the baseline pipeline collapses the historical data into median + MAD and discards the year-over-year series required to compute a slope.
Scale zone coverage beyond five.
The pipeline can handle any AOI.
The current zones are the demo set, not the limit.
Get this into the hands of someone doing the patrols and calibrate the confidence gate against real ground truth.
Built With
- chirps)
- claude-sonnet-4.5
- fastapi
- google-earth-engine-(sentinel-2
- javascript
- leaflet.js
- python
- sqlite
- vanilla
- viirs


Log in or sign up for Devpost to join the conversation.