-
-

GeoSentinel
-
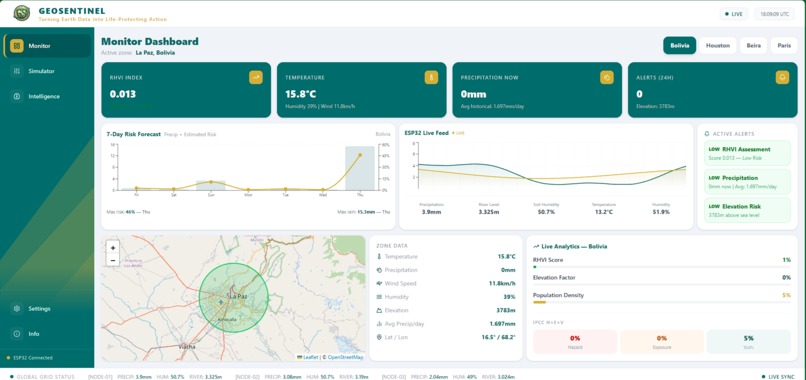
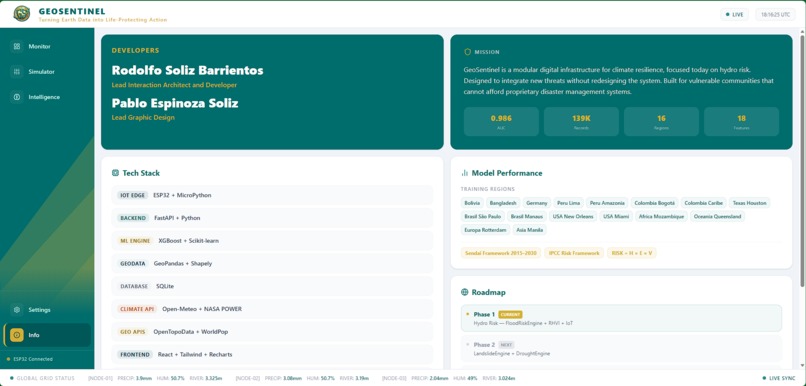
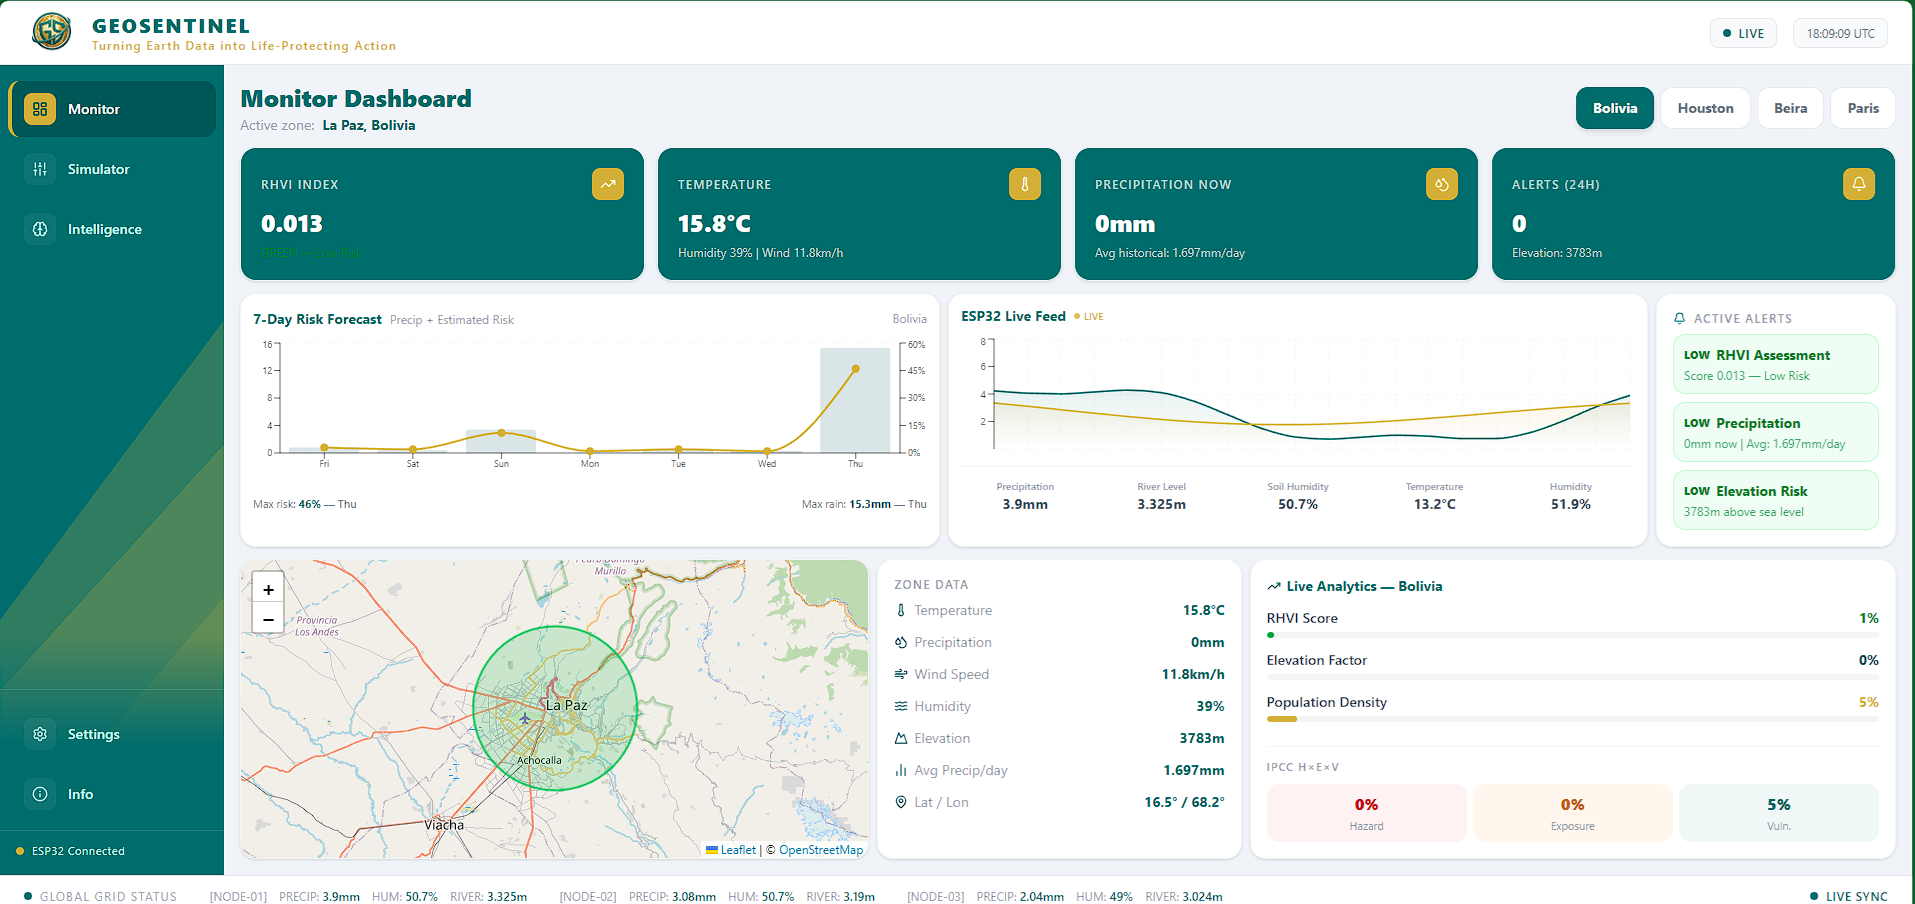
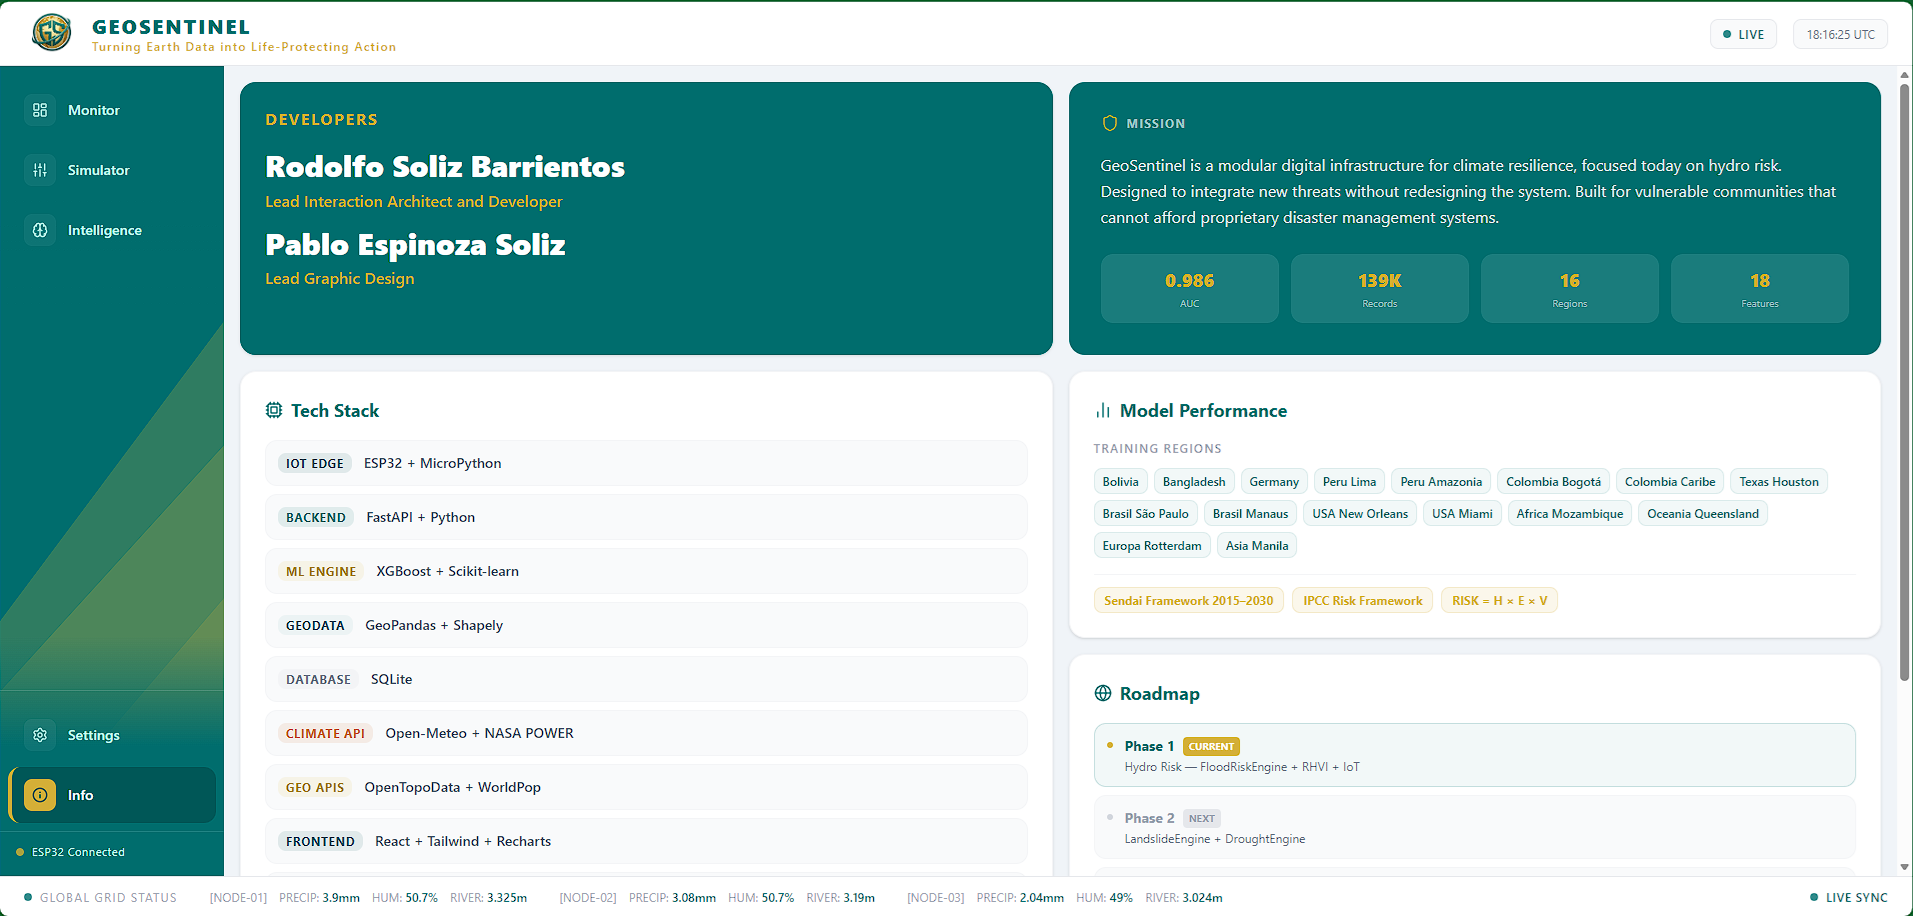
Dashboard 1
-

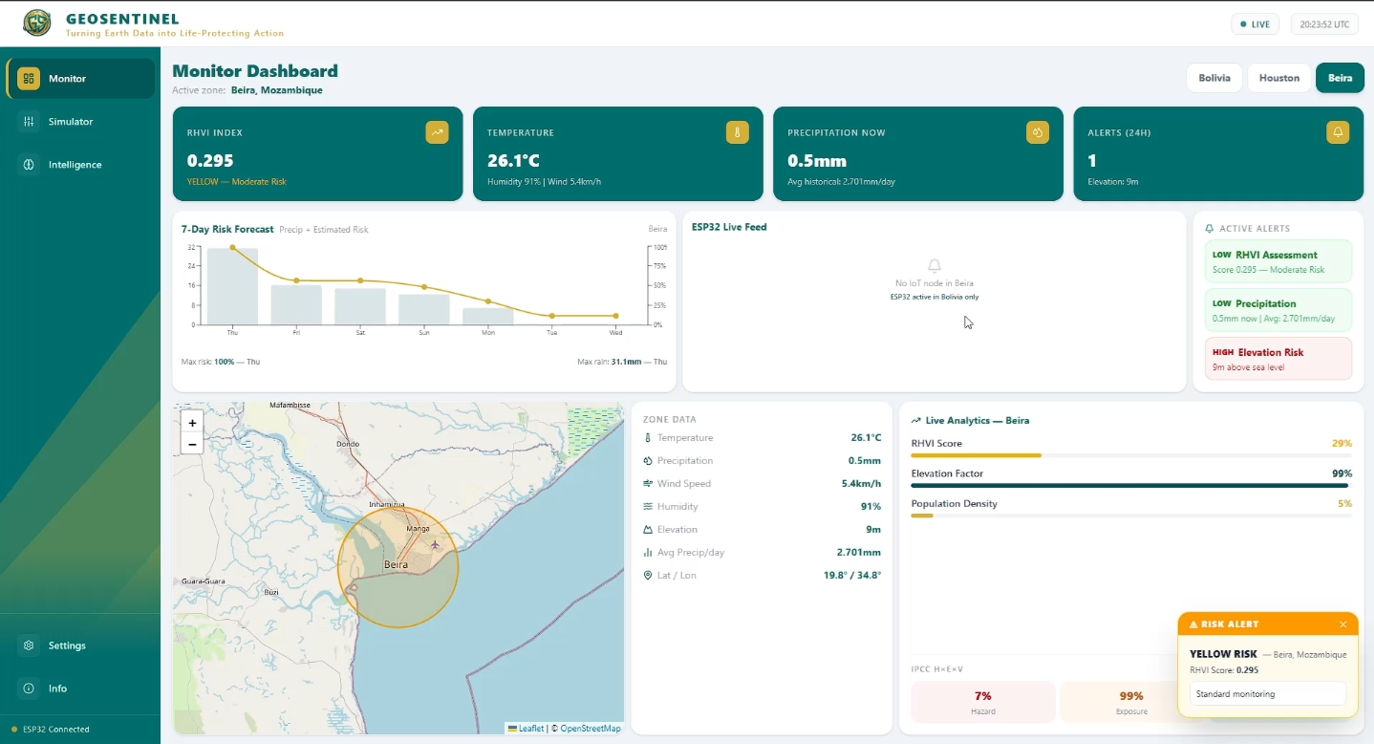
Dashboard 2
-
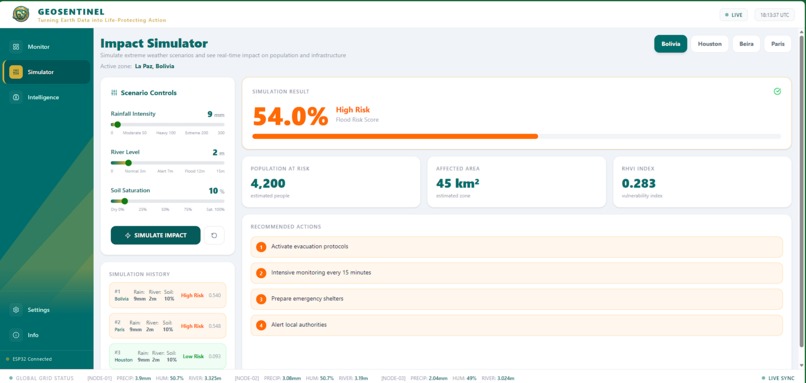
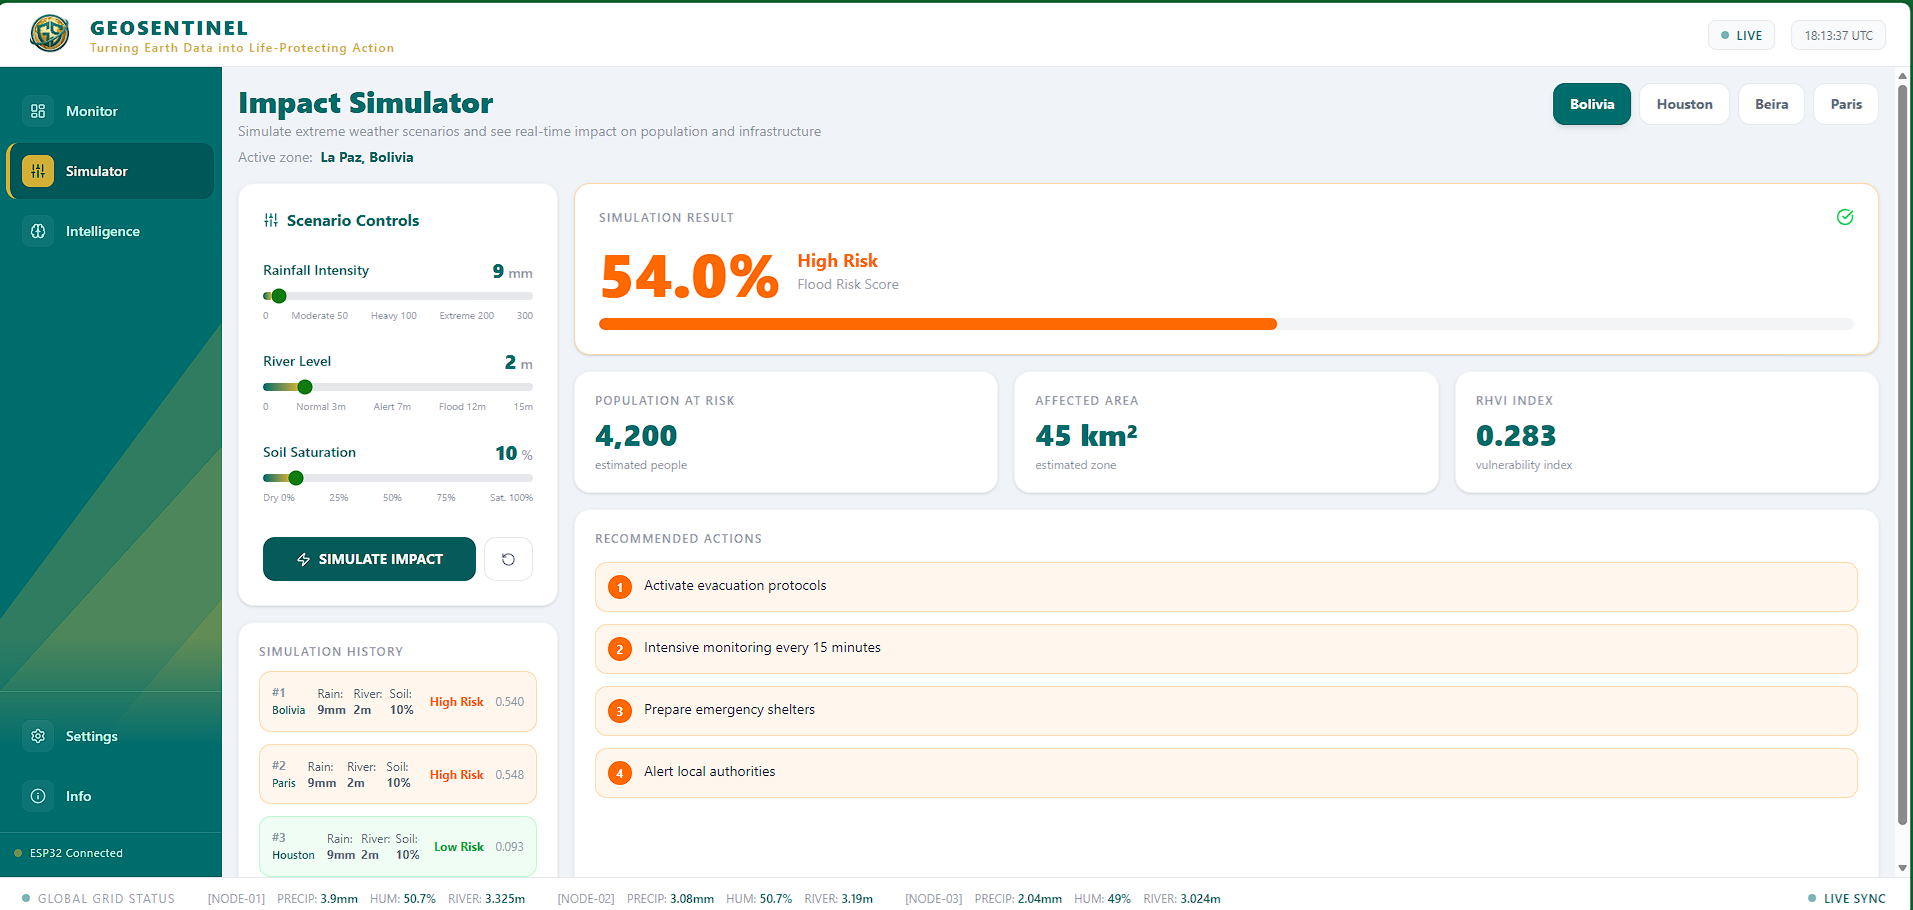
Secction Impact Simulator
-
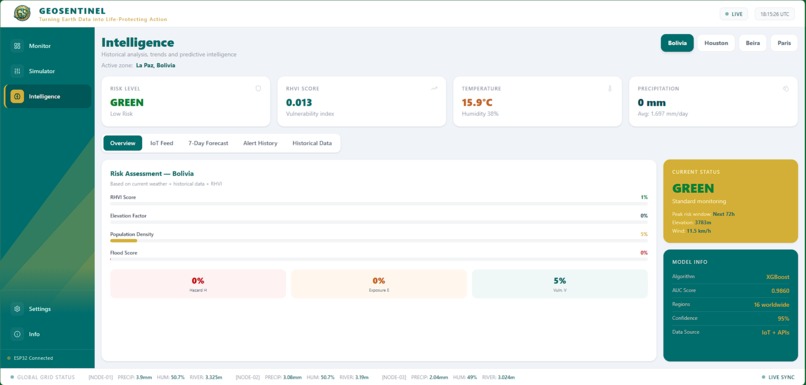
Secction Intelligence
-
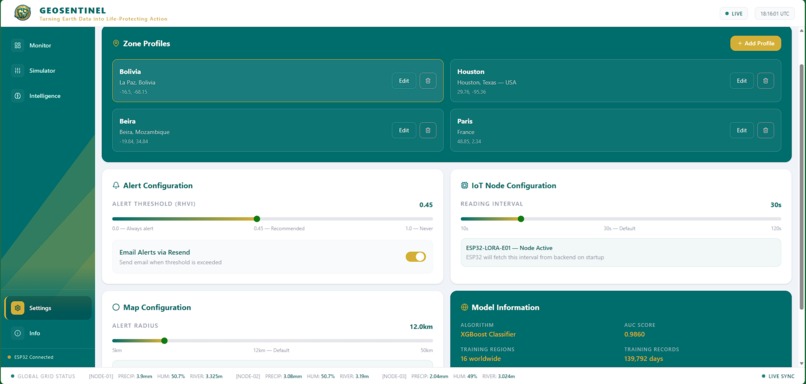
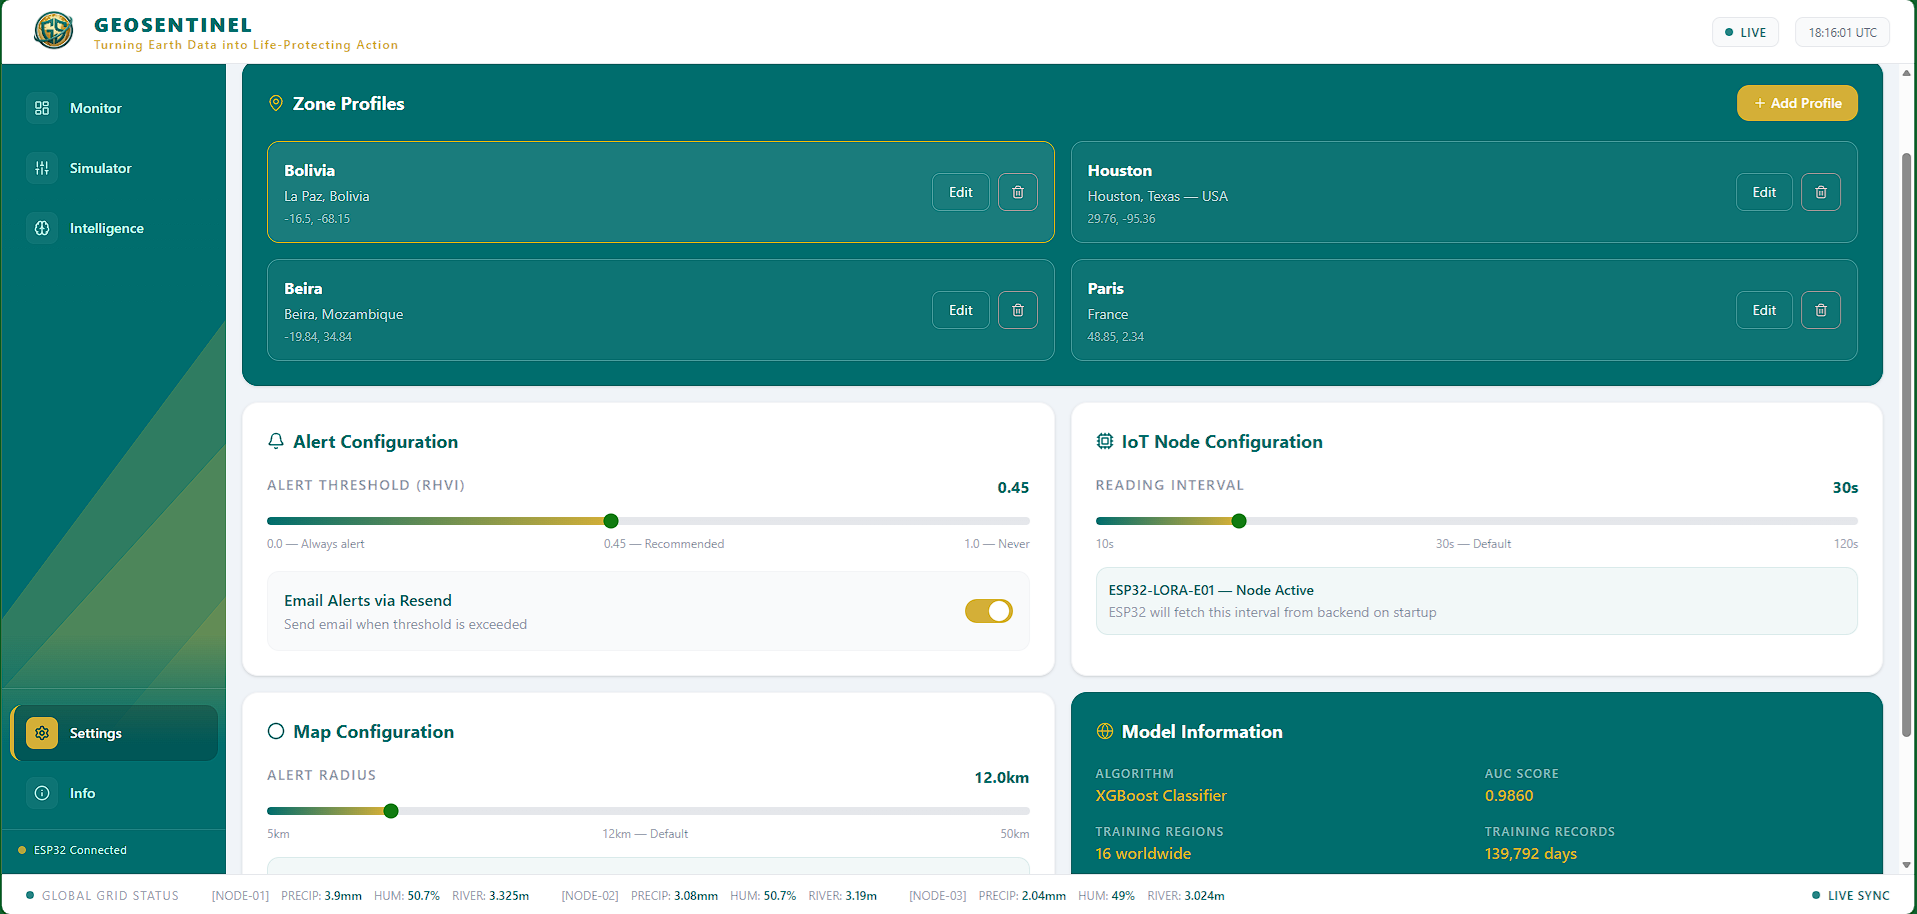
Secction Settings
-
Secction Info
-
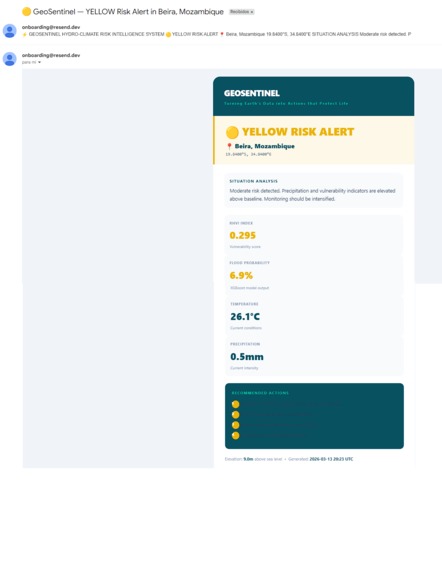
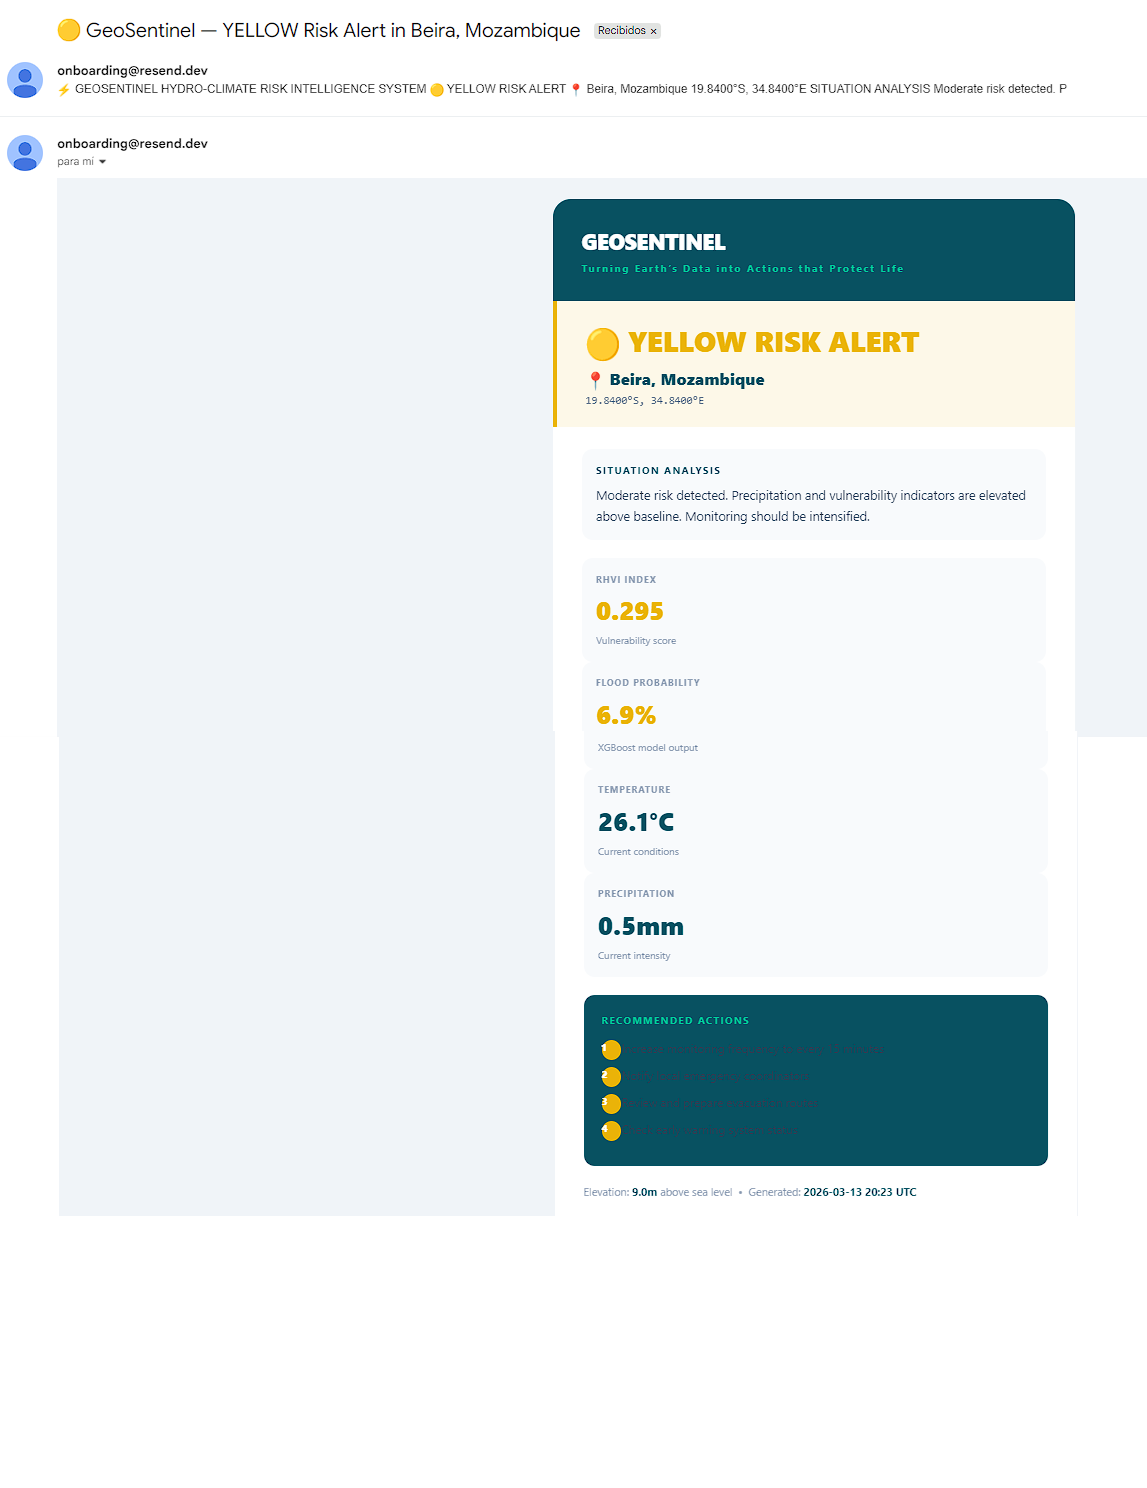
Alert email
-
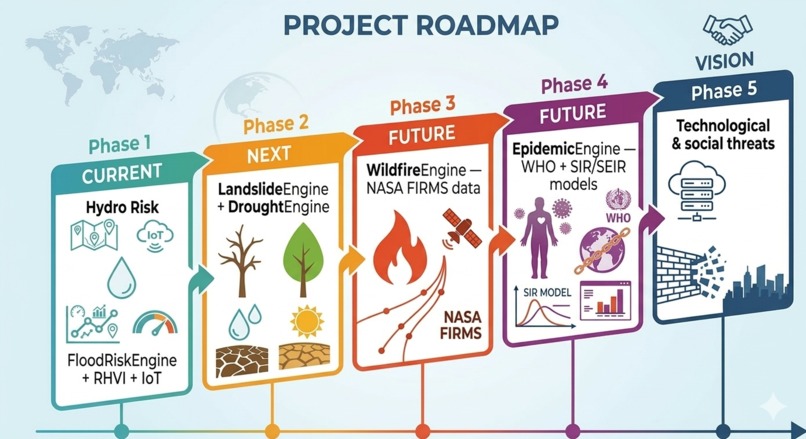
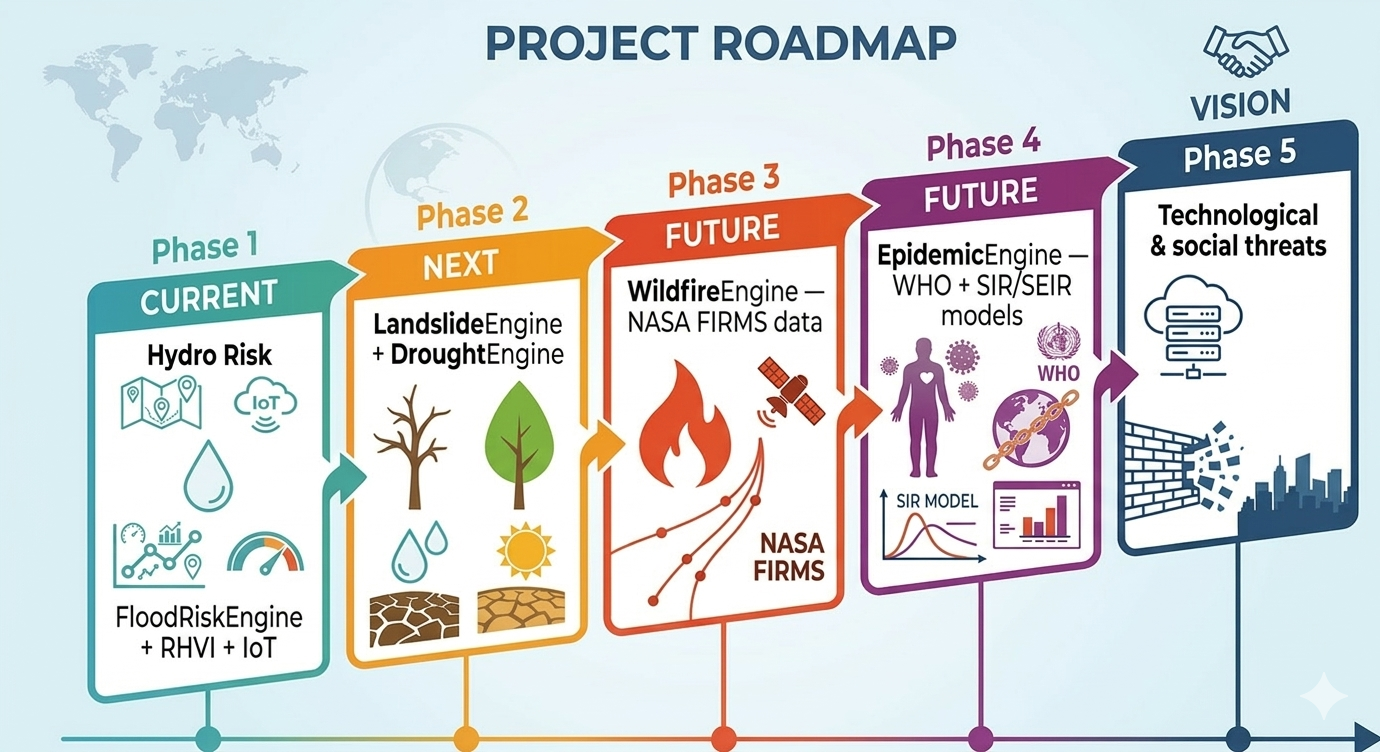
Roadmap
-
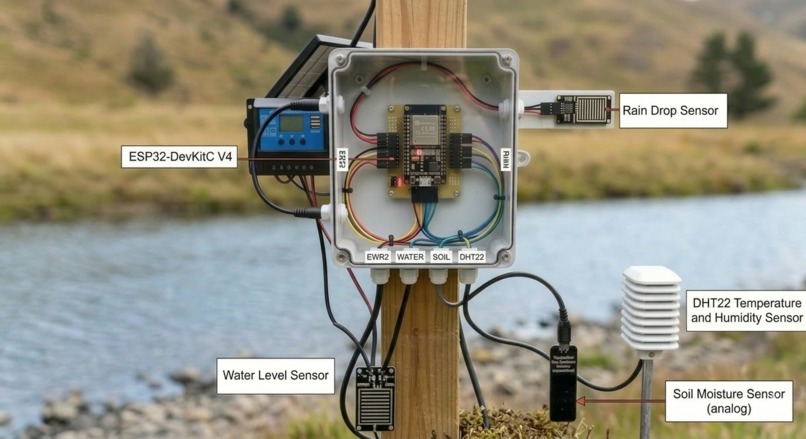
IoT system with ESP32


Inspiration
Bolivia loses an average of $500 million per year to climate disasters — and no one is exempt.
In the capital, La Paz, streets turn into rivers within minutes. A city built inside a canyon, where every heavy rain funnels directly into urban neighborhoods, overwhelming drainage systems and catching residents off guard. In the lowlands, entire rural communities are cut off for weeks. Indigenous villages along riverbanks watch the water rise with no warning and no way out. Farmers lose entire harvests overnight.
The threat doesn't discriminate between city and countryside. It just hits harder where there's less information.
GeoSentinel was born from that reality — built in Bolivia, for Bolivia first, but designed from day one to scale to every vulnerable community on the planet that faces the same gap between what the data knows and what the people know. Because the tools to save lives already exist. They just haven't reached the right hands yet.
What it does
GeoSentinel calculates a RHVI score (Regional Hydro-climate Vulnerability Index) for any geographic coordinate, combining three dimensions:
$$RHVI = H \times 0.5 + E \times 0.3 + V \times 0.2$$
Where:
- ( H ) = Hazard — XGBoost flood probability score based on current weather
- ( E ) = Exposure — Terrain elevation from NASA/OpenTopoData
- ( V ) = Vulnerability — Population density from WorldPop
The result is a single color-coded risk level that can be interpreted instantly by decision makers or communities:
| Level | RHVI Range | Action |
|---|---|---|
| 🟢 GREEN | ( RHVI < 0.25 ) | Monitor |
| 🟡 YELLOW | ( 0.25 \leq RHVI < 0.50 ) | Prepare |
| 🟠 ORANGE | ( 0.50 \leq RHVI < 0.75 ) | Alert |
| 🔴 RED | ( RHVI \geq 0.75 ) | Evacuate |
When risk crosses the threshold ( RHVI \geq 0.45 ), the system automatically sends email alerts with situation analysis and recommended actions — not just a generic warning.
Key features
- Interactive Leaflet map with real-time risk overlay
- 7-Day Risk Forecast combining precipitation and flood probability
- Live IoT feed from a physical ESP32 sensor node
- 3 pre-configured profiles: Bolivia, Houston TX, Beira Mozambique
- Scenario simulator with adjustable rainfall, river level and soil saturation
How we built it
Machine Learning
We trained an XGBoost classifier on 139,792 historical records across 16 flood-prone regions on 6 continents, achieving:
$$AUC\text{-}ROC = 0.9860$$
The model uses 18 engineered features including multi-day precipitation accumulations:
$$P_{7d} = \sum_{i=0}^{6} P_{t-i}, \quad P_{anomaly} = P_{7d} - \overline{P}_{historical}$$
And seasonal encoding using sine/cosine transforms to capture cyclical patterns:
$$season_sin = \sin\left(\frac{2\pi \cdot dayofyear}{365}\right), \quad season_cos = \cos\left(\frac{2\pi \cdot dayofyear}{365}\right)$$
Backend
Built with FastAPI + SQLAlchemy (SQLite). IoT readings from the ESP32 are persisted in SQLite for historical analysis and dashboard visualization. Data from four free external APIs:
- Open-Meteo (real-time weather + 7-day forecast)
- NASA POWER (30-year historical baseline)
- OpenTopoData (terrain elevation)
- WorldPop (population density)
Frontend
Built with React 18 + Vite + Tailwind CSS, using Recharts for analytics visualization and Leaflet for interactive maps. Deployed on Railway.
IoT
A physical ESP32 microcontroller running MicroPython collects environmental data using sensors for rainfall, water level, soil humidity, and temperature. The device sends readings every 30 seconds via HTTP POST to the backend.
Challenges we ran into
Data pipeline at scale — Downloading 24 years of daily climate data for 16 regions from Open-Meteo required careful rate limit management (1 request/minute on the free tier). We built a sequential downloader with automatic retry logic.
RHVI calibration — Balancing the three components ( H ), ( E ), ( V ) required multiple iterations. A purely model-based score ignored geographic vulnerability; a purely elevation-based score ignored real-time conditions. The weighted formula ( H \times 0.5 + E \times 0.3 + V \times 0.2 ) was validated against known historical flood events.
ESP32 connectivity in production — The IoT node initially pointed to a local IP address. Migrating to the Railway production URL required careful handling of HTTPS on MicroPython's urequests library, which has limited SSL support compared to standard Python.
React production build — Vite's automatic JSX runtime works seamlessly in development but required explicit hook imports (useEffect, useContext) in every component for the production bundle to compile correctly.
Model versioning on Railway — The trained .pkl file couldn't be committed to GitHub due to size constraints. We implemented an automatic training script (startup.py) that detects the missing model on first deploy and trains it from the committed dataset.
Accomplishments that we're proud of
- Achieving ( AUC = 0.9860 ) on a self-built dataset with no external labeled flood data — only engineered features from raw climate records
- Building a fully functional end-to-end system in 10 days: from raw climate CSVs to a live production URL with real IoT hardware sending data
- The RHVI index working correctly across geographically diverse profiles — La Paz at 3,600m elevation, Houston at sea level, and Beira on the Mozambique coast all produce contextually accurate risk scores
- Zero paid APIs — the entire platform runs on free-tier services
What we learned
- Feature engineering matters more than model complexity. The 7-day and 14-day precipitation accumulations, anomaly scores, and seasonal encodings contributed more to AUC than hyperparameter tuning.
- Production deployments surface bugs that development never does. Every implicit React import, every hardcoded local path, every localhost URL — they all work perfectly locally and break immediately in production.
- IoT + ML integration is powerful but fragile. The physical sensor data adds real credibility to the platform, but the pipeline from ESP32 → Railway → React requires every layer to be stable simultaneously.
What's next for GeoSentinel
Short term
- Add landslide and extreme heat risk modules using the same RHVI framework
- Mobile-responsive UI for field operators
- Multi-language support (Spanish priority for Latin America)
Medium term
Expand to real-time flood detection using satellite imagery with a CNN layer on top of the existing XGBoost score:
$$RHVI_{enhanced} = \alpha \cdot XGBoost + \beta \cdot CNN_{satellite} + \gamma \cdot IoT_{ground}$$
Long term — The GeoSentinel Roadmap
GeoSentinel is designed as an expandable multi-hazard intelligence platform. Each phase adds a new risk engine while sharing the same RHVI framework, data pipeline, and alert infrastructure:
| Phase | Status | Engine | Data Sources |
|---|---|---|---|
| 1 | Current | FloodRiskEngine + RHVI + IoT | Open-Meteo, NASA, WorldPop, ESP32 |
| 2 | Next | LandslideEngine + DroughtEngine | Soil moisture, slope gradient, NDVI |
| 3 | Future | WildfireEngine | NASA FIRMS real-time fire data |
| 4 | Future | EpidemicEngine | WHO data + SIR/SEIR models |
| 5 | Vision | Technological & social threats | Multi-source risk fusion |
The unified risk score across all engines follows the same formula structure:
$$GeoSentinel_{global} = \sum_{k=1}^{n} w_k \cdot Engine_k(H, E, V)$$
Where each engine contributes a weighted hazard component to a global vulnerability score for any point on Earth.
The vision: a single platform that tells any community, anywhere, what threats are approaching — floods, droughts, fires, disease outbreaks — and what to do about it.
Because the next Cyclone Idai is already forming somewhere.
And this time, the people in its path will know it's coming.
Built With
- css
- fastapi
- geopandas
- javascript
- nasa-power
- open-meteo
- opentopodata
- python
- railway
- react
- recharts
- scikit-learn
- sqlalchemy
- sqlite
- vite
- xgboost


Log in or sign up for Devpost to join the conversation.