

Inspiration
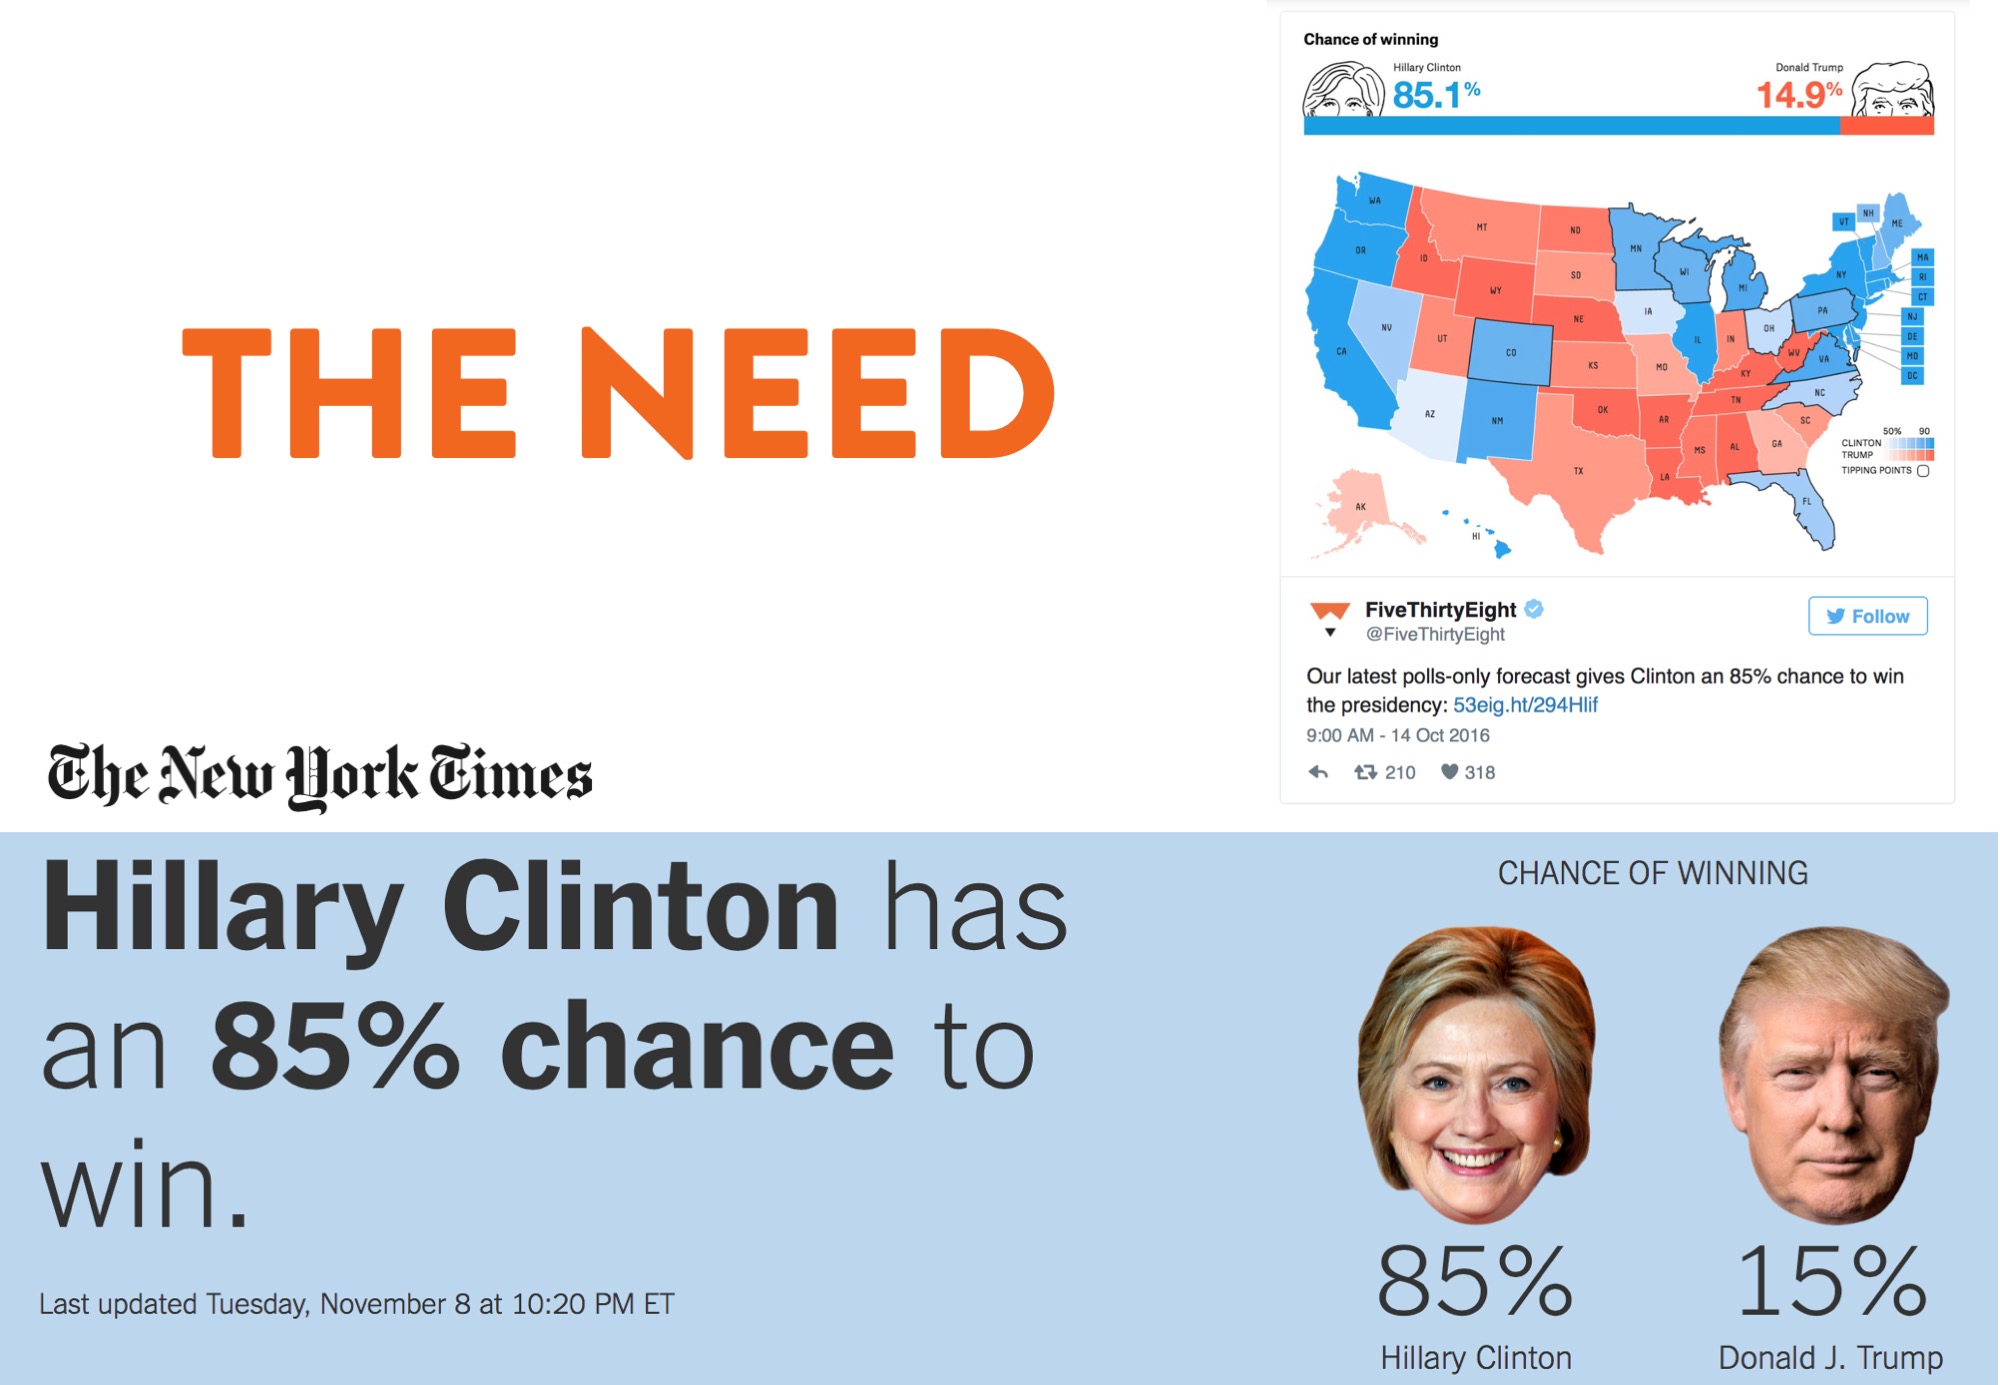
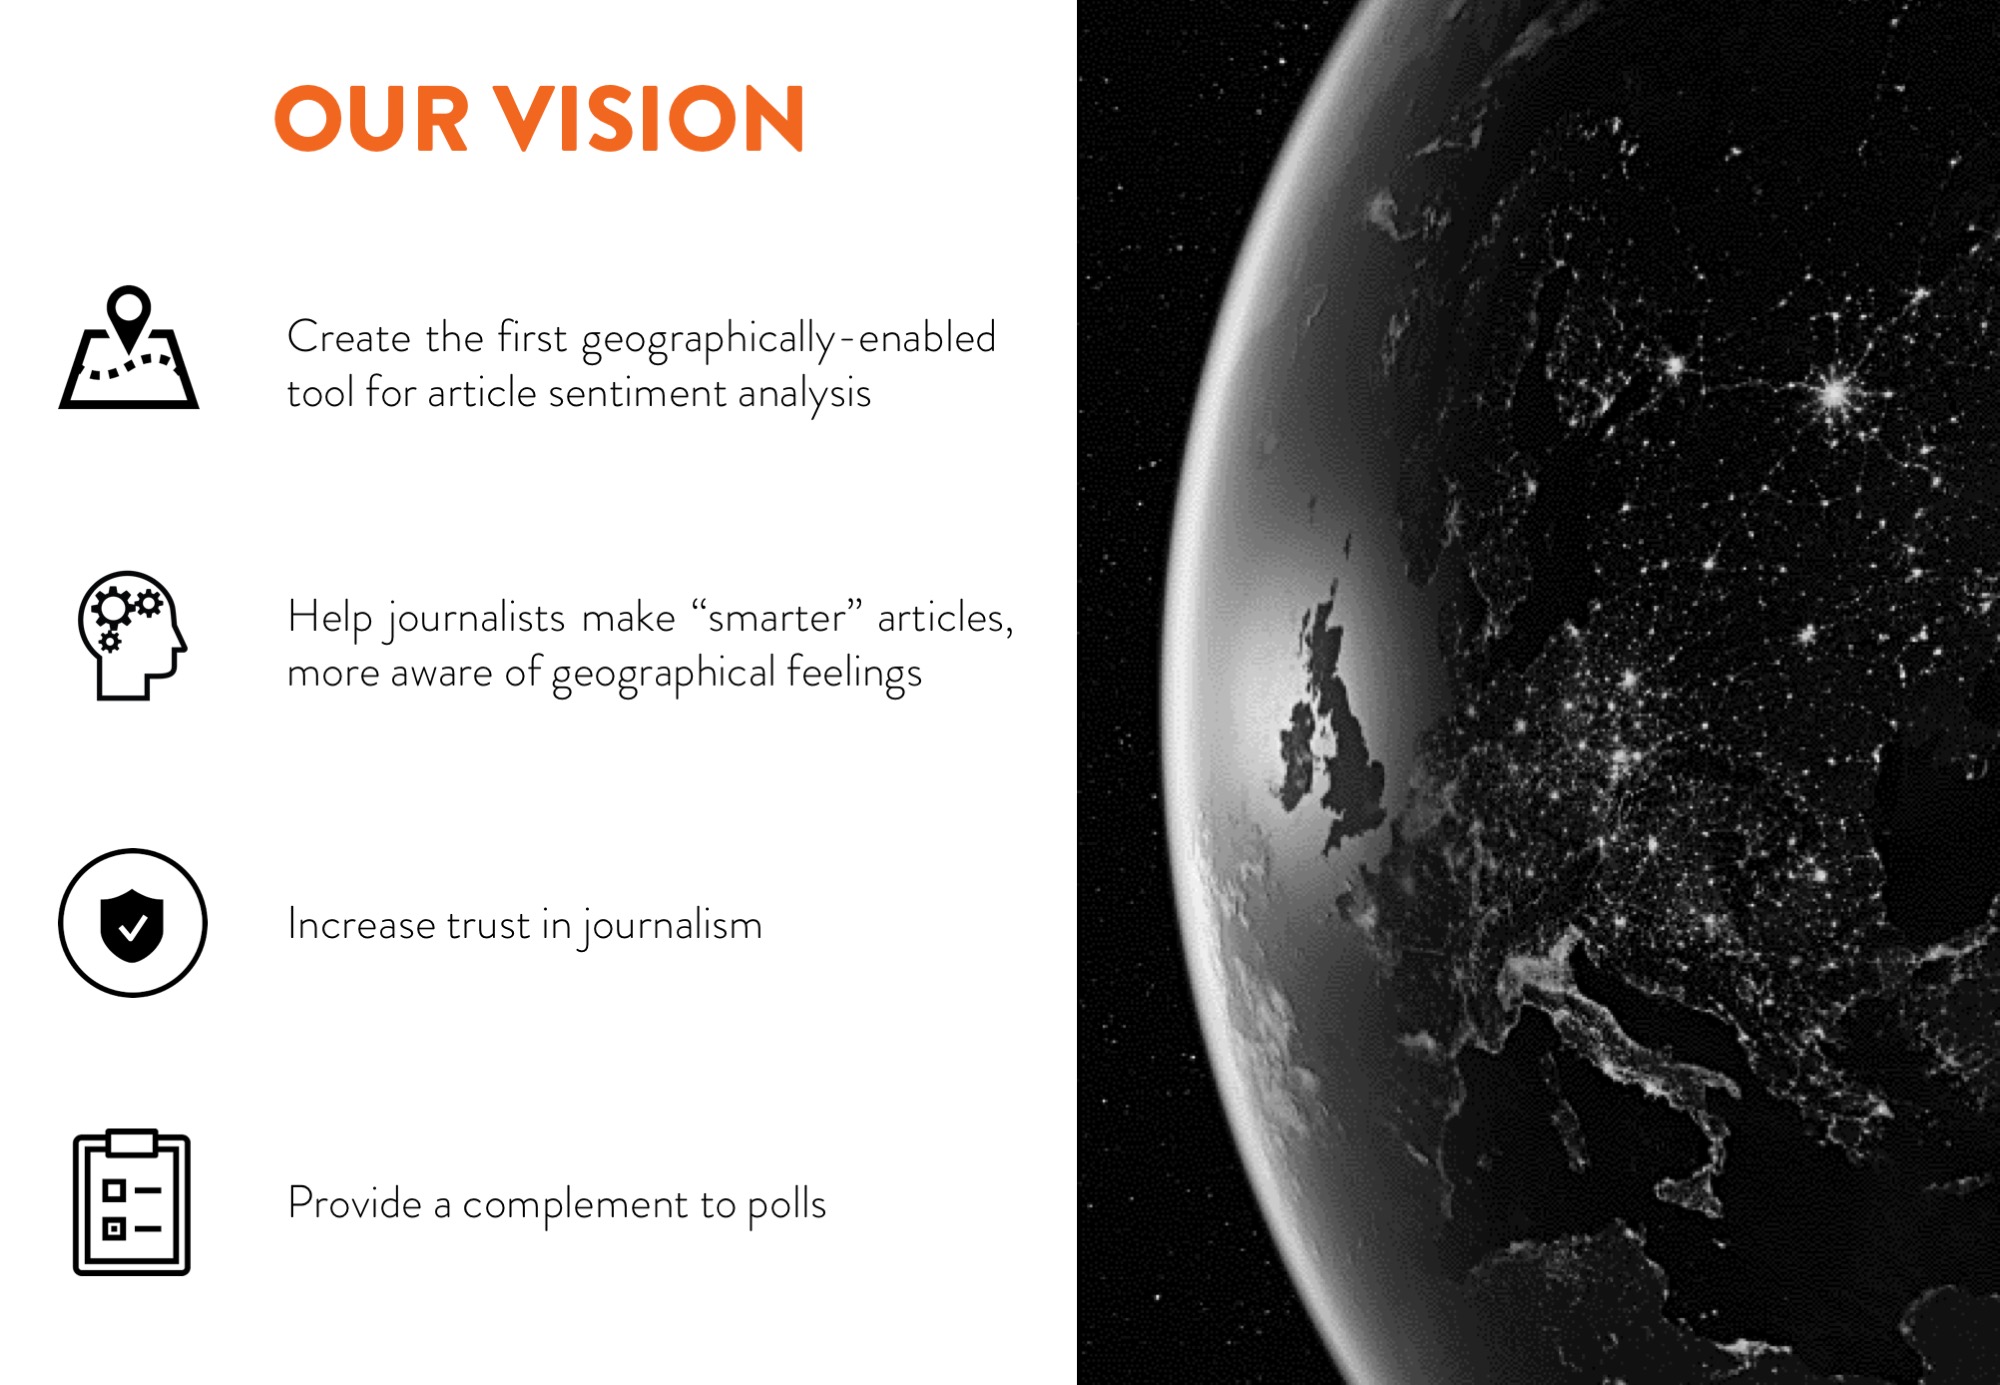
"Make journalism great again". We believe that, after the recent errors made by election polls, journalism has lost trust from the general public. The New York Times predicted Clinton's victory with 85% probability just a few hours before the election. Our ambition is to build a product that helps journalists make smarter articles and better understand people's feelings behind them. It is clear that a lot of newspapers did not perceive all the anger in a huge part of the American population, and we want to change this. Finally, we also aspire to help journalists find what topics and articles people are more emotionally involved.
What it does
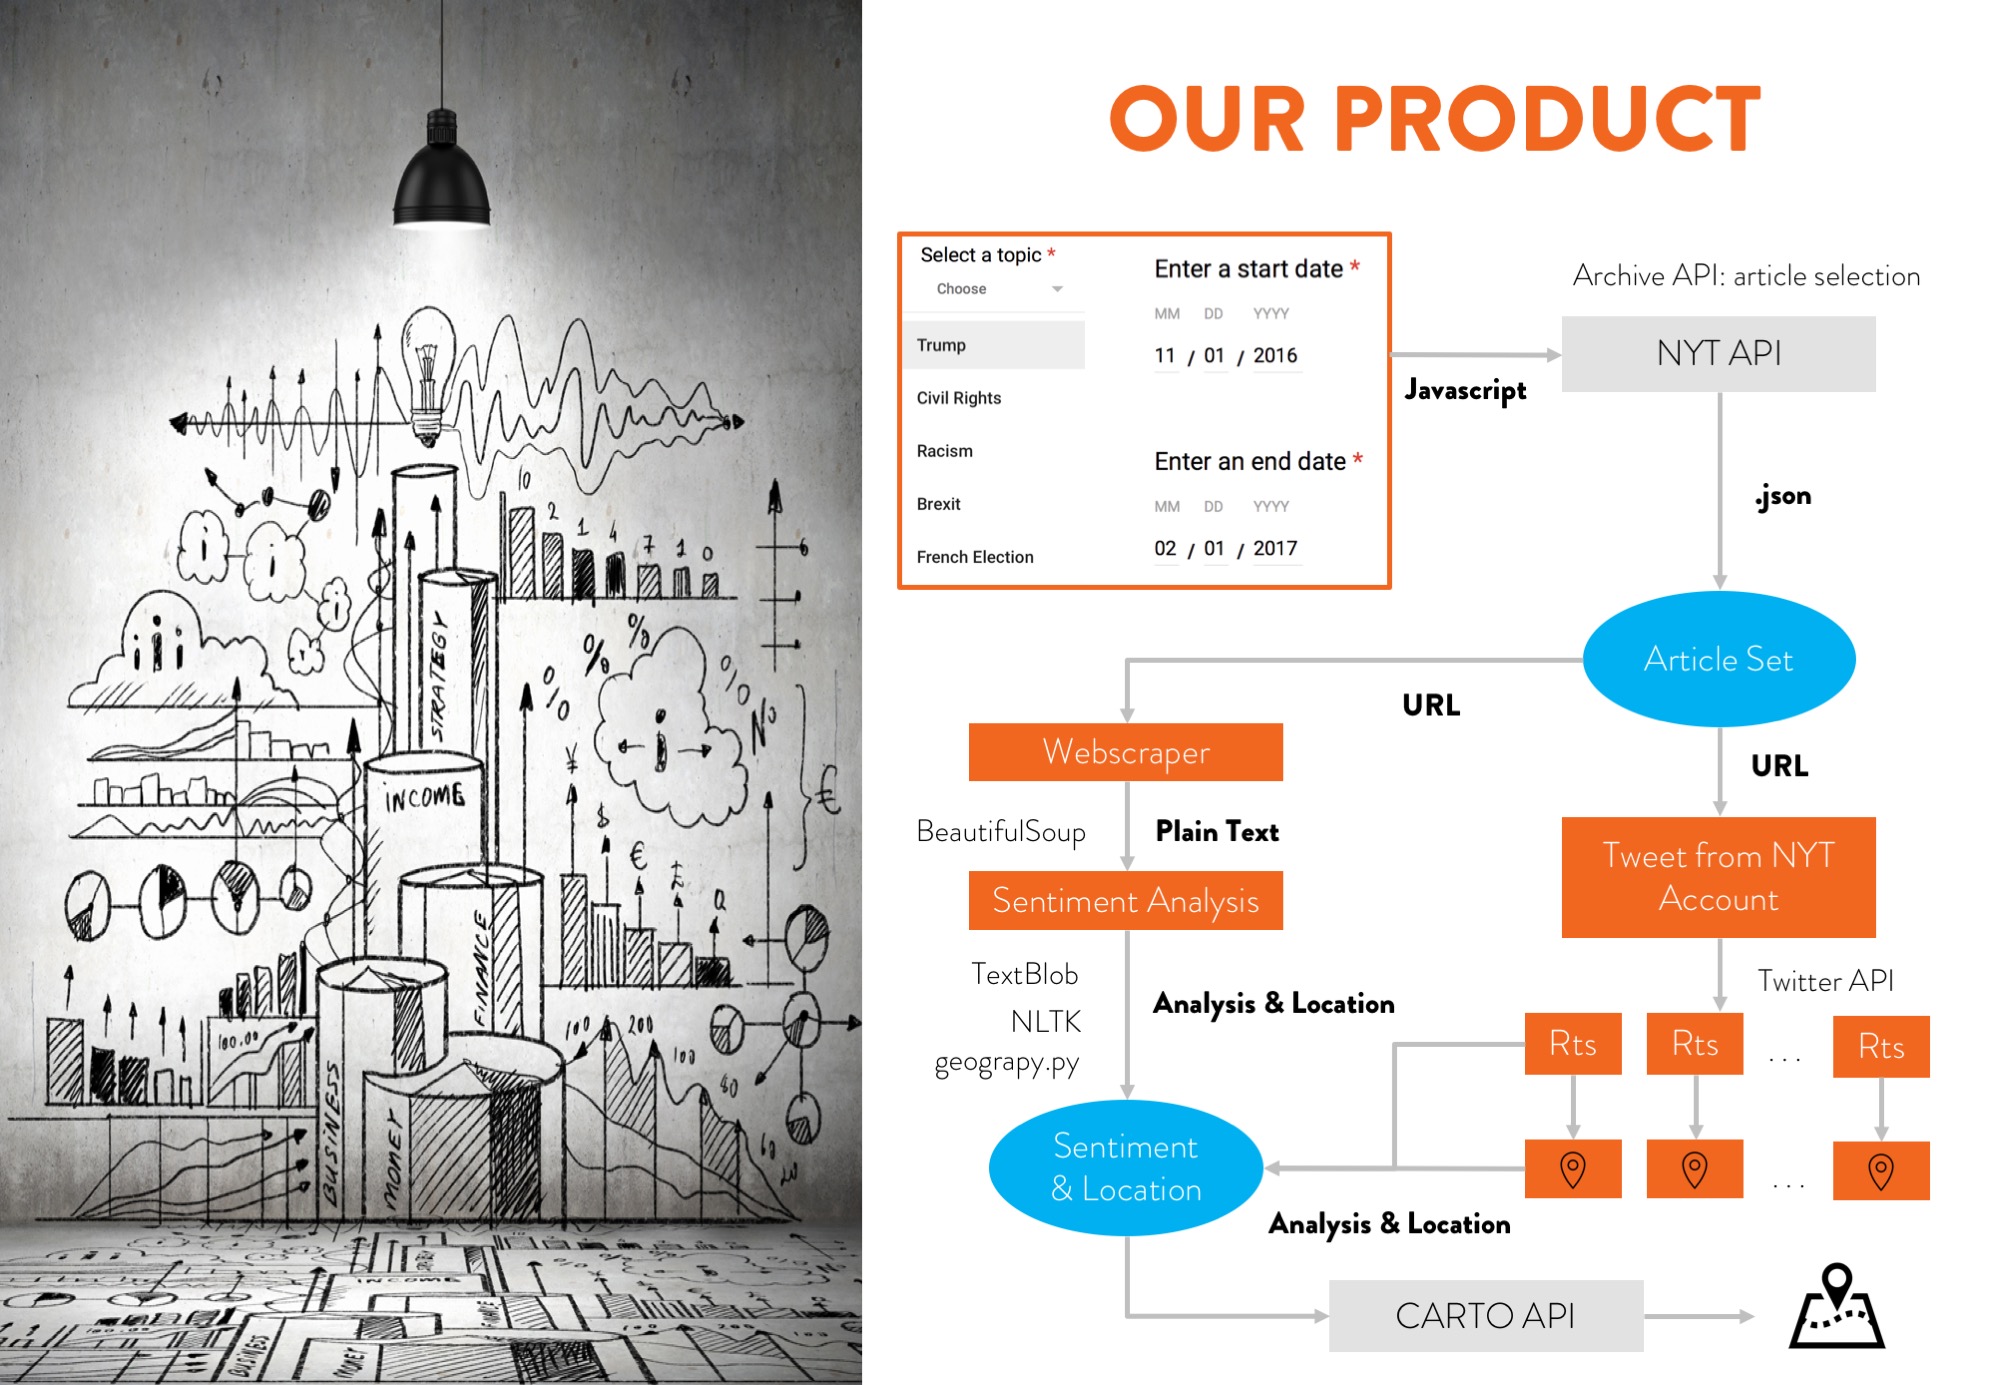
GeoSense enables journalists to look for a specific topic of interest (for instance: "Trump" or "Brexit") and select a date interval for which it extracts all the articles related in the New York Times. Then, using sentiment component analysis of both the article and the retweets it gets, we are able to map the sentiment generated by the topic in a very user-friendly, appealing chart.
How we built it
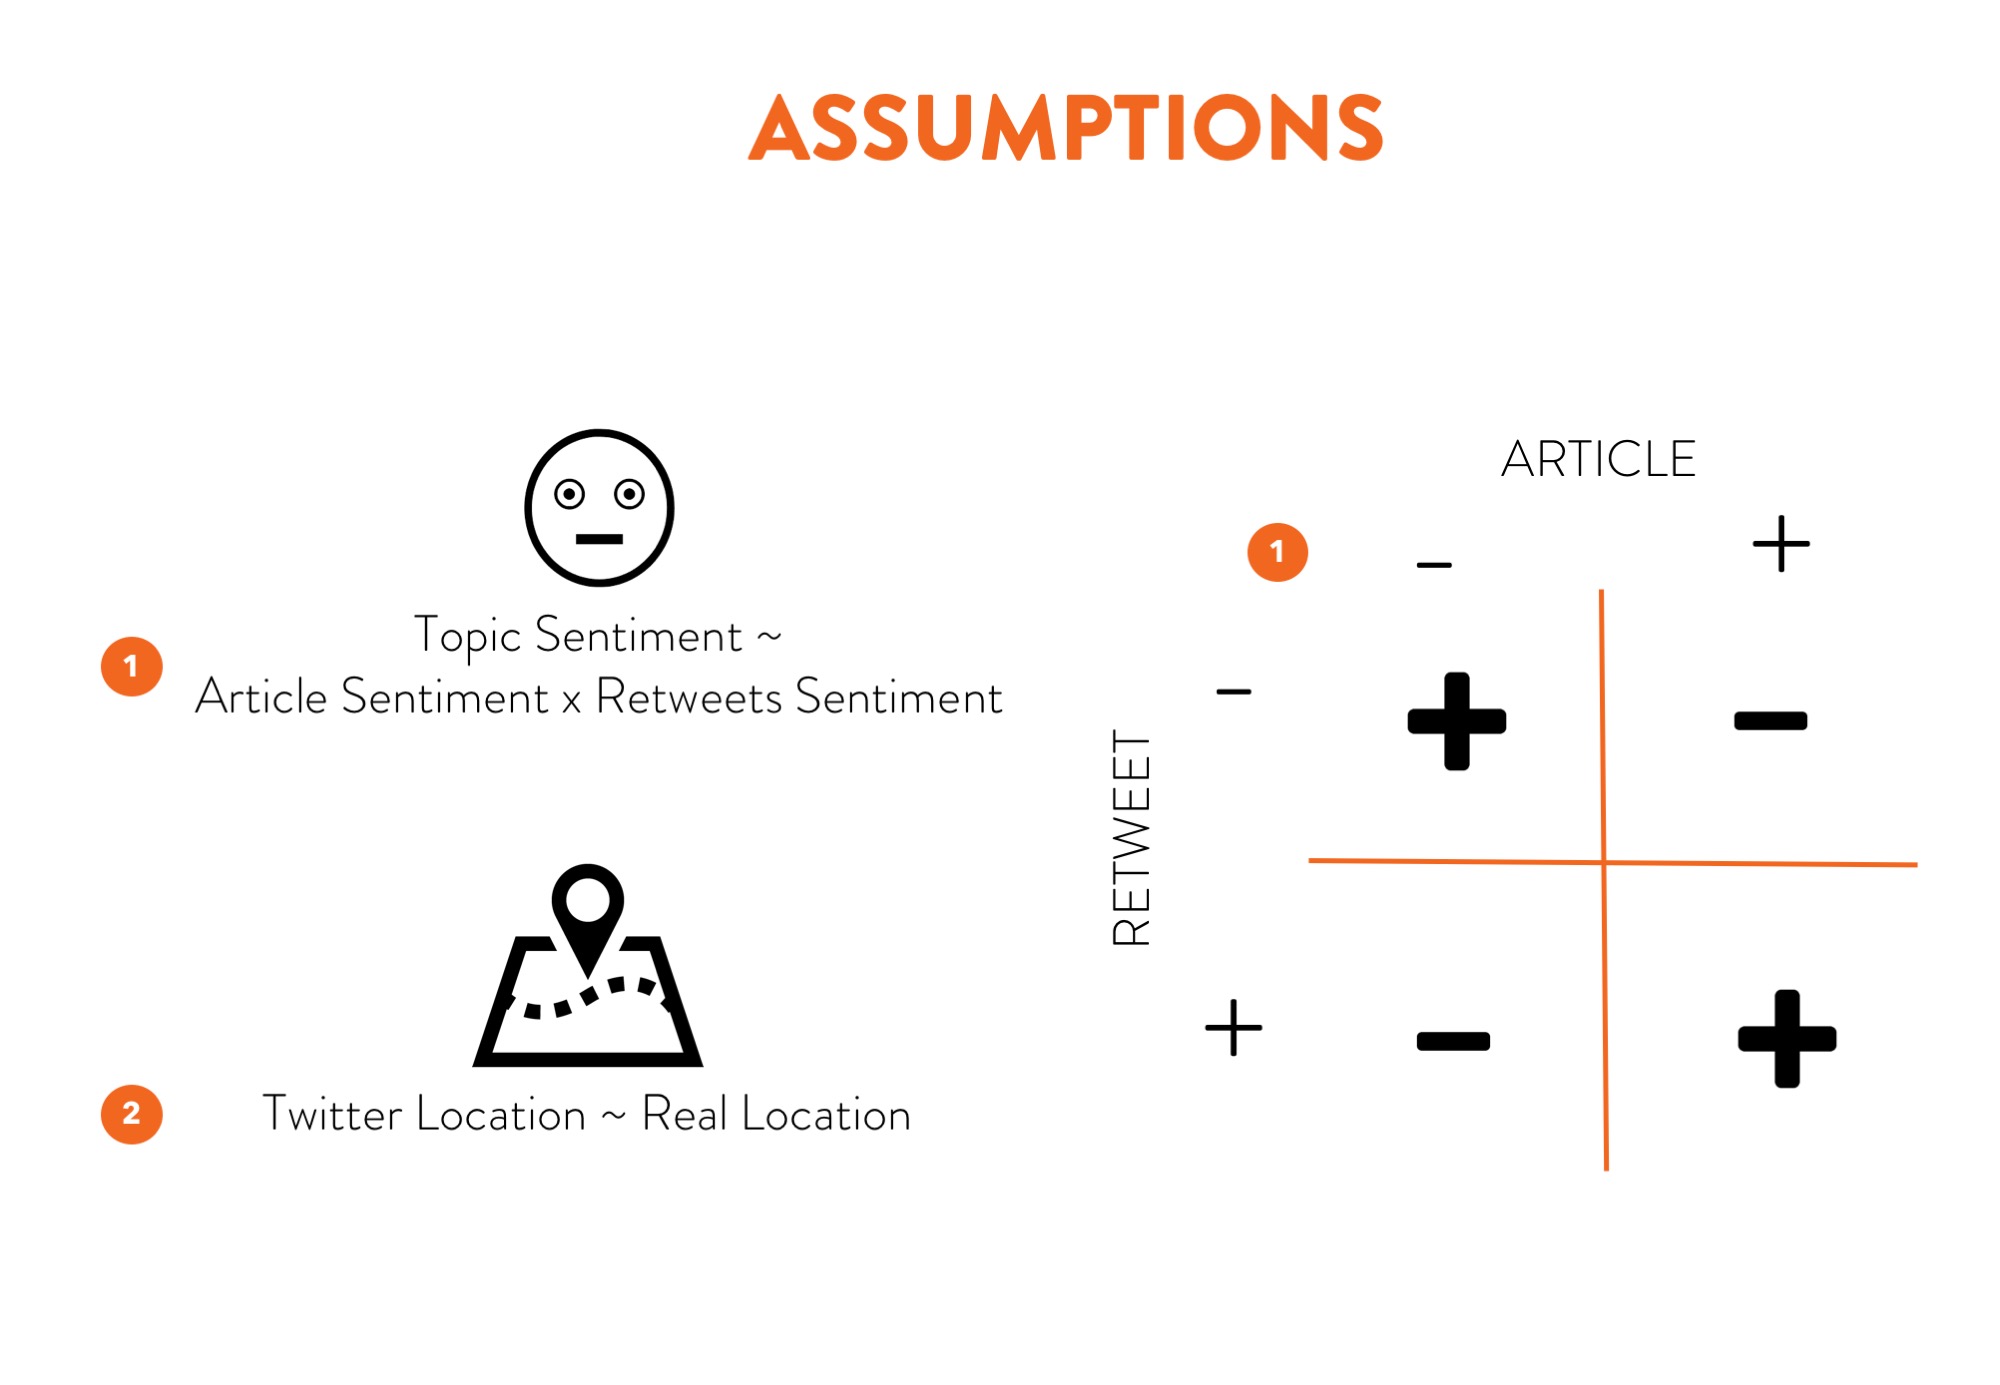
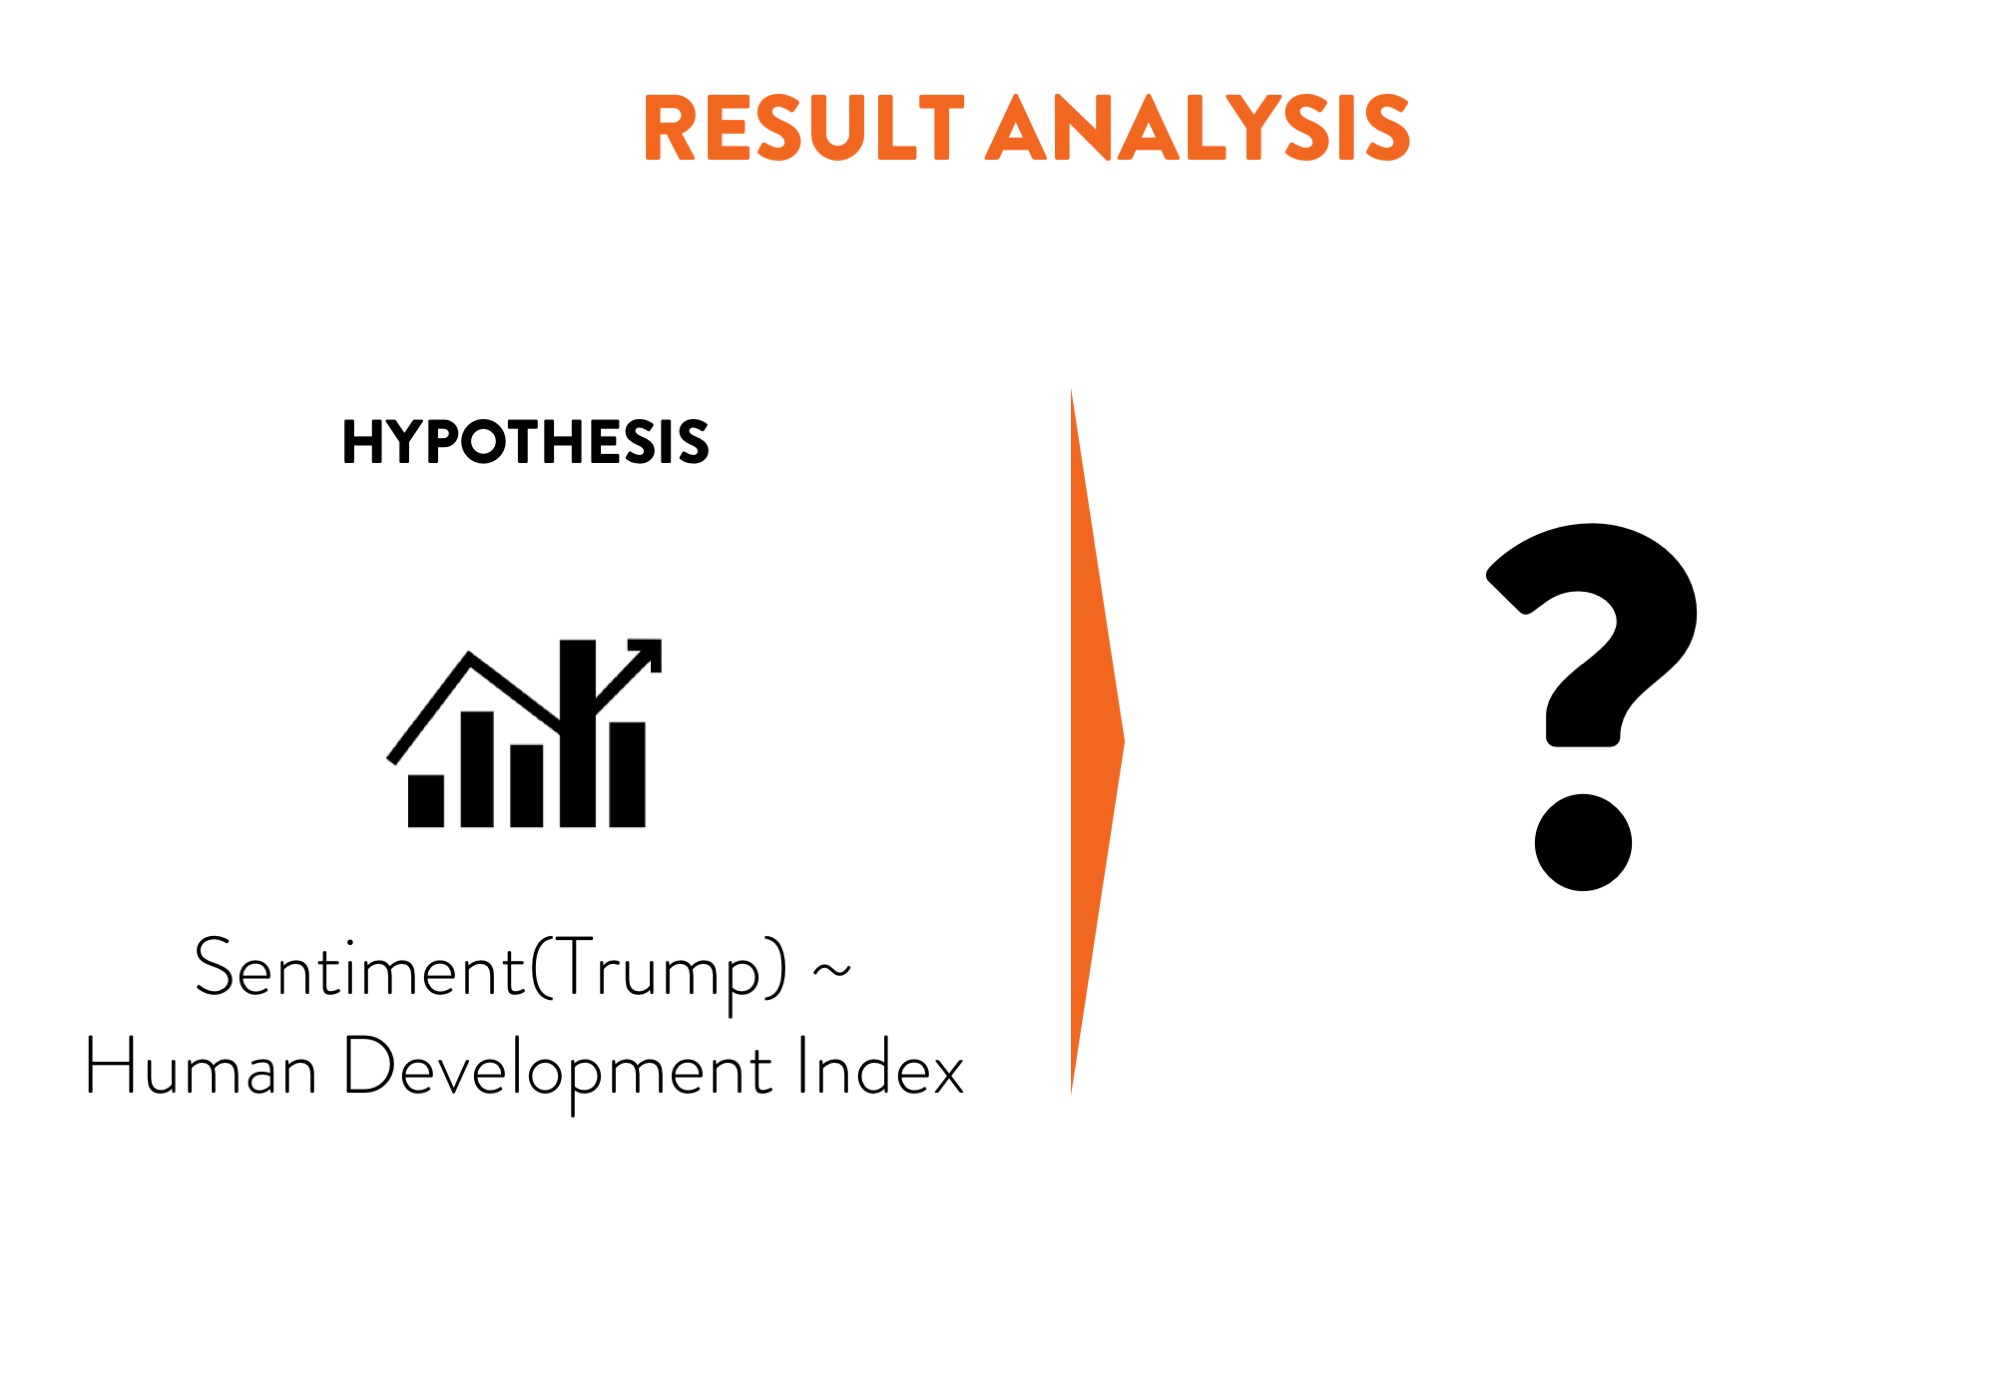
We used javascript to pull the articles using the New York Times API and complied the results of the archive in a .json file. Then we divided the flow in two parts: a) We used the URL and webscrapped the article with Beautiful Soup, finding both sentiment (NLTK & TextBlob) and location were the content happened (geograpy). b) We used the URL and Twitters API to find all the retweets the article had and we applied again sentiment analysis as well as found the location of the user's retweeting. Finally, we crossed both sentiments multiplying their results to get an overall sentiment of the retweet and we used Carto API to map it in a beautiful way. For the case of Donald Trump, we compared the average state sentiment against the HDI, with the hypothesis that people favourable to the president are people that are probably being left behind by globalization.
Challenges we ran into
1) Twitter's API speed of download was very low and he had to 2) Complexity of merging multiple APIs, locations, systems 3) Limits to the free API of Carto
Accomplishments that we're proud of
We are really proud of having webscrapped, used sentiment analysis, performed normal analysis in python and used multiple APIs all in one project. One of the keys of our speed was to hack our way through Trwitter's API using several accounts and API keys. We believe our hypothesis for sentiment analysis were fairly good and we are proud to have developed the MVP from start to end while creating a beautiful presentation.
What we learned
We learned about a bunch of libraries:
- TextBlob
- NLTK [Models and Packages]
- geograpy 3.7 We learned also how to use NYT API and we became semi-experts in Twiter's API!
What's next for GeoSense
- User Interface
- Include article comments sentiment analysis
- Include Facebook sharing and reactions sentiment analysis
- Improve Sentiment Analysis model with a better relation of sentiments to objects


Log in or sign up for Devpost to join the conversation.