-
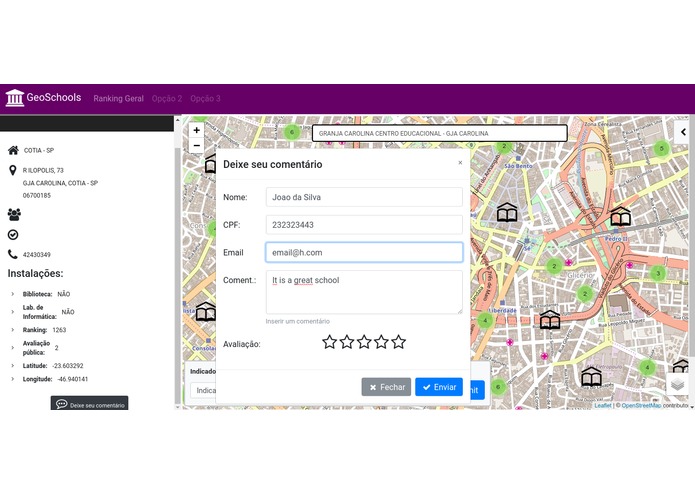
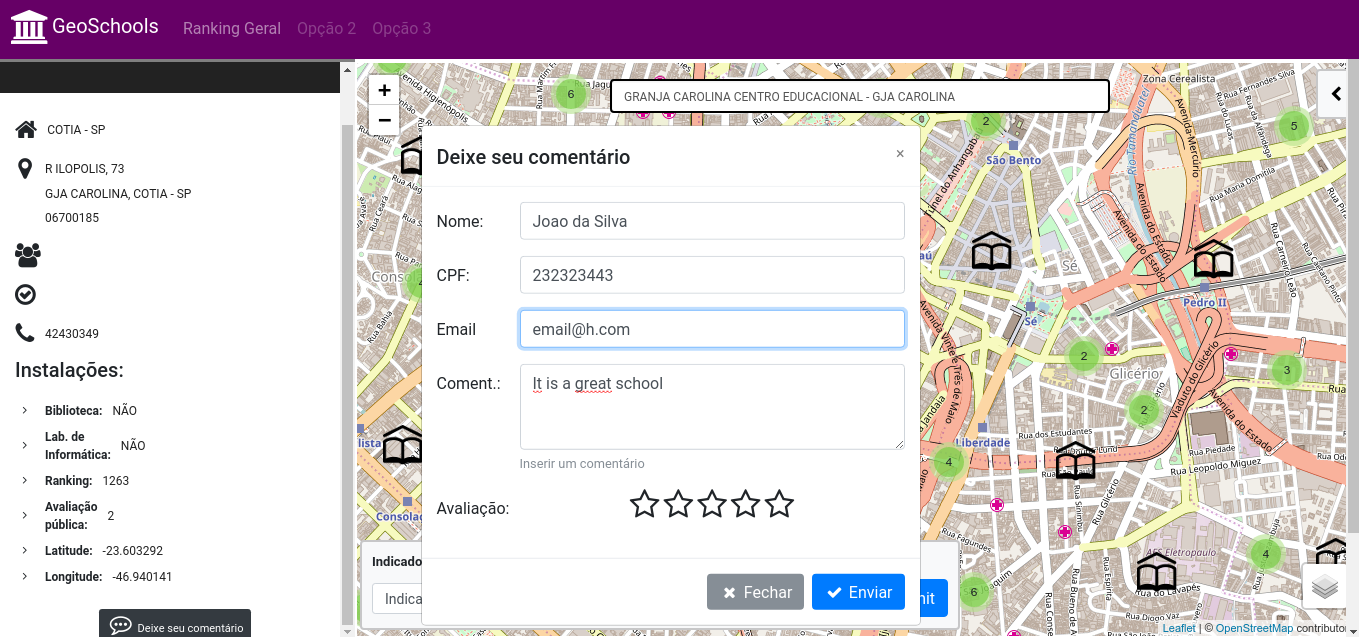
User avaliation
Inspiration
Actually, the goverment and all the population dont have all ther required information to be able to take good decisions especially in the education.
What it does
It allows the visualization of schools in a very simplified and interactive way, and makes possible to any user to make suggestions and avaliations. Furthermore, it will allow in the comparison between different metrics.
It is a tool to show the school quality which could help to improve the society.
How we built it
We used ruby on rails to develop the backend and angular for the frontend side.
Challenges we ran into
It will be possible to show more indicators and use another databases to obtain correlations that could be useful in the moment of taking decisions
Accomplishments that we're proud of
It is possible to see the school distribution in a very intuitive way. And also to filter them by differente metrics, it would make possible to manage school investments trying to have the better possible impact.
What we learned
We learned some techniques of data mining, data visualization. We remembered the correct use of the languages like ruby, angular and also sql.
What's next for GeoSchools
The project is very scalable, and it could be extended to show hospital's or transportation information.

Log in or sign up for Devpost to join the conversation.