
Inspiration
Coventry City Footballl Club wanted a way to identify key data trends from the data that they provided us with. We though to integrate some machine learning and exciting data visualisaiton as well as basic some basic analysis into a cleanly designed website.
What it does
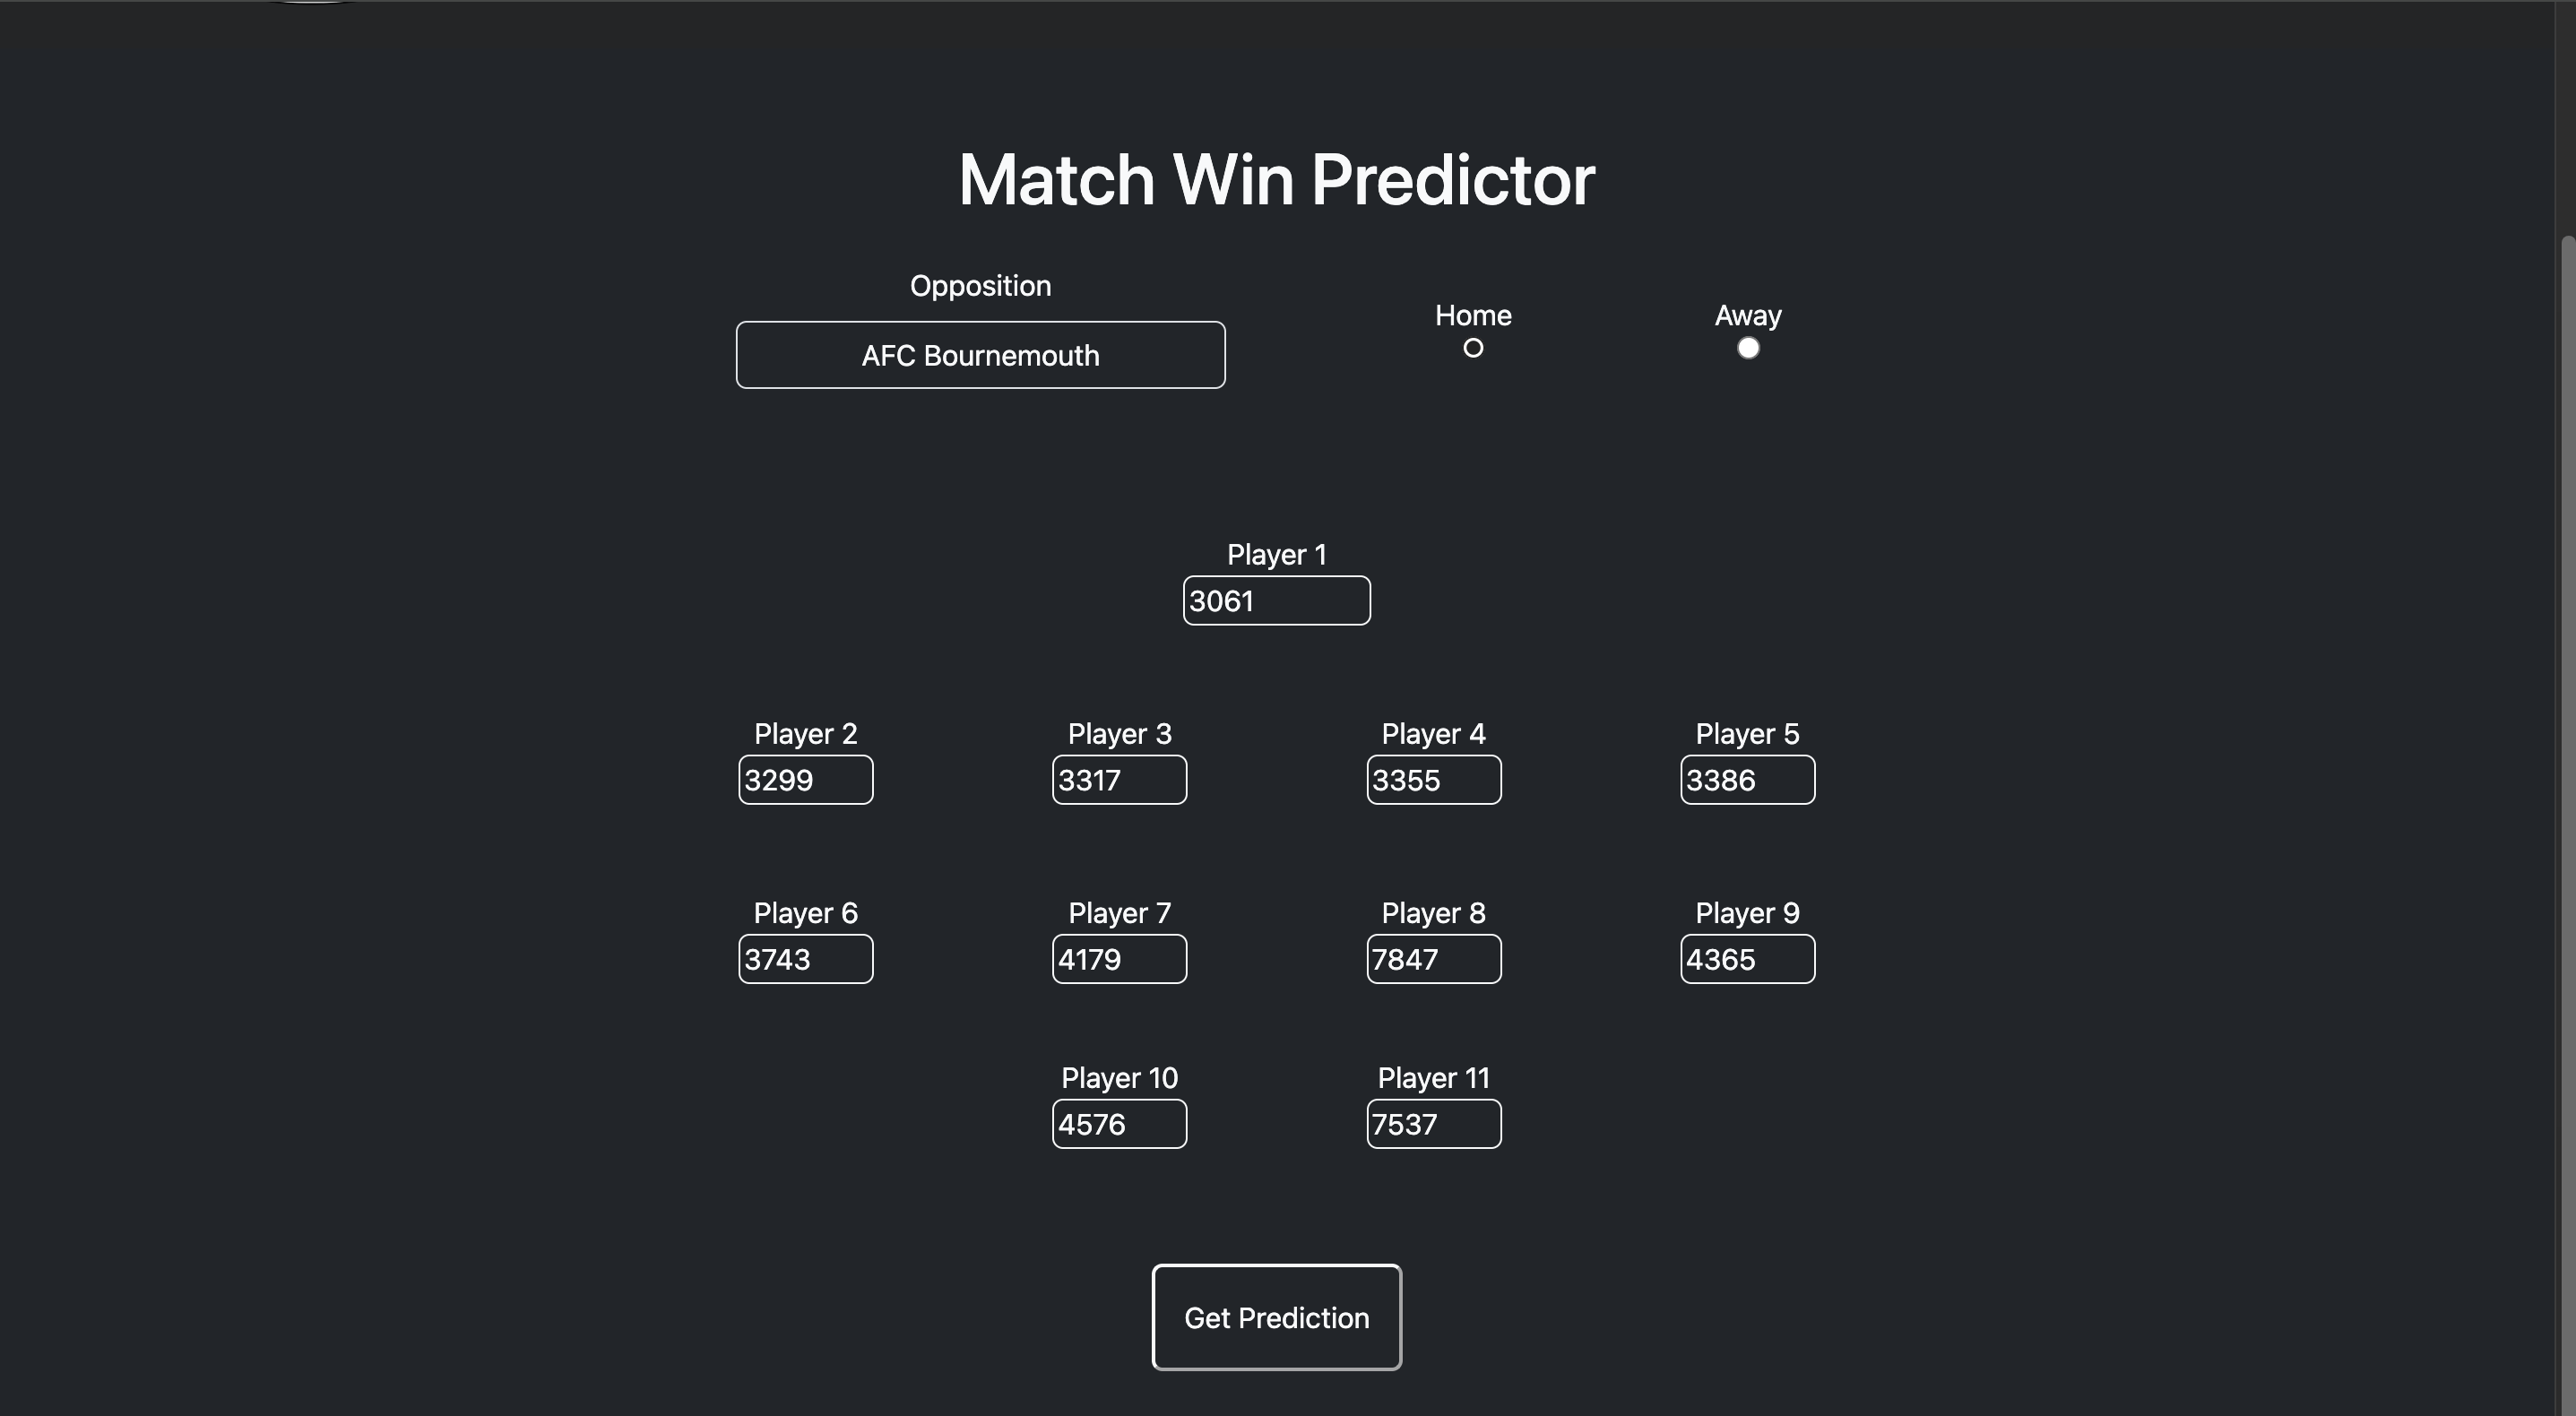
The match predictor takes an input of a team of player ids representing Coventry's starting lineup, and the name of the opponent.
How we built it
Python in the back end (NumPy, Matplotlib, Pandas) and Flask to connect to the html5 and JavaScript frontend (bootstrap, css3)
Challenges we ran into
In the making of the sustainability section, we realised that the data that Coventry City FC provided us with didn't contain the distance that the team had to travel for each of their away games. To get those distances, we web scraped the coordinates of the stadiums for each of Coventry's away games and then tried to use openrouteservice's API to calculate the distances. However, the coordinates for which we had taken for the opposing teams stadium's was taken from the centre of the pitch, which lead to every set of coordinates generating errors as they were over 300m away from "any routable location". Fortunately, Google's Distance Matrix API could make use of the coordinates we gathered.
Accomplishments that we're proud of
Utilising the google maps distance matrix API to automate computation
What we learned
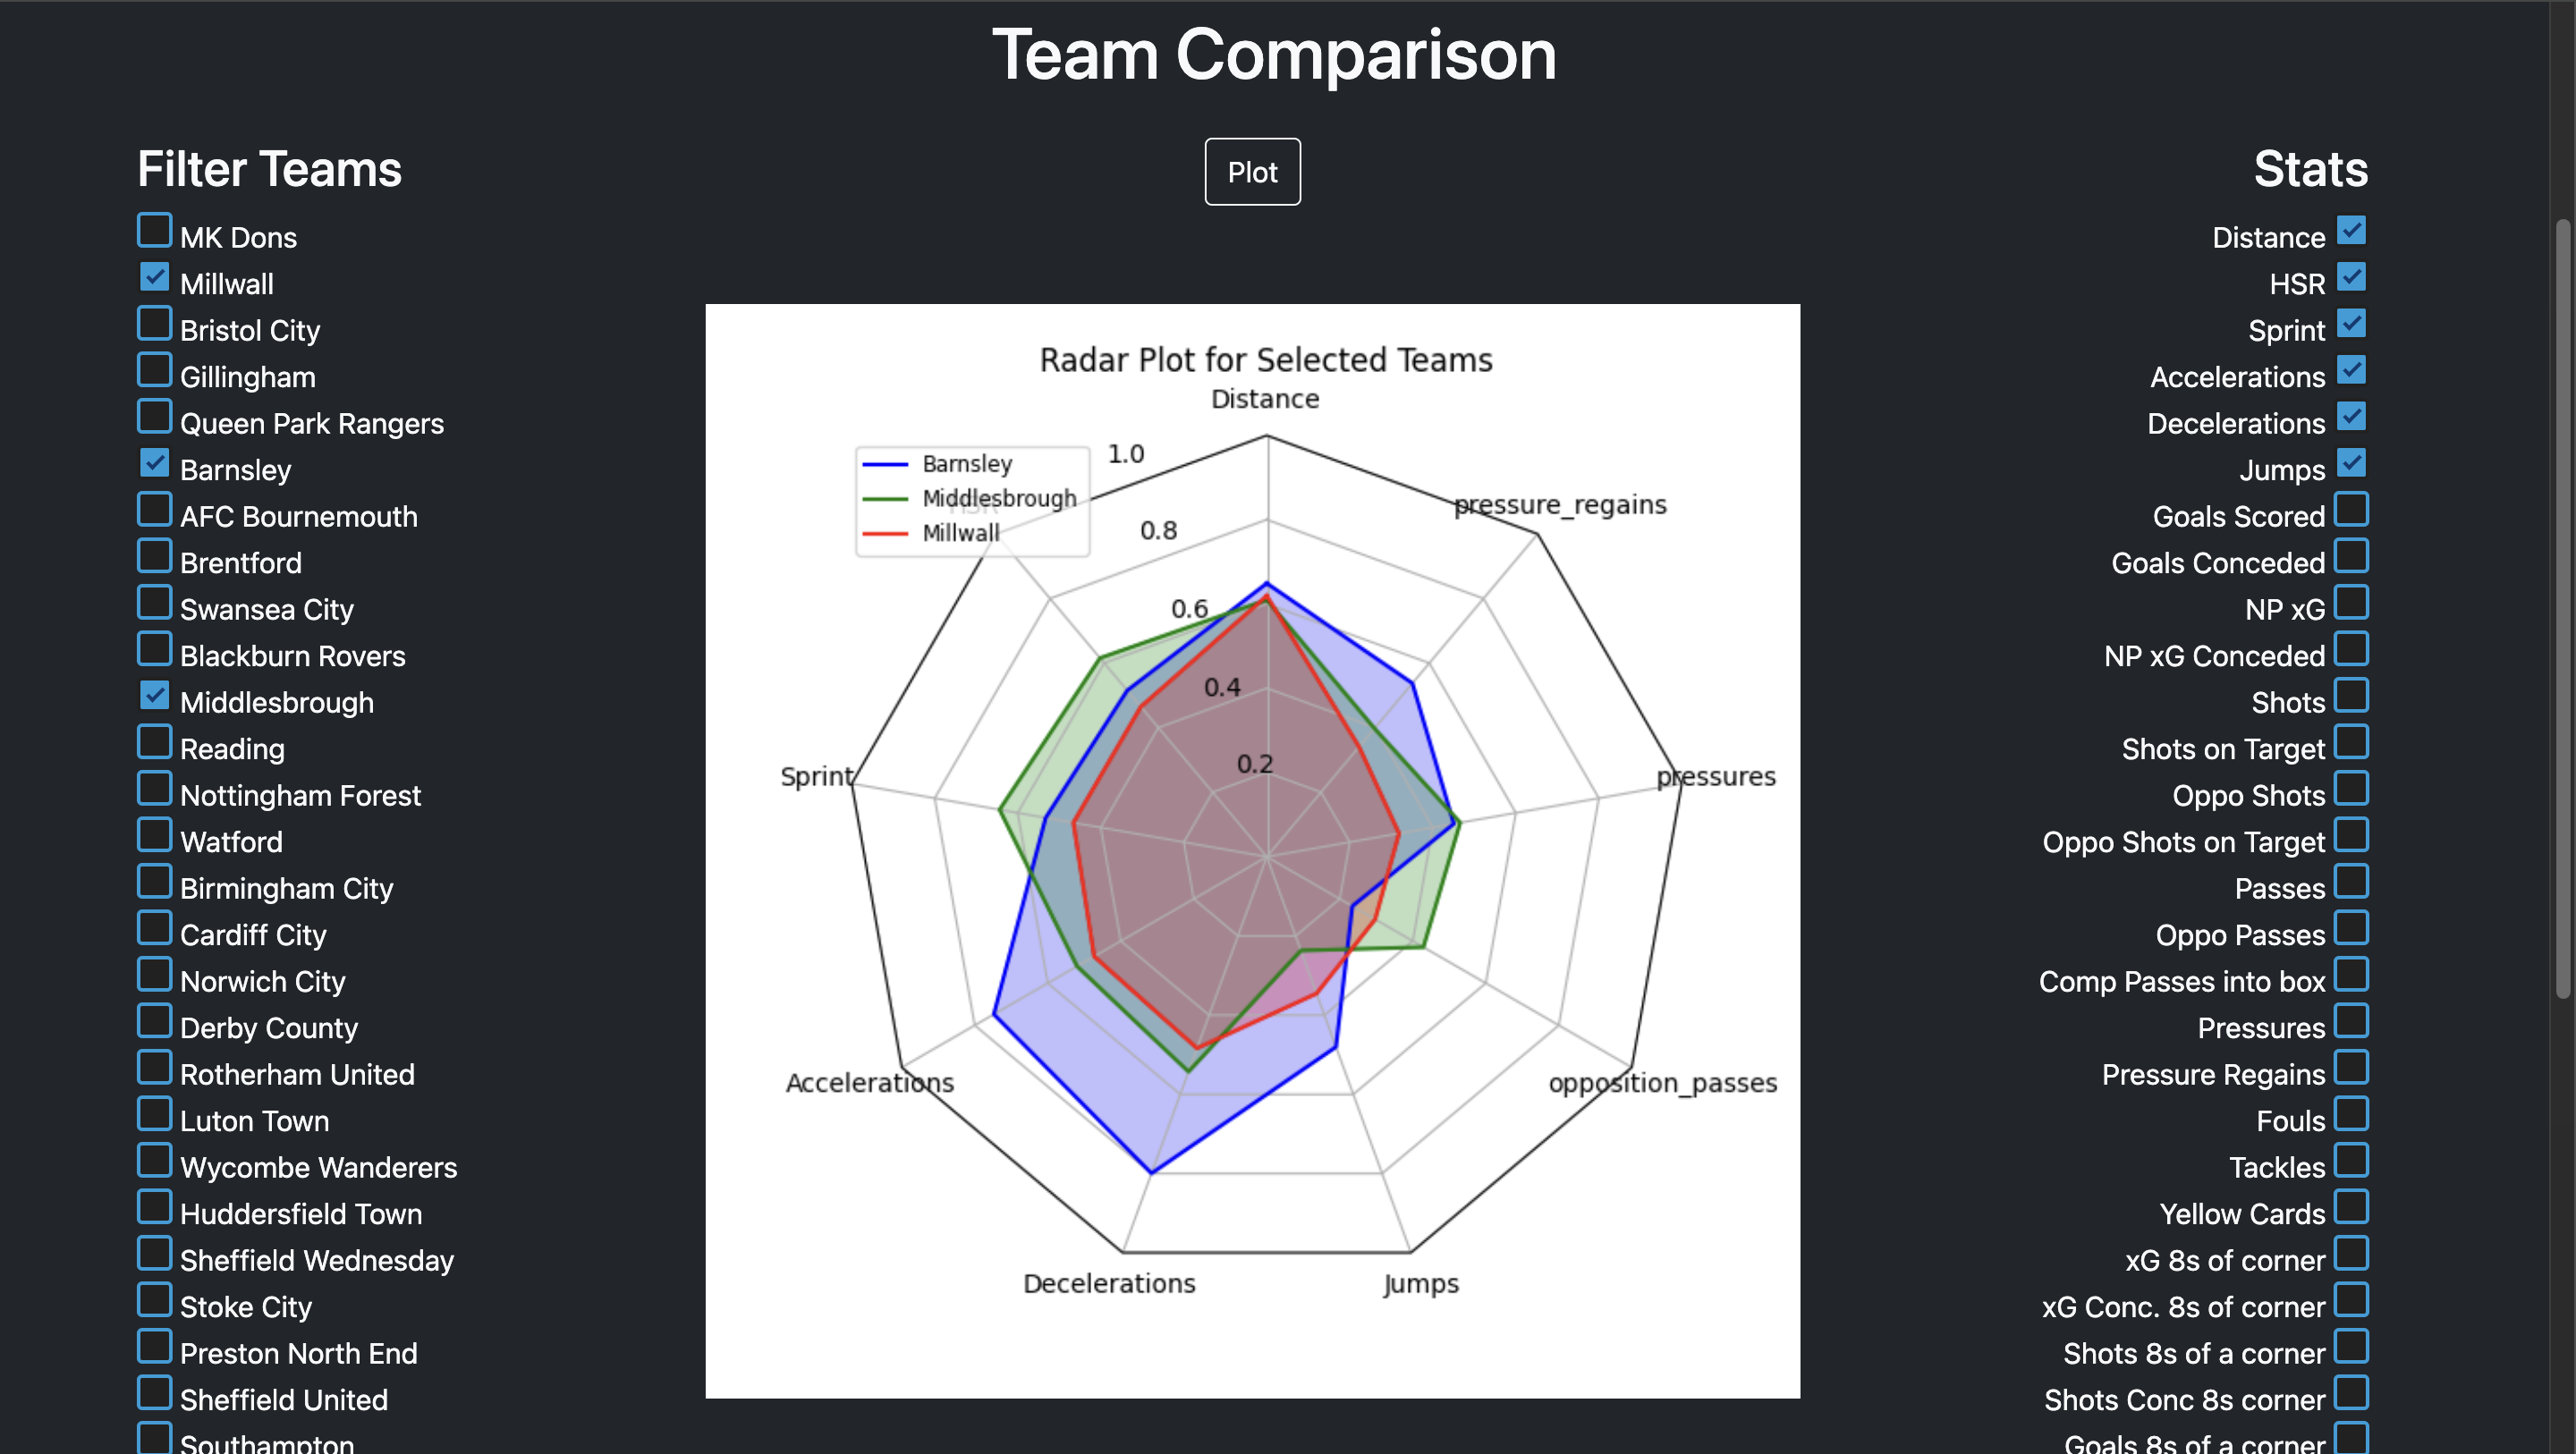
- The power of python libraries to represent data in comprehensible ways.
- The benefits of web scraping to quickly obtain necessary data
What's next for George's Angels
Utilising Docker to host the website so that it's permanently available

Log in or sign up for Devpost to join the conversation.