-
-
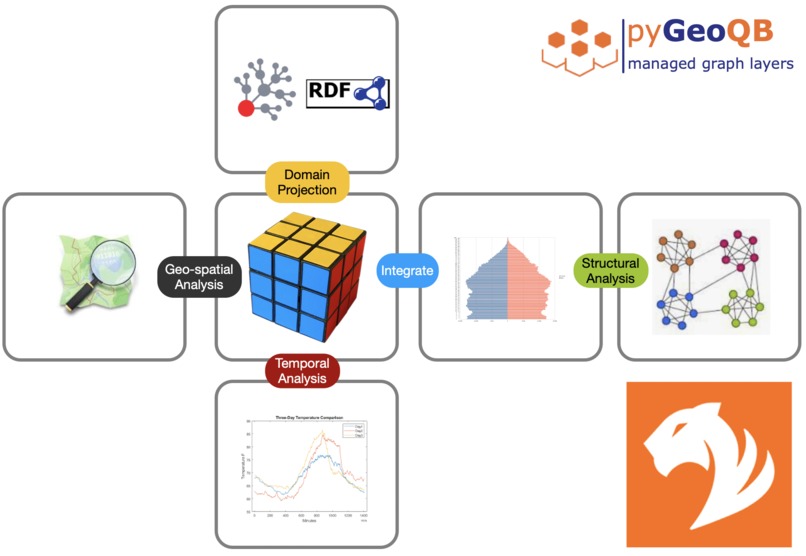
GeoQB - multi-layer multi-domain data management for TigerGraph
-
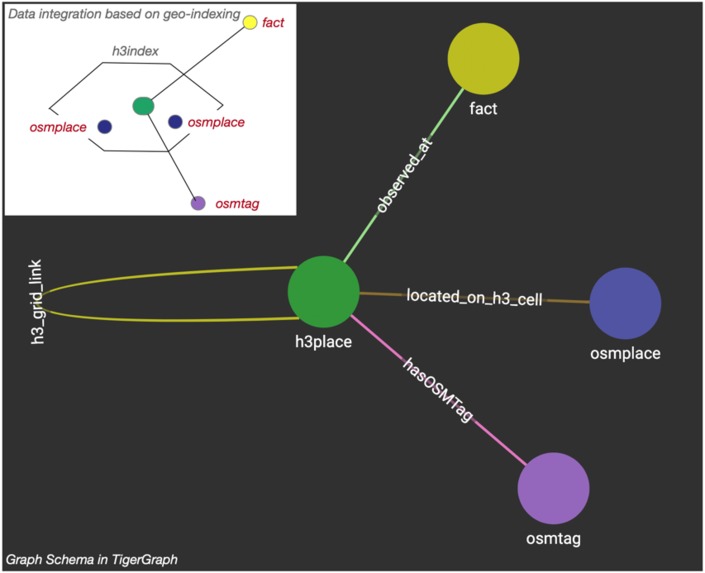
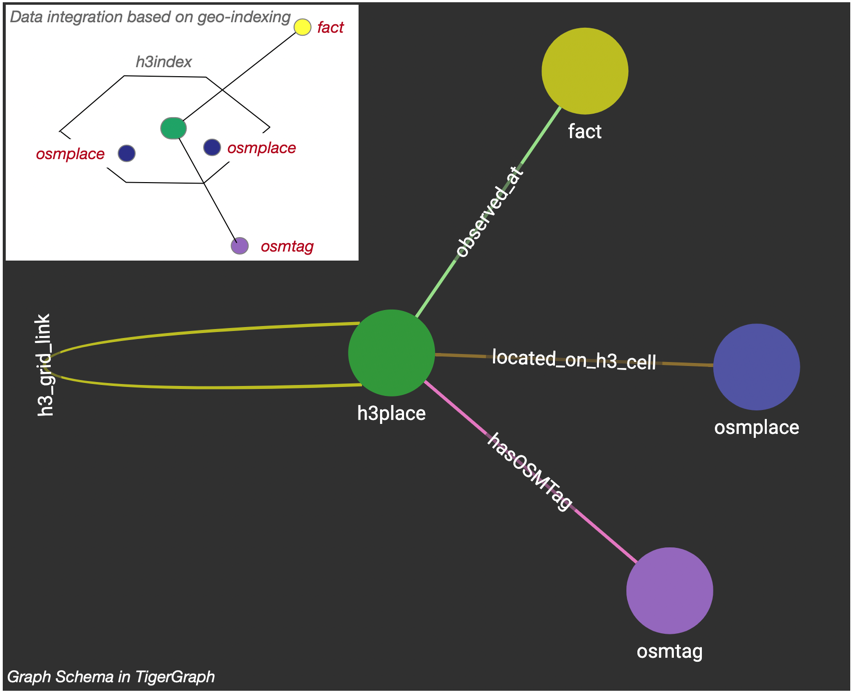
Geo-Indexing and Graph Schema
-
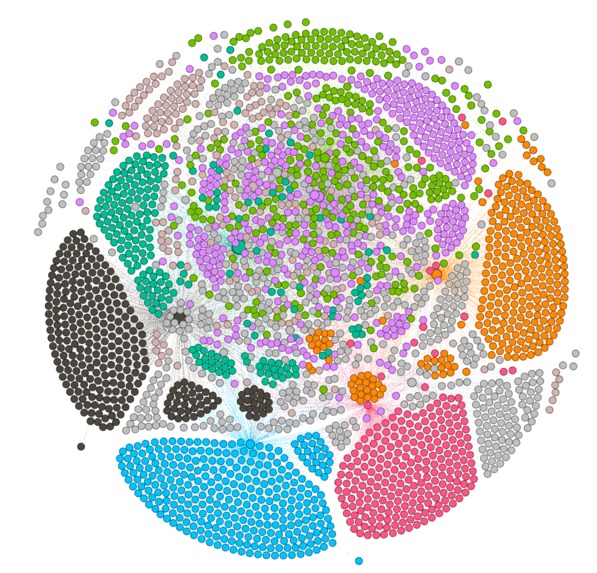
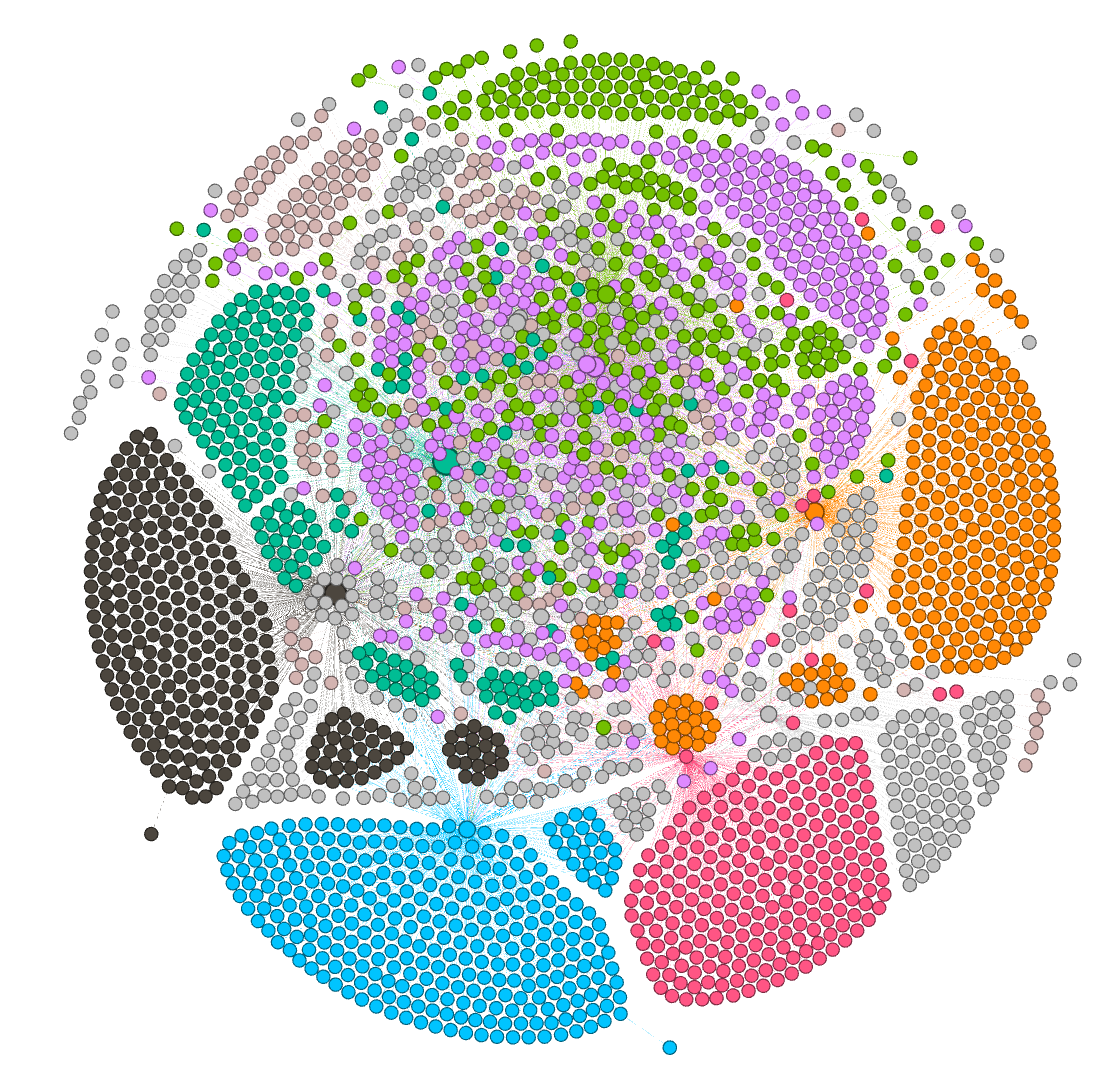
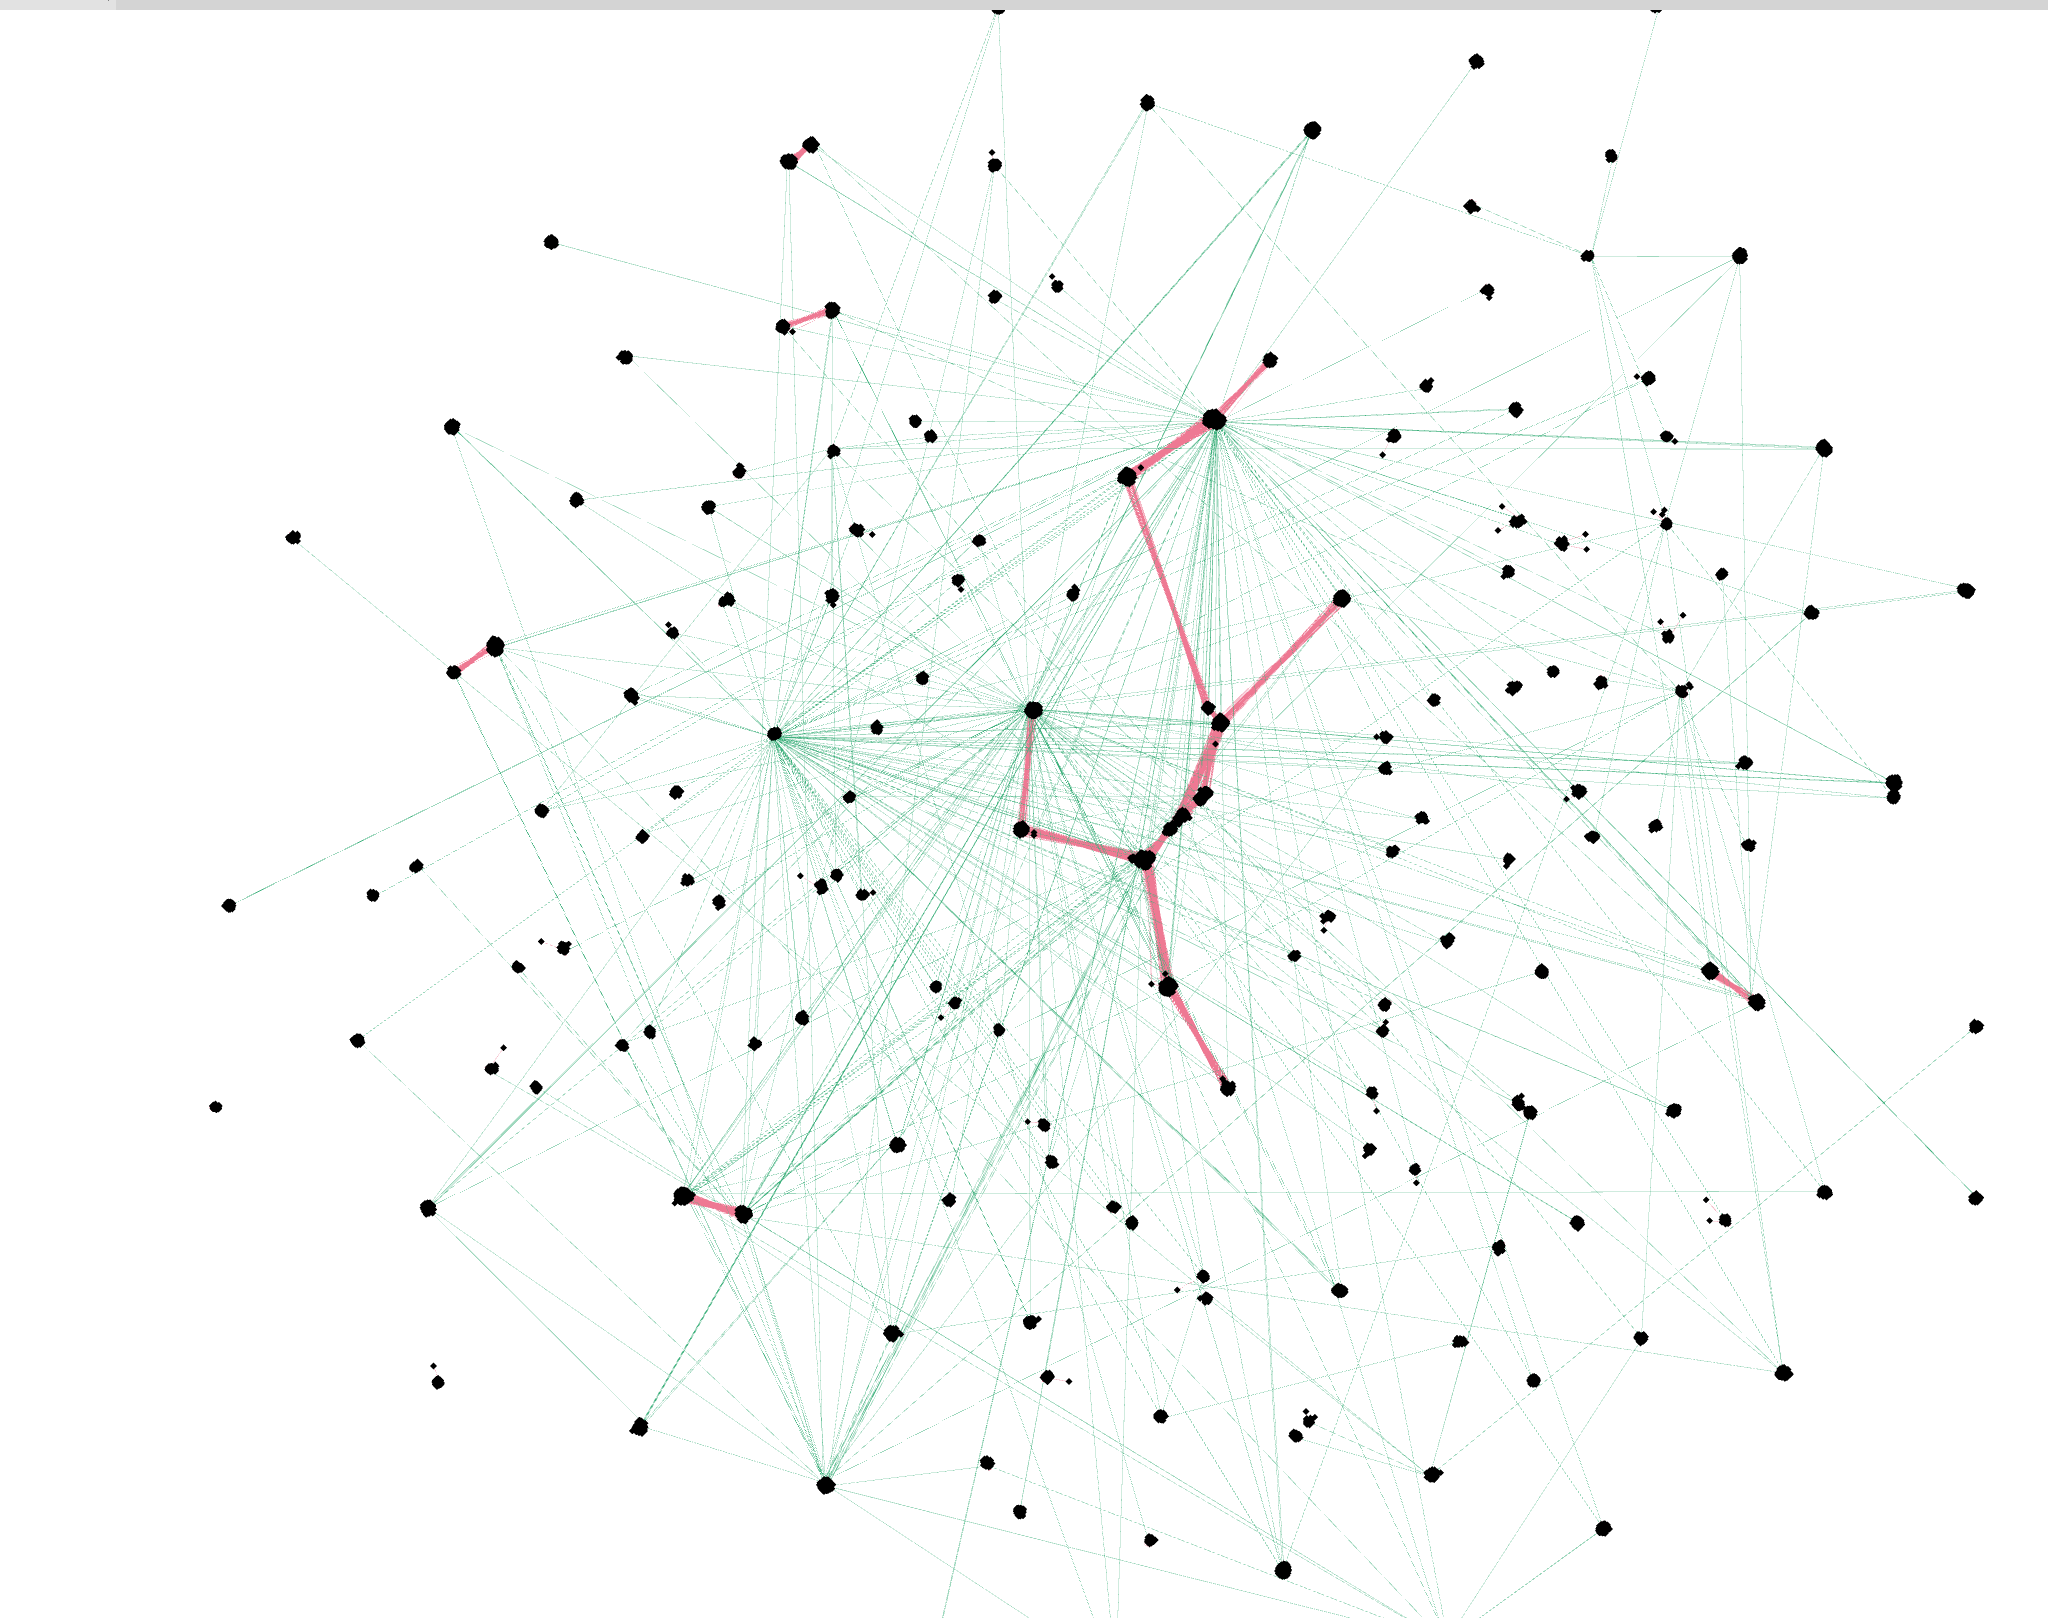
Separated vs. mixed aspects - cluster analysis reveal how aspects interdepend or if they are separable
-
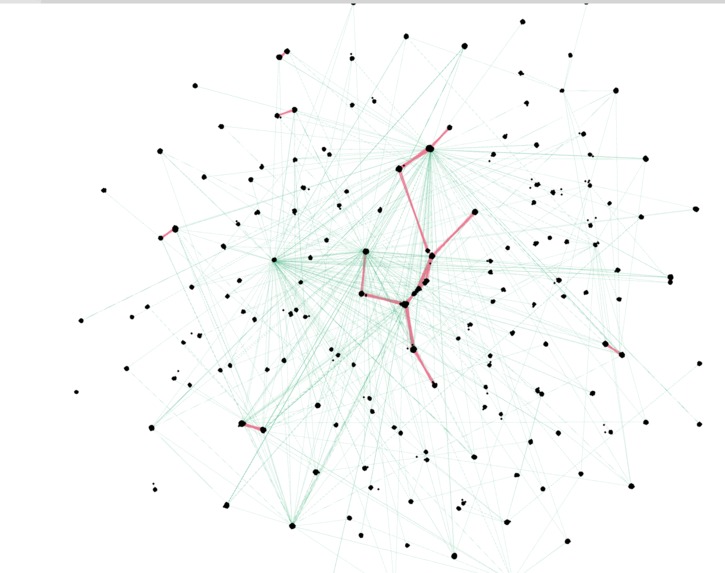
Combination of multiple layers - induced structure
-
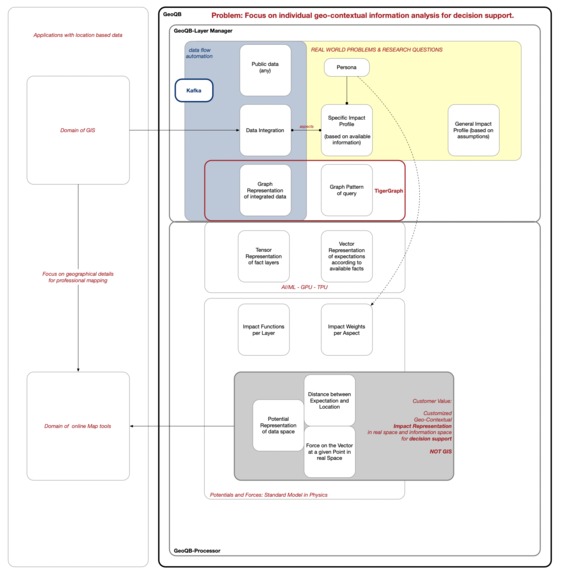
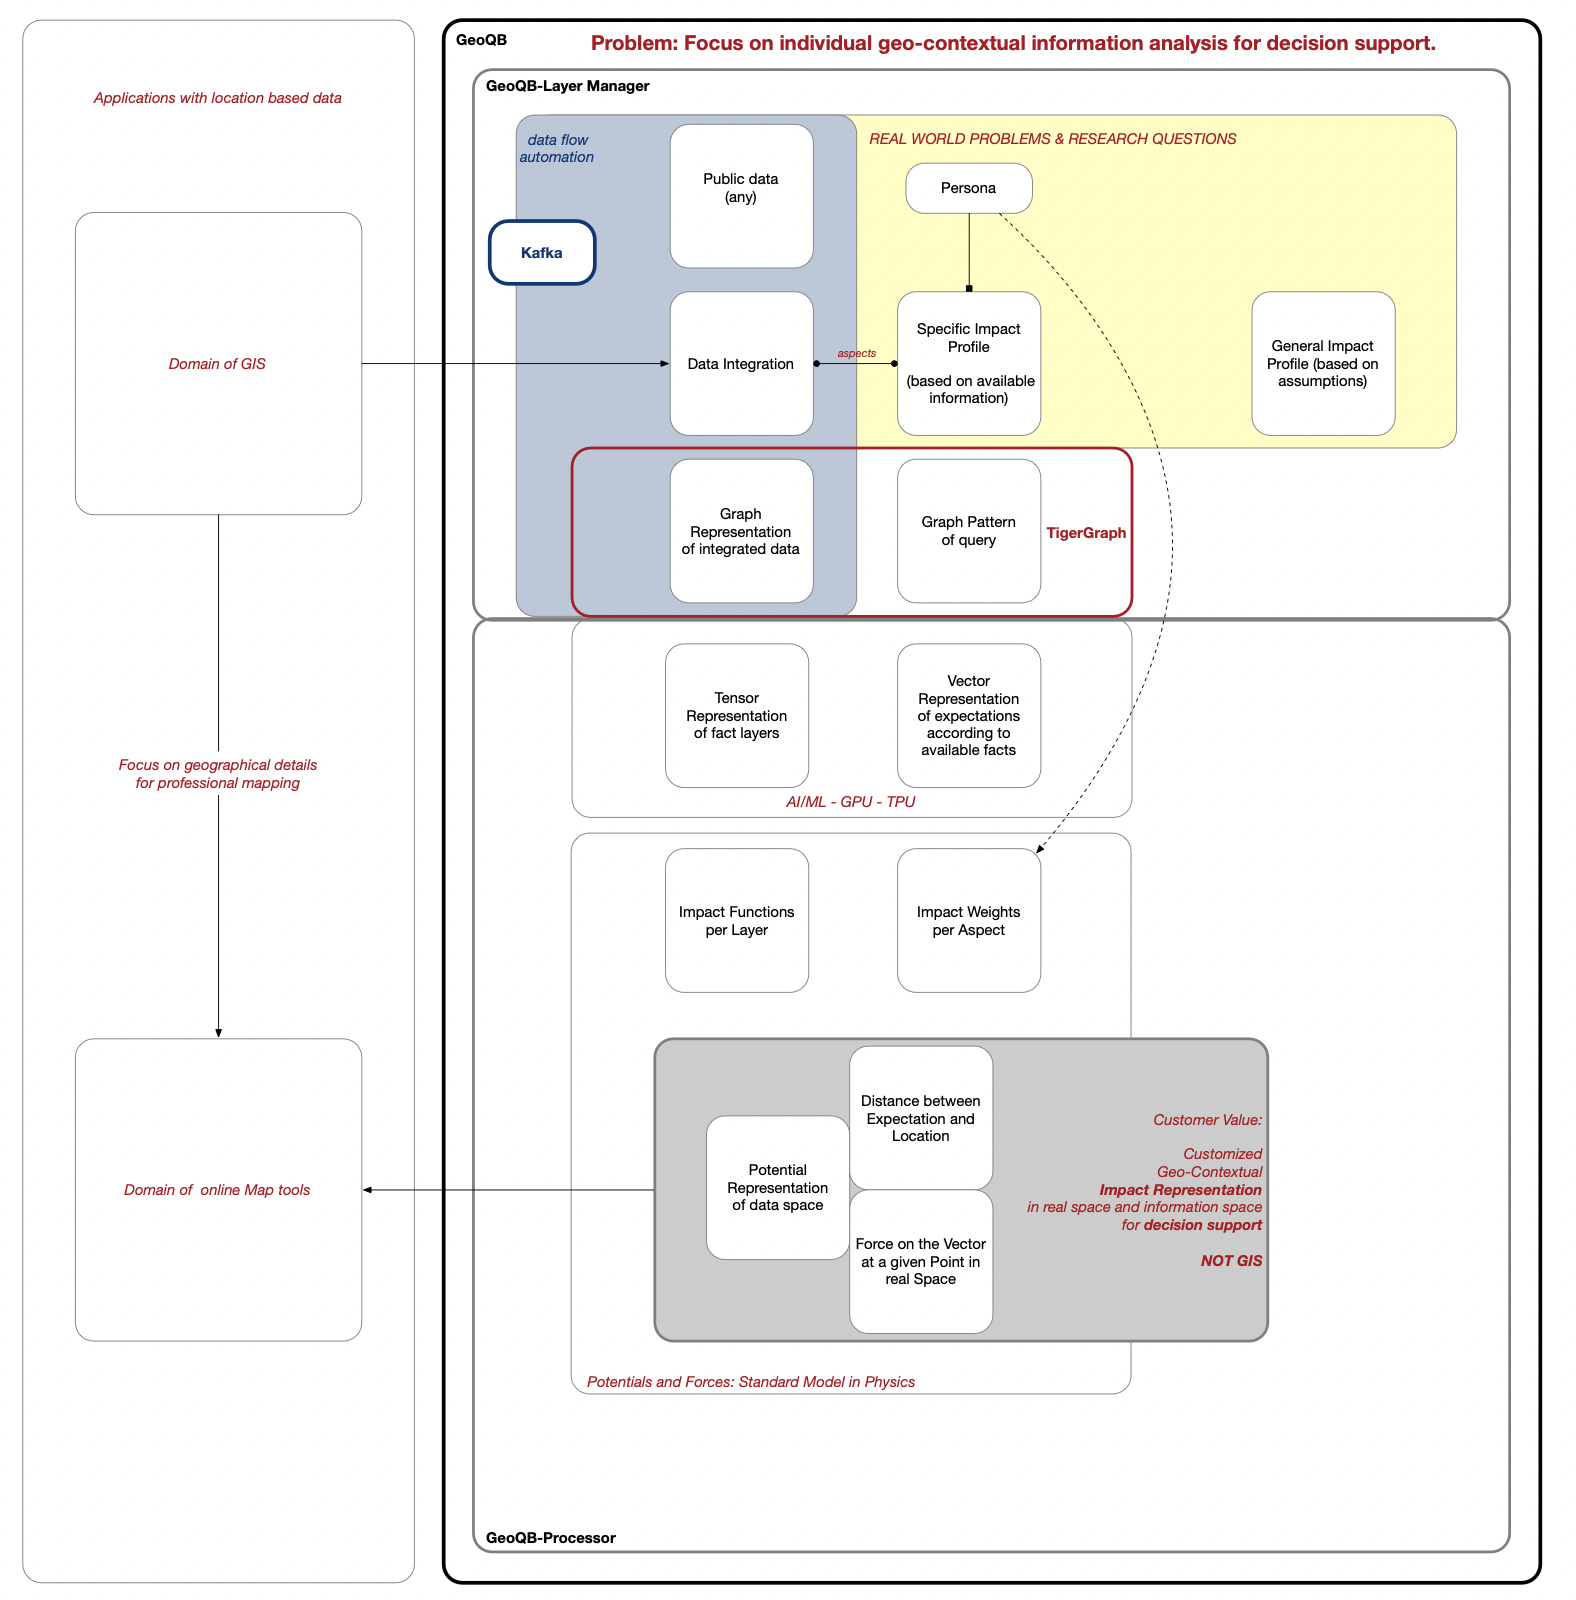
Architecture Overview - pyGeoQB
-
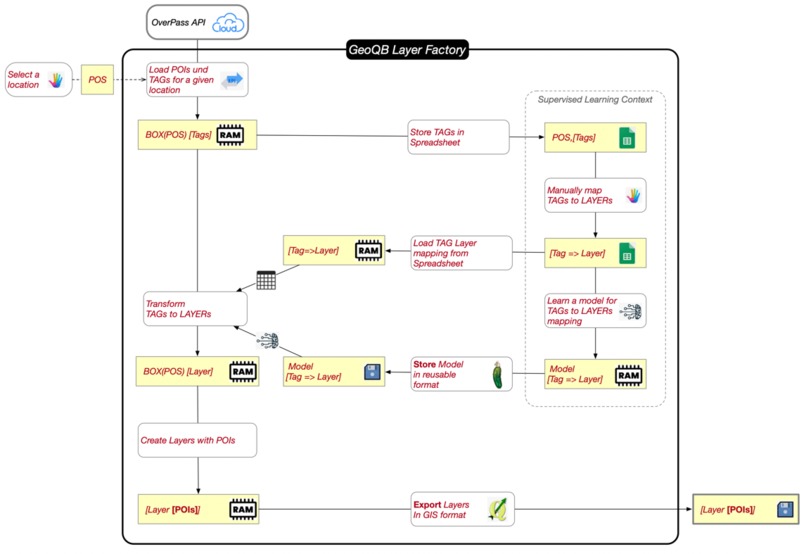
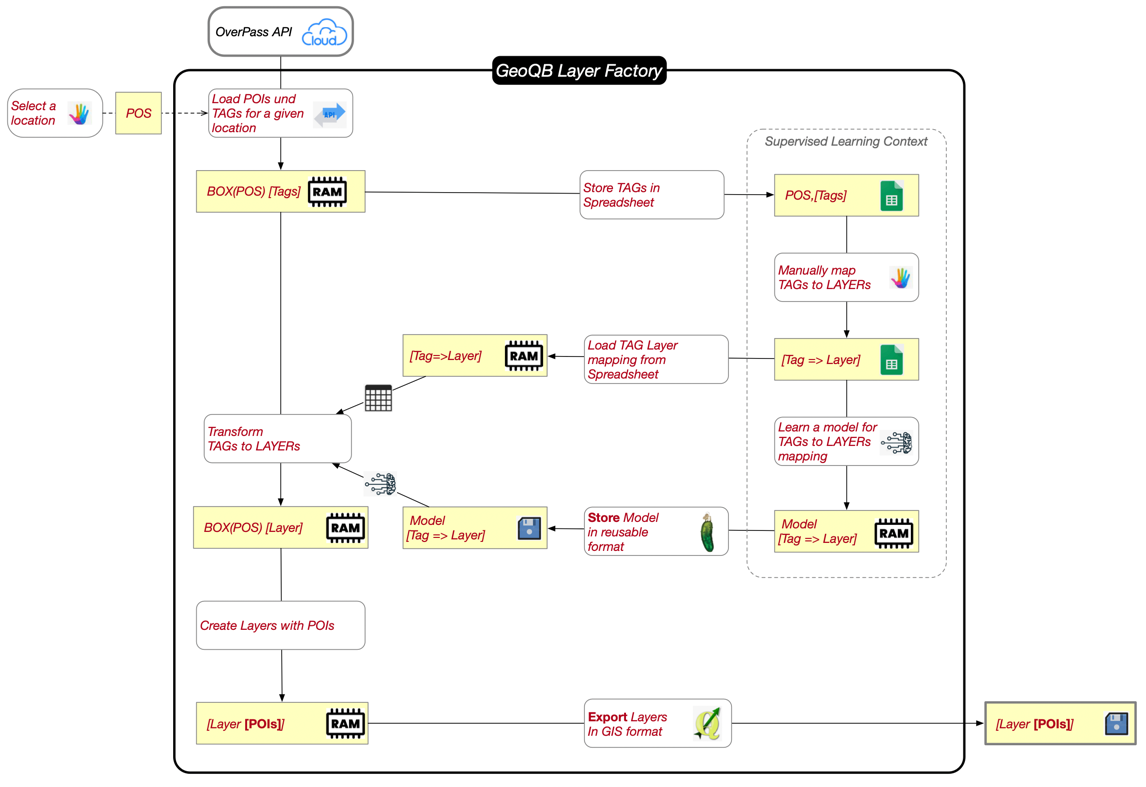
pyGeoQB - LayerFactory

Inspiration
In 2015 we have developed a method to measure the 'representation index' of topics in Wikipedia. Wikipedia has been used as a proxy to study human interaction with complex technical systems. Since then, I was hooked to the idea, of merging arbitrary public data in a geo-context. Creating a personalized map which represents either the geo-local representation of facts & things or even better, their impact on my personal profile became my goal - but without studying GIS systems, and Ontology design using OWL and RDF it was a hard challenge. We decided to develop a proper graph based data model on top of TigerGraph.
There is another element of inspiration to our project: Terraform. What Terraform is for managing cloud infrastructure, GeoQB is for multi-layer graph data management.
What it does
pyGeoQB is used to manage multiple graph layers from a variety of sources, using "layer definition queries". We keep the metadata in a data pod - so the date can be shared easily. Initially using local folders, or Github based versioned data pods. Support for SOLID data pods will come soon!.
How we built it
The initial version is a Python package for Python3. No active service is needed. This allows you using it in your own applications, e.g., in Flask applications, or in Jupyther notebooks, or in Google Collaborate.
Challenges we ran into
Challenge 1
One challenge is the absence of standards for managing data from multiple domains. We do not intend to engineer more ontologies, but rather, we want to reuse existing ontologies and hence, reusing existing triple stores should become easier in the future.
Challenge 2
Mapping object data and metadata into the property graph depends on information about future use-cases and expected queries. Analysis algorithms, such as k-means clustering require vectors as input, rather than edges and nodes. We have to manage the integration of RDF data, property graphs, and ML library specific formats as fluent as possible.
Challenge 3
Managing complex large distributed data structures requires easy tracebility and transparency over all transformation steps. No matter what role you are in - analysts, algorithm developers, data product creators need transparency along the data processing pipelines - ideally they follow the FAIR data principles. But currently, no standards do exist.
Challenge 4
Managing data updates requires a different approach - preferably, a continuous change event stream should be handled by the system, so that the modeled multi-layer graph can evolve over time. Real time data processing is crucial and will drive acceptance of future graph data applications.
Accomplishments that we're proud of
We were already able to automate the data ingestion from 3 different technical system into a multi-layer property graph, managed in a cloud based TigerGraph instance. Using SPARQL and Overpass QL allows us to interact with a variety of public open data systems. Static data layers provided by the data for good project have been integrated. Managing the layer definition and additional domain data in a public data pod or in a Kafka topic allows us cloud native operations and to become Web3 - ready. Users do not have to focus on managing files on their workstations, but rather utilize cloud technologies, and higher abstractions, such as the managed multi-layer graphs we provide.
What we learned
We learned a lot about using TigerGraph and pyTigerGraph. Mapping data from ER models and RDF data into the property graph data model was the most important domain we increased our experience.
Besides the improvement in the technical context, we also learned, that a lot of collaboration will be needed in the future. Data quality and a wide acceptance of public data can only win if users and providers of data come closer together. This holds for commercial systems, for public solutions used by the society, and also for research and free use-cases.
An inversion of control and active management of personal information, such as personal impact profiles, are important aspects of a data centric future. E.g., a personal impact profile allows context sensitive analysis and controlled personalization and customization of data products.
What's next for GeoQB
With pyGeoQB we intend to provide a systematic quality analysis of available open data sources with a focus on ESG goals and sustainability information. The question is: How can individuals know more about the sustainability aspects in their neighborhood, and it's evolution. Missing data can be seen as an indicator of missing awareness. Once the data reaches a critical mass, also awareness will grow, and positive action my start to change the way we interact with our world, using our public data.


Log in or sign up for Devpost to join the conversation.