-
-
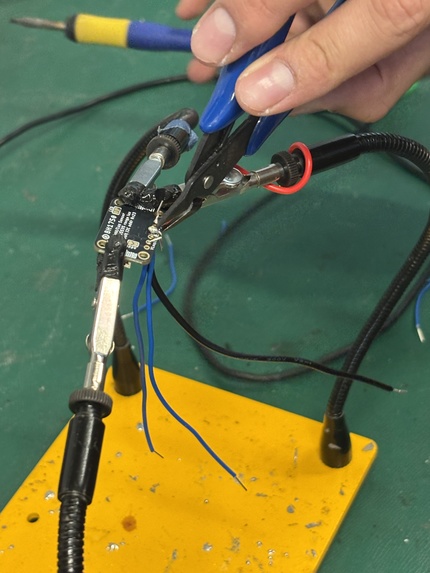
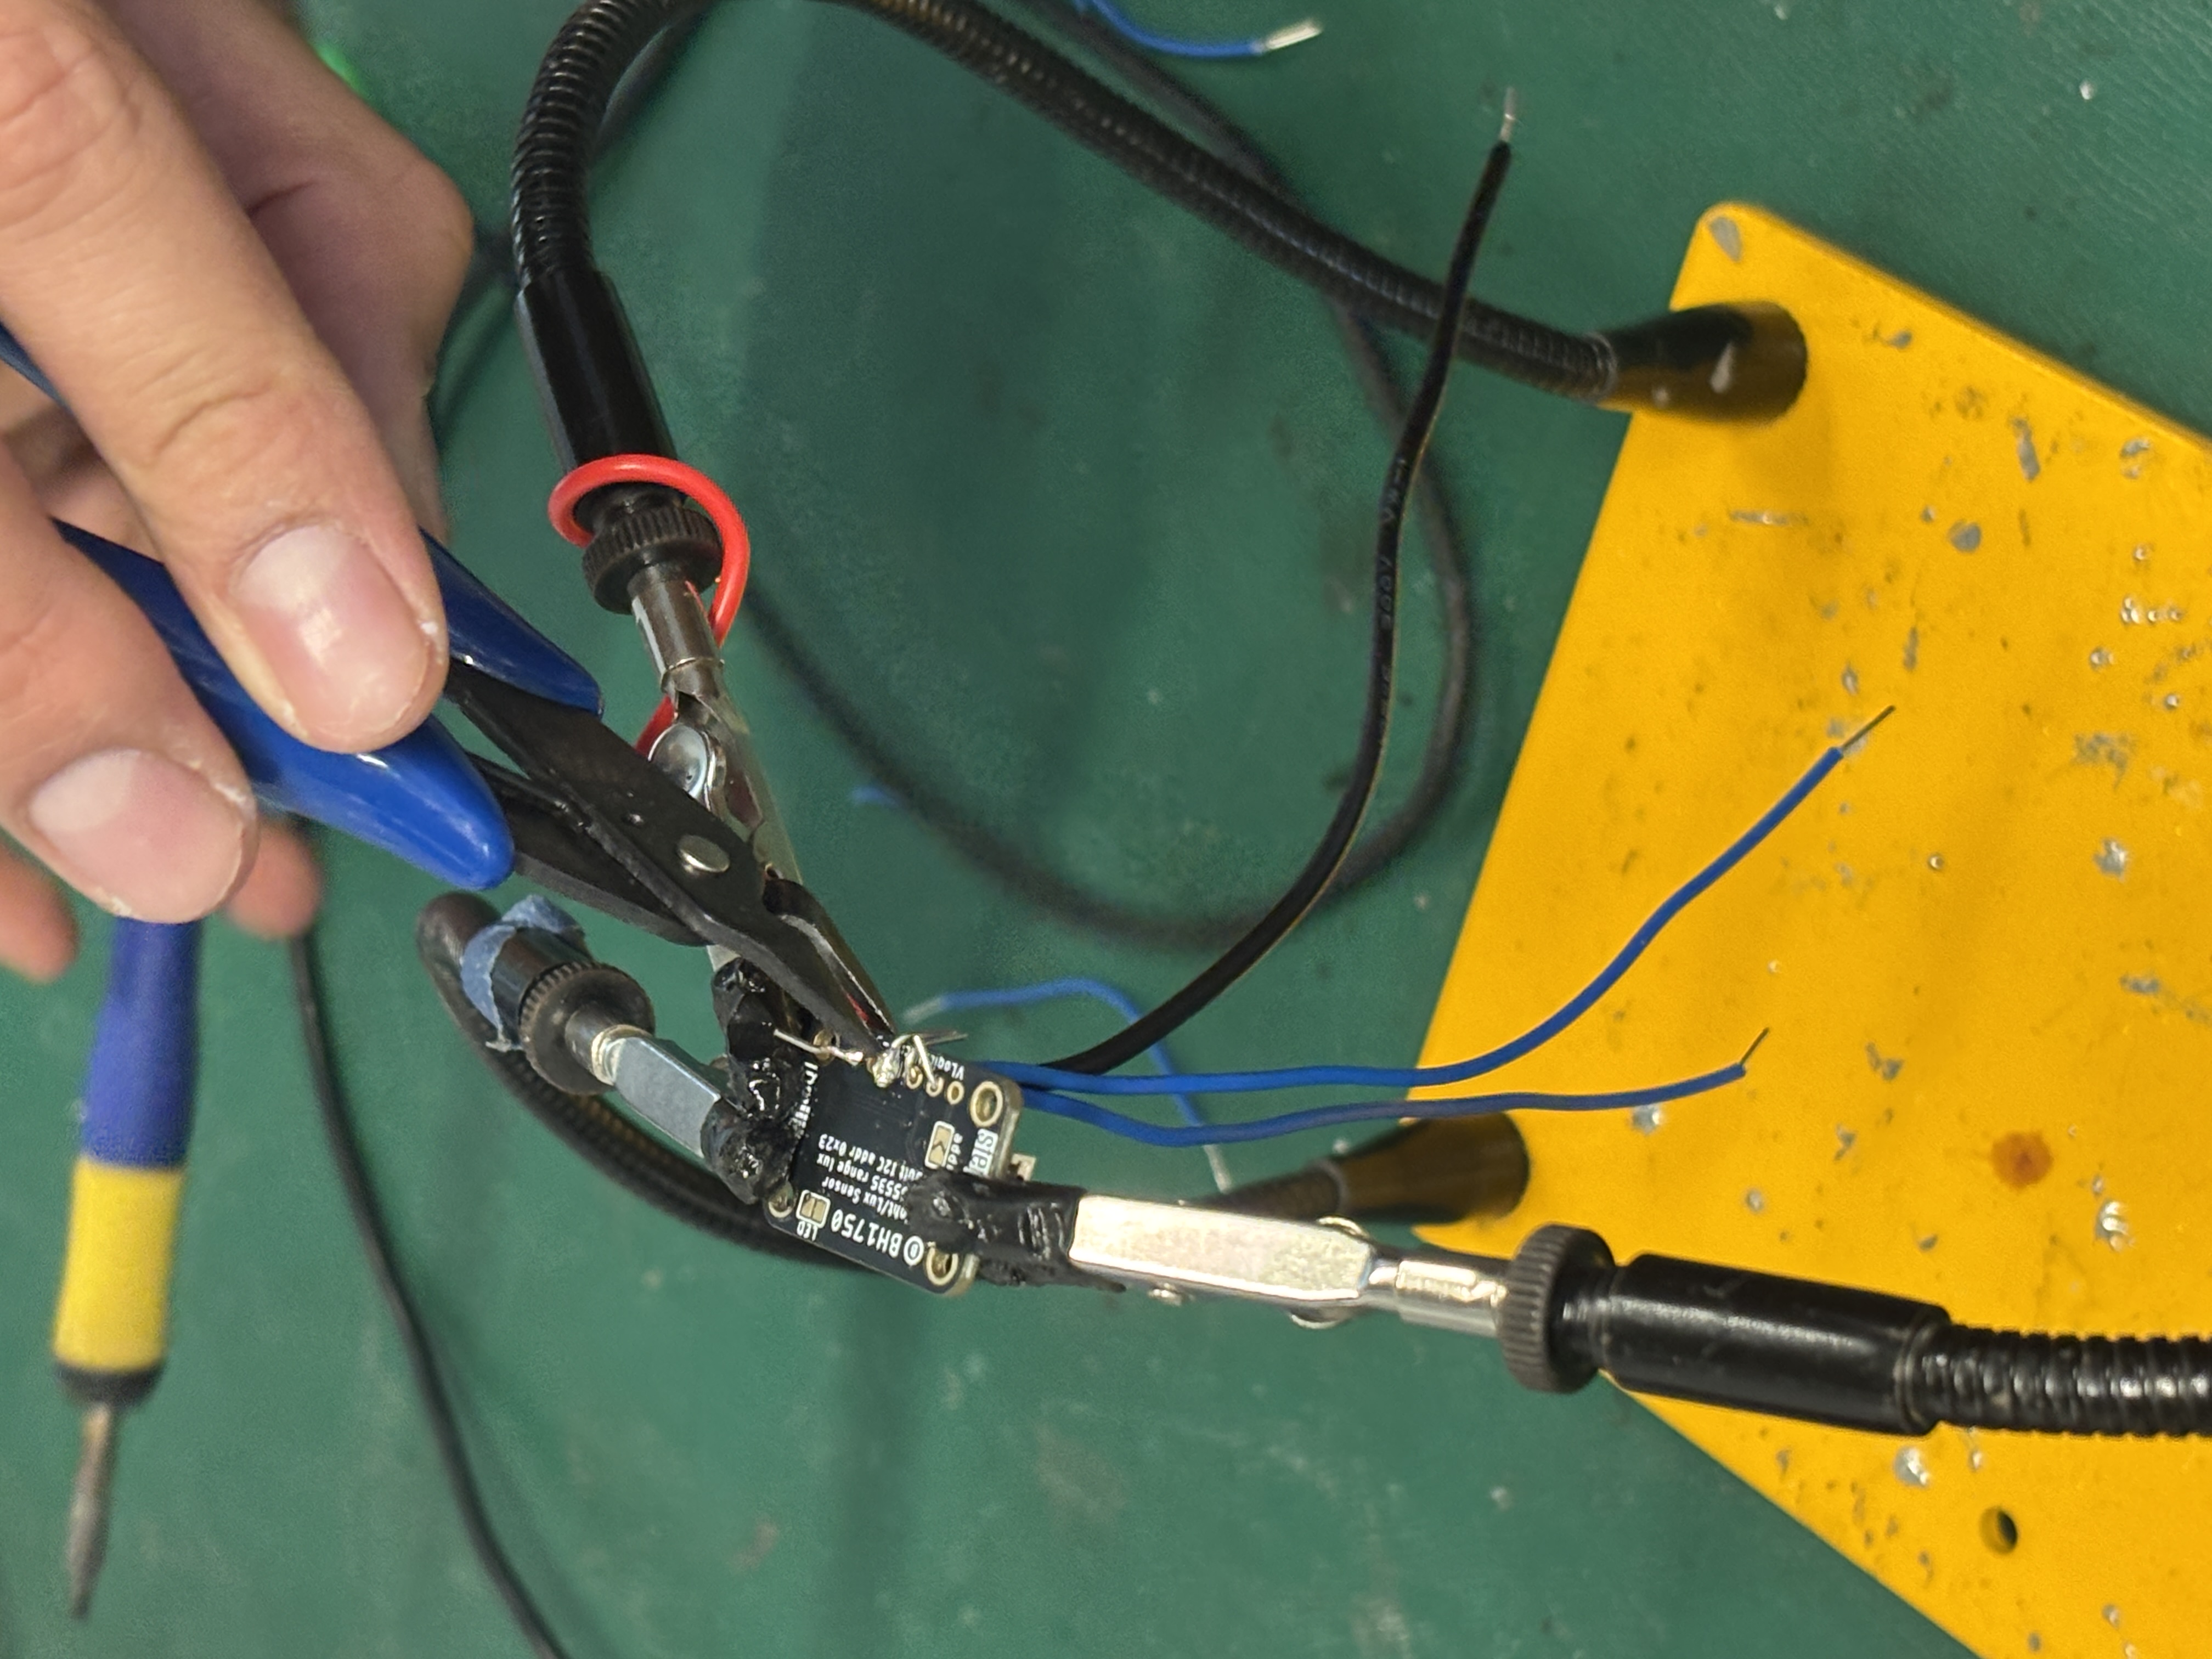
Soldering the BH1750 for light sensing
-
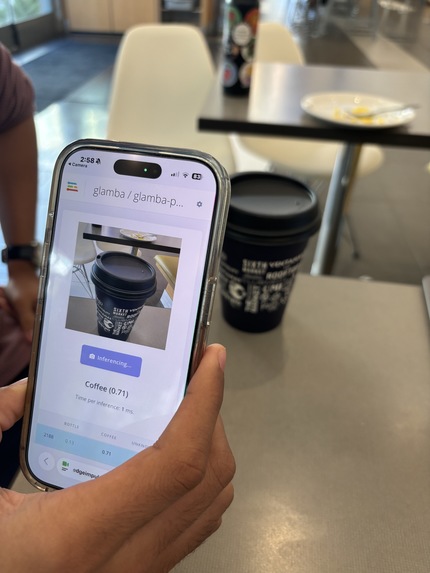
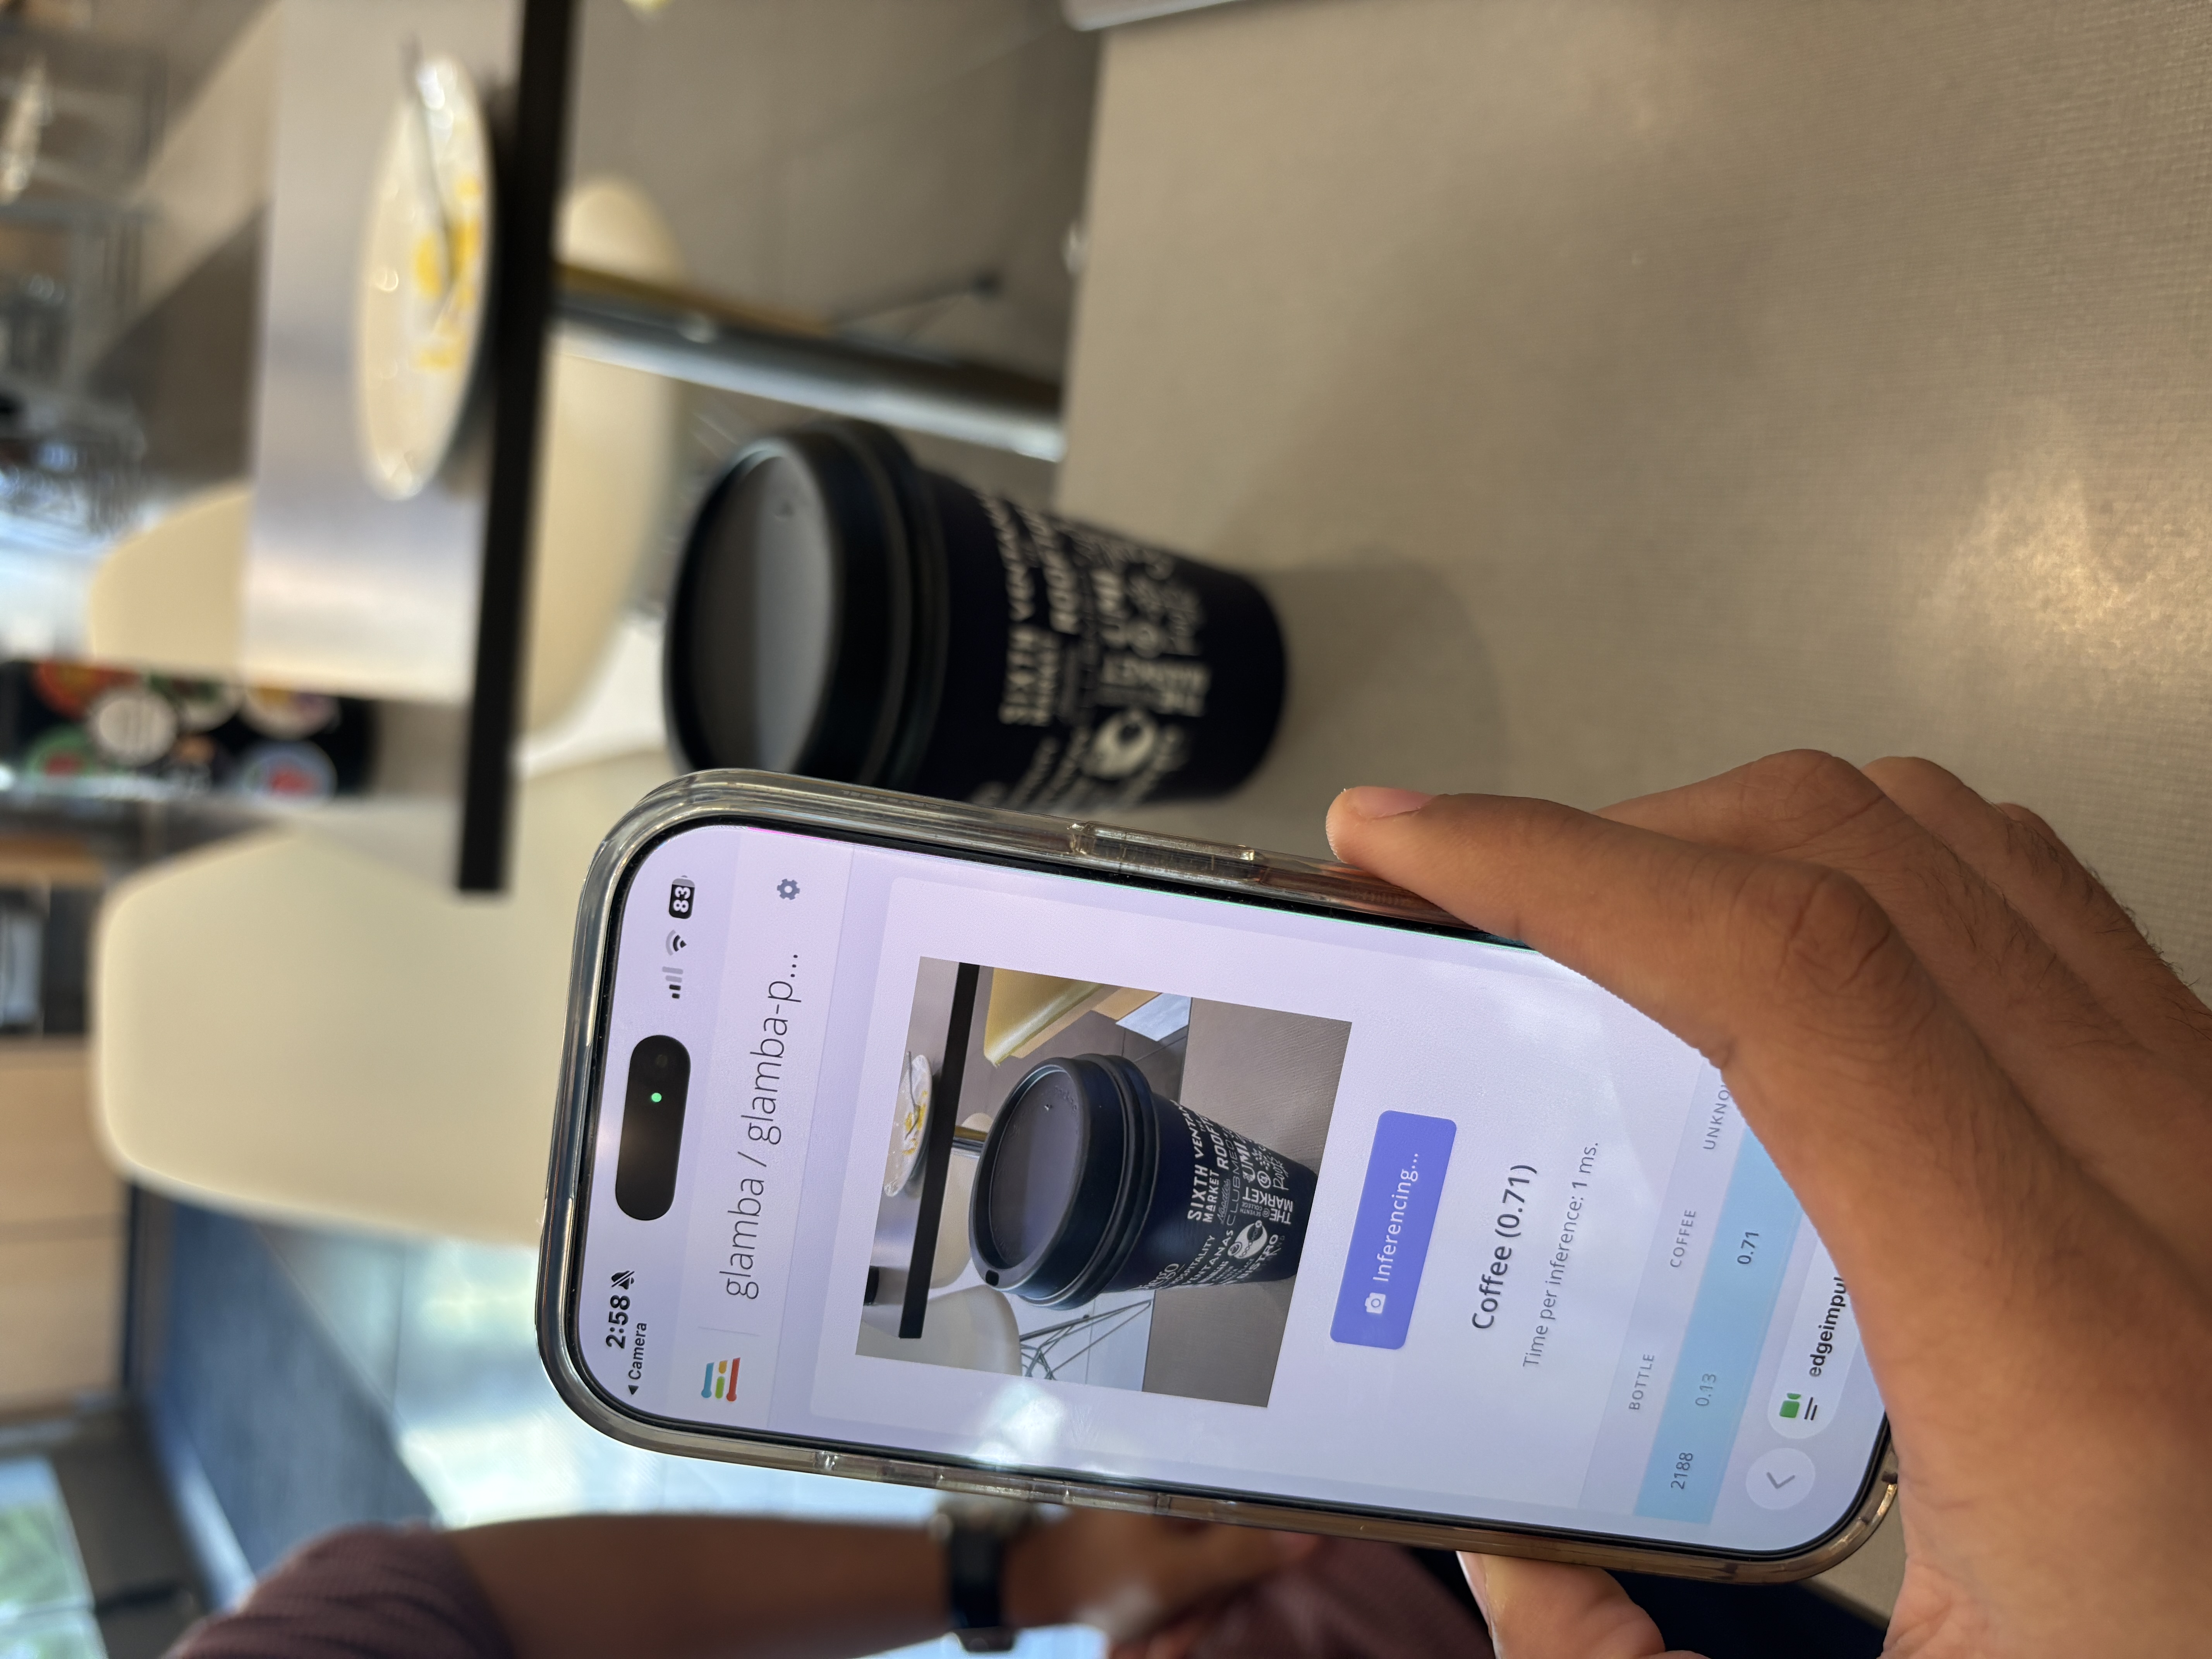
Testing out Edge Impulse by building a machine learning model
Inspiration
Walking around campus, our group often felt that the hottest areas with the most light shining on them were often not being taken advantage of. If an area has very high light intensity, why not install solar panels on it to improve efficiency while keeping the environment green and reducing the need to use fossil fuels and other harmful non-renewable energy sources that end up harming the environment by releasing greenhouse gases?
What it does
Simply put, GeoPulse collects environmental data and analyzes it to determine how suitable a location is for solar energy generation. Using sensor data such as light intensity, temperature, and humidity, our system processes the information through a machine learning model that calculates a viability score for solar panel installation.
The results are displayed on an interactive map that highlights the areas with the highest potential for efficient renewable energy generation. Our system uses environmental sensor data and machine learning to identify locations on campus that are suitable for renewable energy installations, specifically solar-powered charging stations. By collecting temperature, humidity, and light intensity data from sensors placed around campus, we trained a neural network model that classifies locations as suitable, borderline, or unsuitable for solar energy generation. This information can be used to determine where electric scooters across campus could be charged using renewable energy instead of grid electricity. To make the results accessible and practical, we built a web platform that visualizes these locations and displays confidence scores for solar viability. The website allows users to explore campus maps and see where renewable-powered scooter charging stations could be deployed most effectively, helping support cleaner transportation and smarter energy infrastructure.
How we built it
Our system combines hardware sensors, machine learning, and a web-based visualization platform. Environmental data is collected using: BH1750 sensor for light intensity DHT11 sensor for temperature and humidity These sensors are connected to an ESP32 microcontroller, which records the data and stores it on a Micro SD card.
The collected data is then processed using a machine learning model built with Edge Impulse, which analyzes the environmental features and predicts the solar viability score of each location.
Finally, the processed results are displayed on a web interface with a map, allowing users to visualize which areas are most suitable for solar panel installation.
Challenges we ran into
Training the machine learning model proved to be one of the biggest challenges. We had to experiment with multiple training configurations, tune hyperparameters, and carefully label the dataset to ensure that the model could correctly distinguish between viable and non-viable locations.
Creating a balanced dataset with enough representative examples was critical for improving prediction accuracy. This is because the model achieved 94% overall test accuracy and classified the suitable and unsuitable classes very well. However, performance on the borderline class was poor because the dataset contained very few mid-range samples. This indicates that the model learned the extremes of solar viability effectively, but additional balanced training data is needed to improve classification of intermediate conditions.
Accomplishments that we're proud of
We are particularly proud of successfully integrating hardware, machine learning, and a web-based visualization system into a working prototype.
Our sensor setup using the ESP32 and Micro SD card reliably collects environmental data, and our front-end interface provides a clear and intuitive map-based visualization that allows users to easily identify optimal solar energy locations.
What we learned
This project taught us that building accurate AI models requires well-structured data. Organizing and preprocessing the dataset properly made it much easier to train and improve the model.
We also learned how to integrate embedded systems, machine learning, and web development into a cohesive system.
What's next for GeoPulse - Finding the Pulse of the Earth
Using more features, such as a time axis in the data - how long the light intensity is actually there for, would significantly improve results from our AI model, as it would tell us about how much energy is being fed there. For example, a solar panel in a region with low light intensity but prolonged for a very long time could harness more energy than a solar panel in a region with less light intensity.
Built With
- edgeimpulse
- python

Log in or sign up for Devpost to join the conversation.