-
-

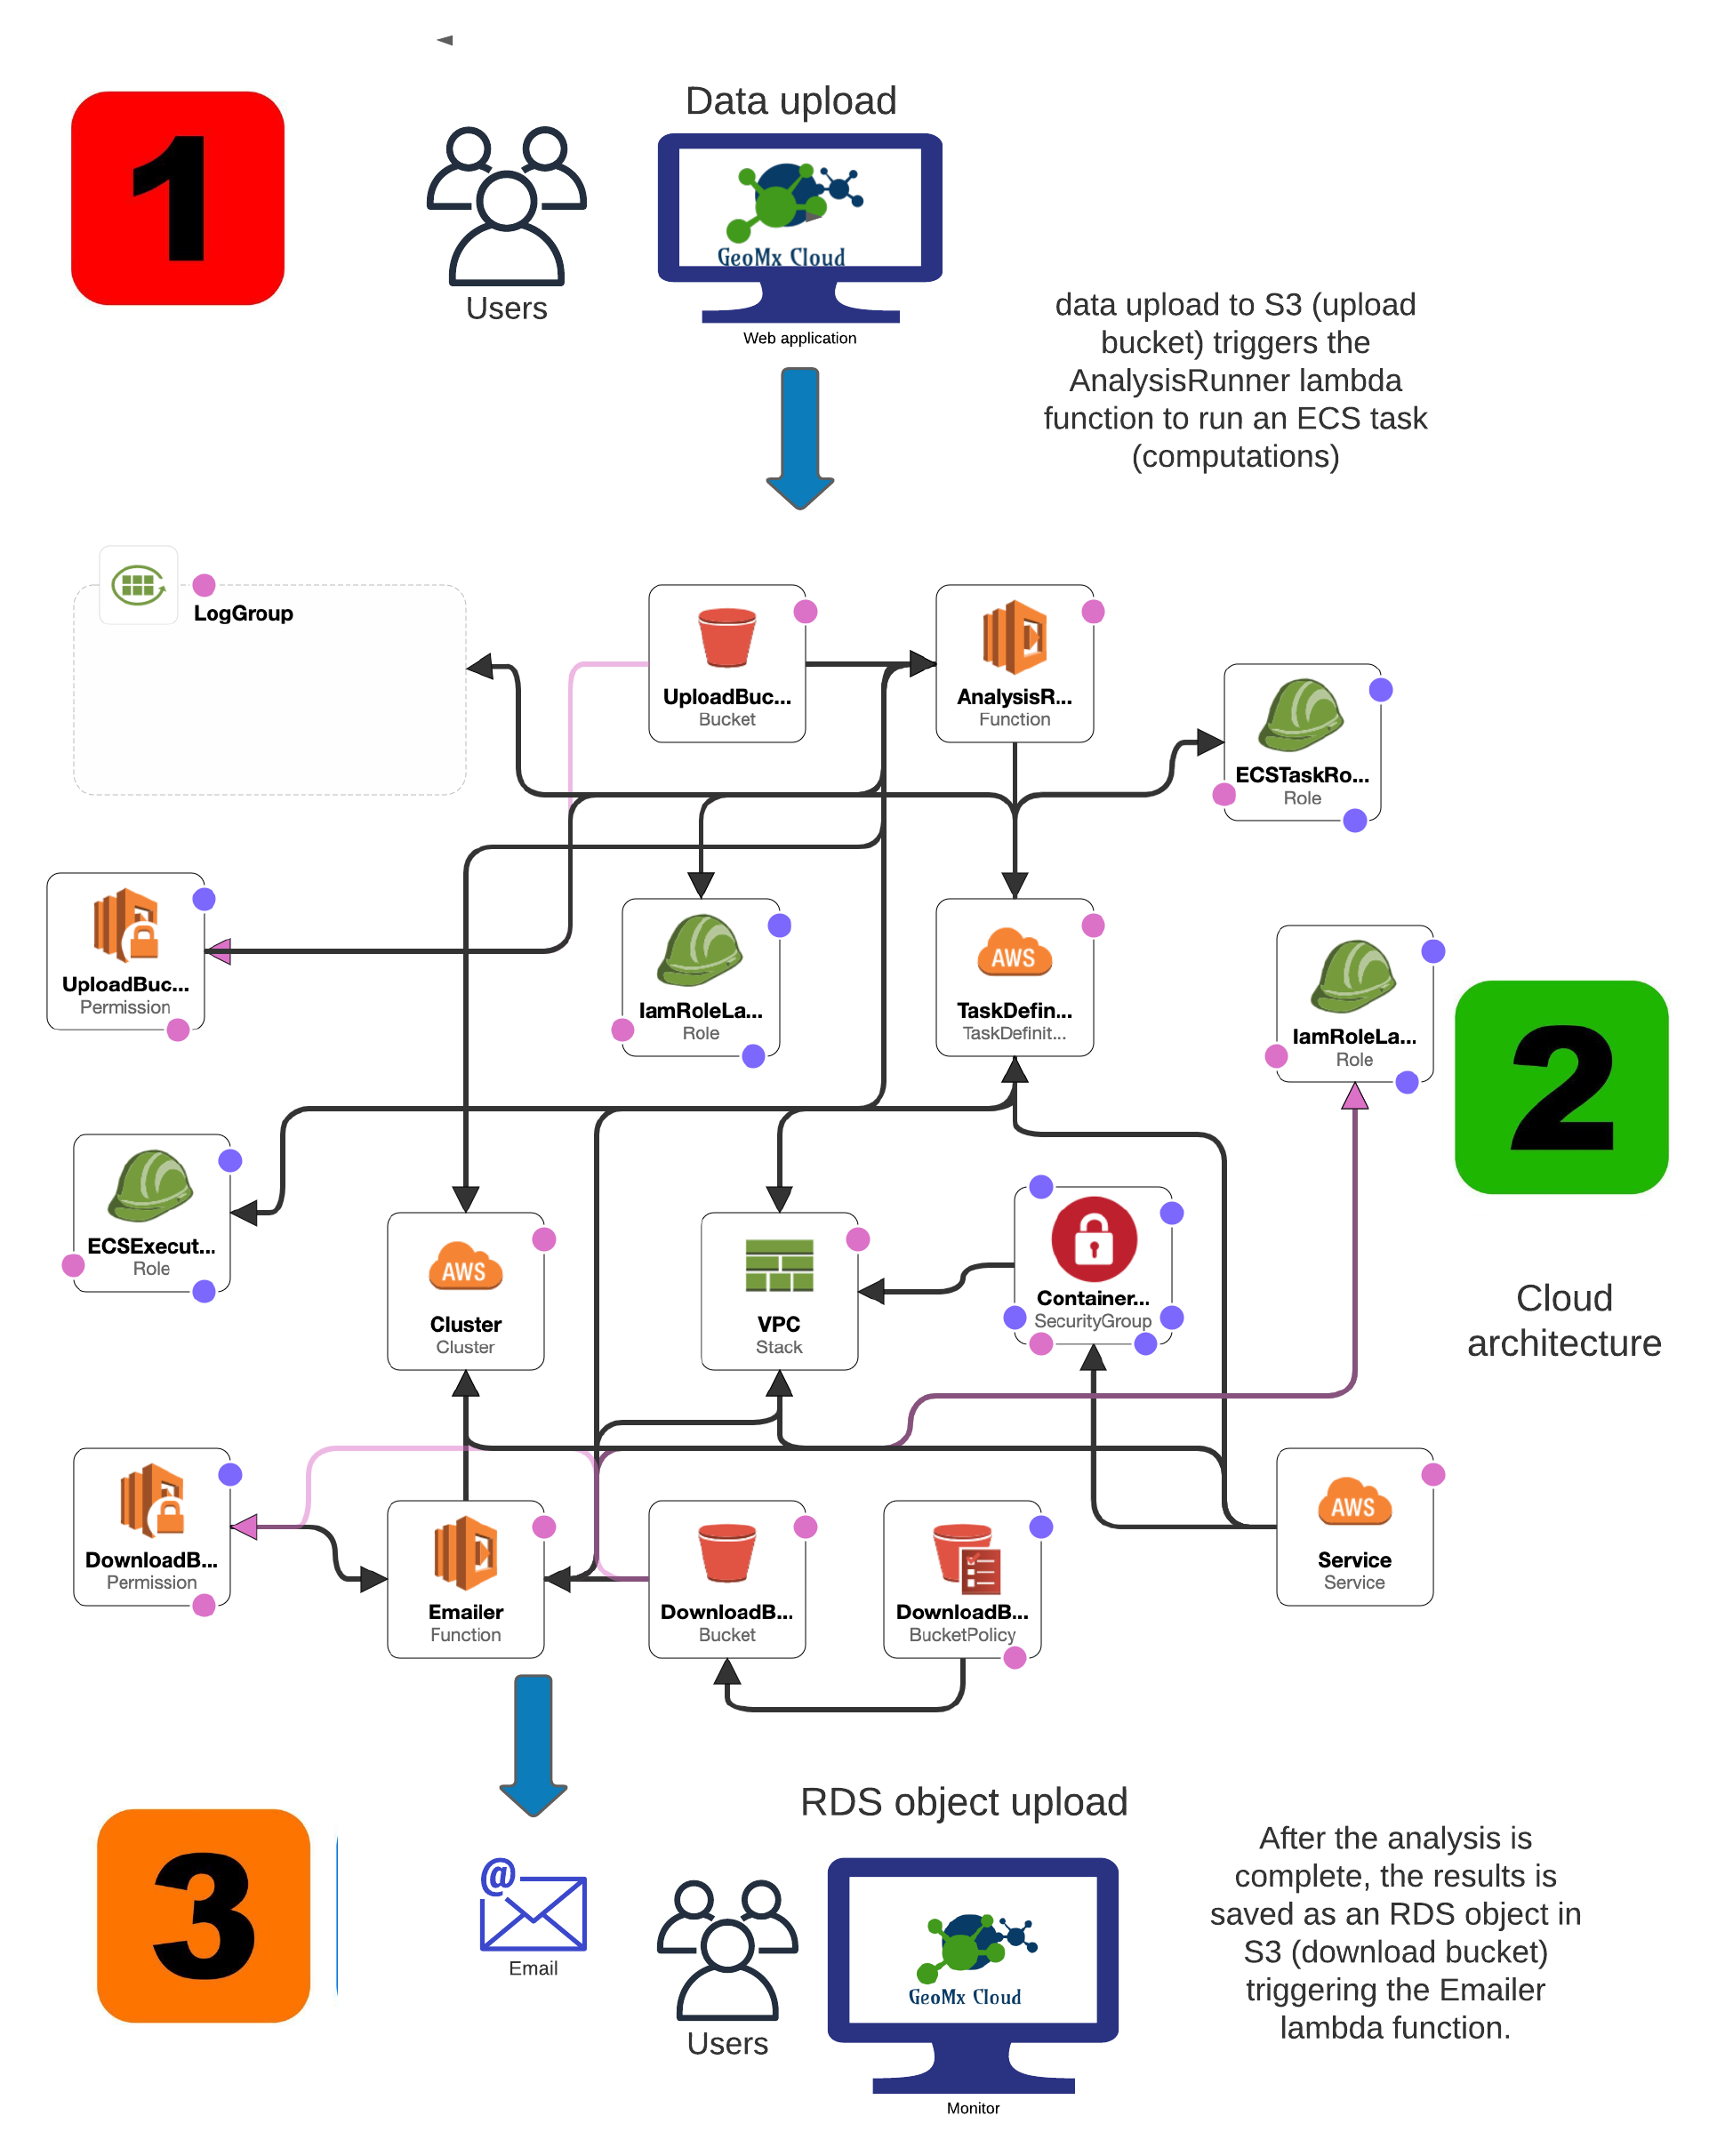
Application architecture
-

app logo

Inspiration
I am interested in answering questions using as many computational tools as possible. However, more computation results in higher latency periods and slows down applications. Therefore I decide to decouple the computation from the visualization.
What it does
Automation all the computation using serverless cloud computing from Amazon Web Services. Therefore, servers are only active when computational analysis is being run, otherwise no servers are active, reducing cost. The results are packaged in an rds R object and emailed to verified users using a signed URL. The user downloads the objects and uploads it to GeoMx cloud for fast interactive visualizations.
How we built it
The cloud infrastructure was developed using Cloudformation (AWS infrastructure as Code). A docker image hosted on DockerHub is used to run the anlayses, given the user uploaded data. Whereas the dashboard was developed using Shiny packaged into an R-library.
Challenges we ran into
Too many to count!
- Many hard to debug issues with RShiny.
- Many cloudformation stack errors: 1) The major one was that the Elastic Container Services required both an ExecutionRole and TaskRole with the appropriate permissions! The second was that the service kept re-running the task (job for single user) even though it completed. Fix it by changing the desired task count (steady state) to zero.
Accomplishments that we're proud of
1) That I made the deadline. 2) The cloud infrastructure is fully based on code which makes it highly scalable, trackable and maintainable!
What we learned
Learned how to synergistically uses various technologies and scripting languages!
What's next for GeoMx Cloud: automation of GeoMx analyses
1) I wanted to includes some deep learning examples as I can easily leverage Amazon Sagemaker or EC2 GPUs but ran out of time. 2) add cost of analyses per user job 3) allow users to save analyses (DynamoDB implementation but may be more costly)


Log in or sign up for Devpost to join the conversation.