Inspiration In today's hyper-connected yet polarized world, it is becoming increasingly difficult to understand the "big picture" of global public opinion. We are often trapped in echo chambers, reading text-heavy news that reflects only a narrow perspective.
We wanted to answer a simple question: "If the world had a voice, what would it say?"
We were inspired by the potential of AI not just to write text, but to simulate complex geopolitical viewpoints. We wanted to build a tool that visualizes agreement and disagreement on a global scale—instantly turning abstract sociopolitical debates into a clear, understandable heat map.
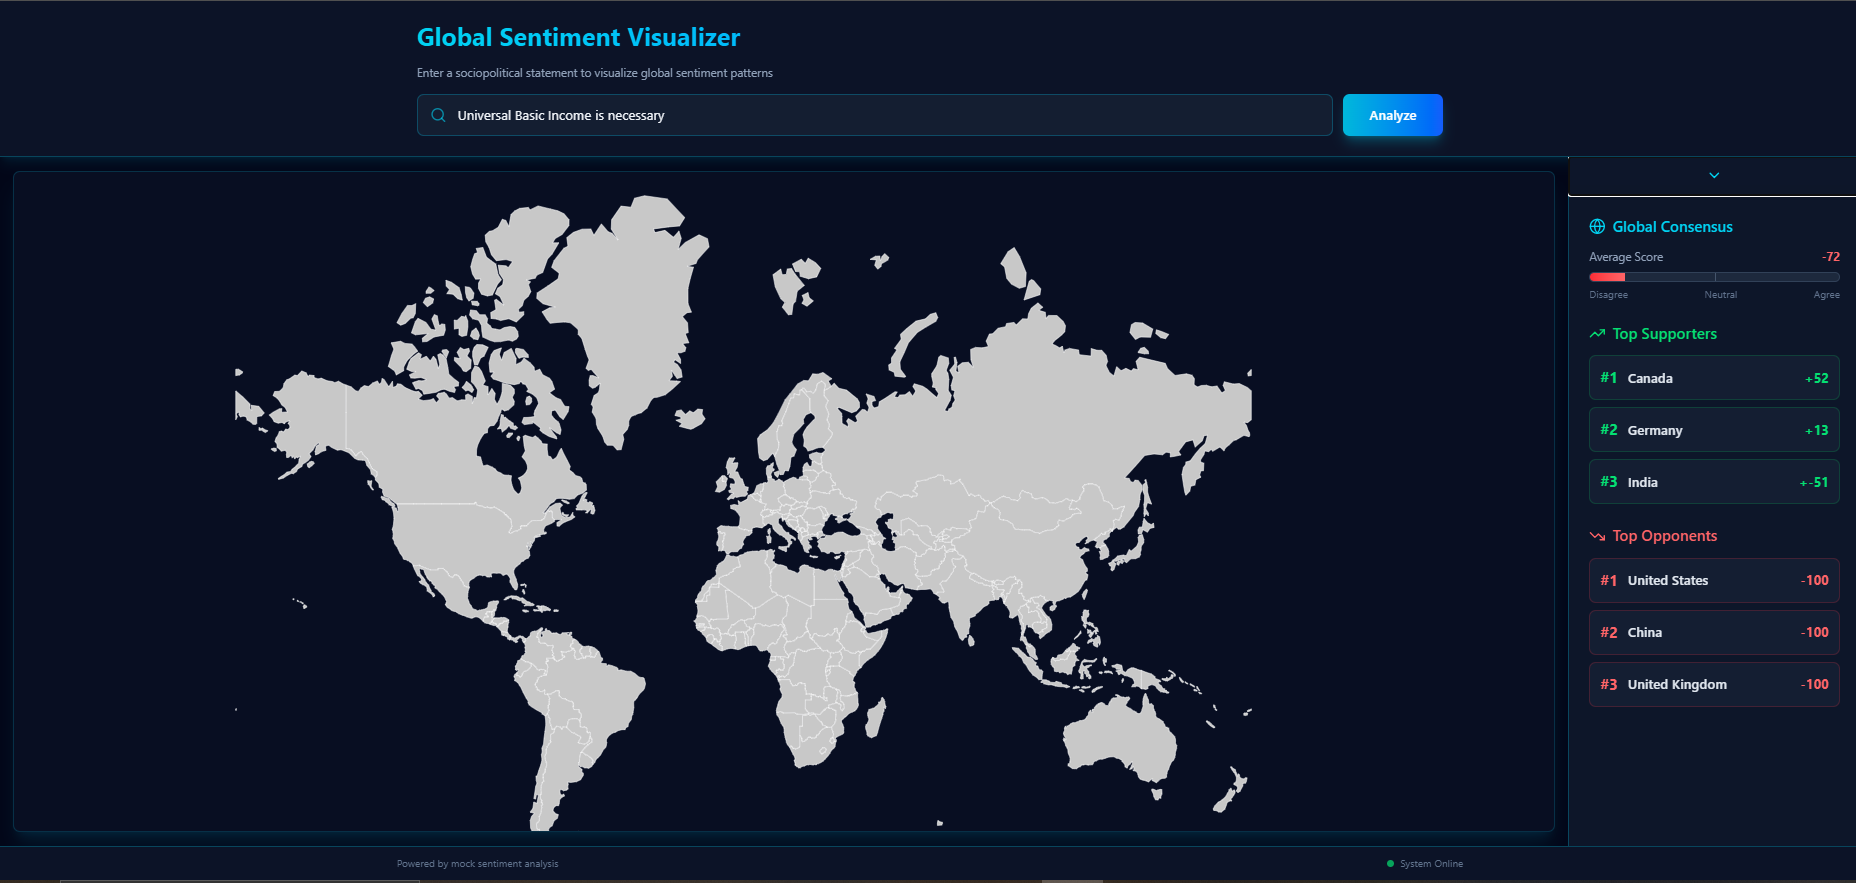
What it does GeoMind is an interactive, AI-powered sentiment dashboard.
Input: The user enters a statement or topic (e.g., "Universal Basic Income is necessary" or "Artificial Intelligence regulation").
Analysis: The system analyzes the geopolitical stance of major nations regarding that topic.
Visualization: It instantly colors a world map based on sentiment:
Green: Strong Agreement
Red: Strong Disagreement
Gray: Neutral/Mixed
Insights: A statistics panel displays the "Global Consensus Score," identifies the top supporting nations, and lists the strongest opponents.
How we built it We built GeoMind with a focus on speed and modern aesthetics:
Frontend: We used React (via Vite) for a lightning-fast single-page application experience.
Styling: Tailwind CSS was used to create the futuristic "Cyberpunk/Dashboard" aesthetic, utilizing dark modes, neon accents, and glassmorphism effects.
Visualization: We implemented react-simple-maps to handle the topological rendering of the world map and created a custom algorithm to dynamically interpolate colors based on sentiment scores (-100 to +100).
Logic: The current MVP runs on a robust simulation engine designed to mimic API responses, ensuring immediate visual feedback during the demo.
Challenges we ran into The biggest challenge was the 24-hour time constraint. We had to prioritize core features over perfection.
Map Integration: Mapping raw data values to dynamic SVG fill colors required precise calculations to ensure the gradients looked natural (smooth transition from Red to Green).
Responsive Design: Making the complex dashboard layout work seamlessly on both desktop and mobile screens required a flexible CSS Grid architecture.
Accomplishments that we're proud of The UI/UX: We are incredibly proud of the visual design. The dark mode dashboard feels professional and immersive.
Responsiveness: The application handles data updates instantly without page reloads.
Architecture: We built a clean, modular codebase that is ready to be scaled.
What we learned We learned a great deal about Data Visualization in React. Specifically, we learned how to bridge the gap between raw statistical data and visual geographic representations. We also learned the importance of "Rapid Prototyping"—making difficult decisions to cut non-essential features to ensure we had a working product by the deadline.
What's next for GeoMind This is just the beginning (MVP). Our roadmap includes:
Live API Connection: Connecting the backend to the OpenAI API (GPT-4) to provide real-time, fact-based sentiment analysis for any custom topic.
Detailed Rationales: Adding a feature where clicking on a country explains why they hold that opinion (e.g., citing local laws or cultural norms).
Social Sharing: Allowing users to export their maps and share their "Global Pulse" results on social media.
Built With
- css3
- git
- github
- html5
- javascript
- lucide-react
- react
- react-simple-maps
- tailwindcss
- topojson
- typescript
- vite

Log in or sign up for Devpost to join the conversation.