-
-
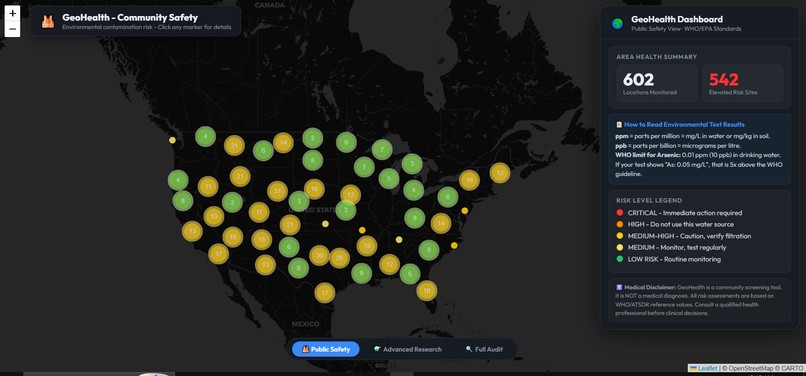
Public Safety Panel for general Public Users and Local Government Health Care
-
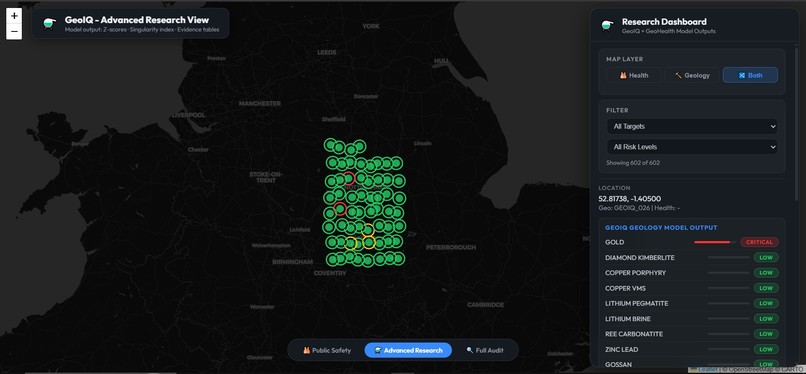
GeoIQ - Advanced Research View Model output: Z-scores · Singularity index · Evidence tables
-
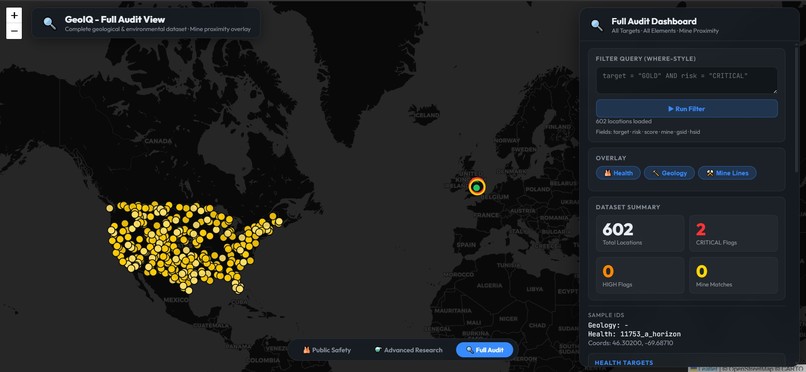
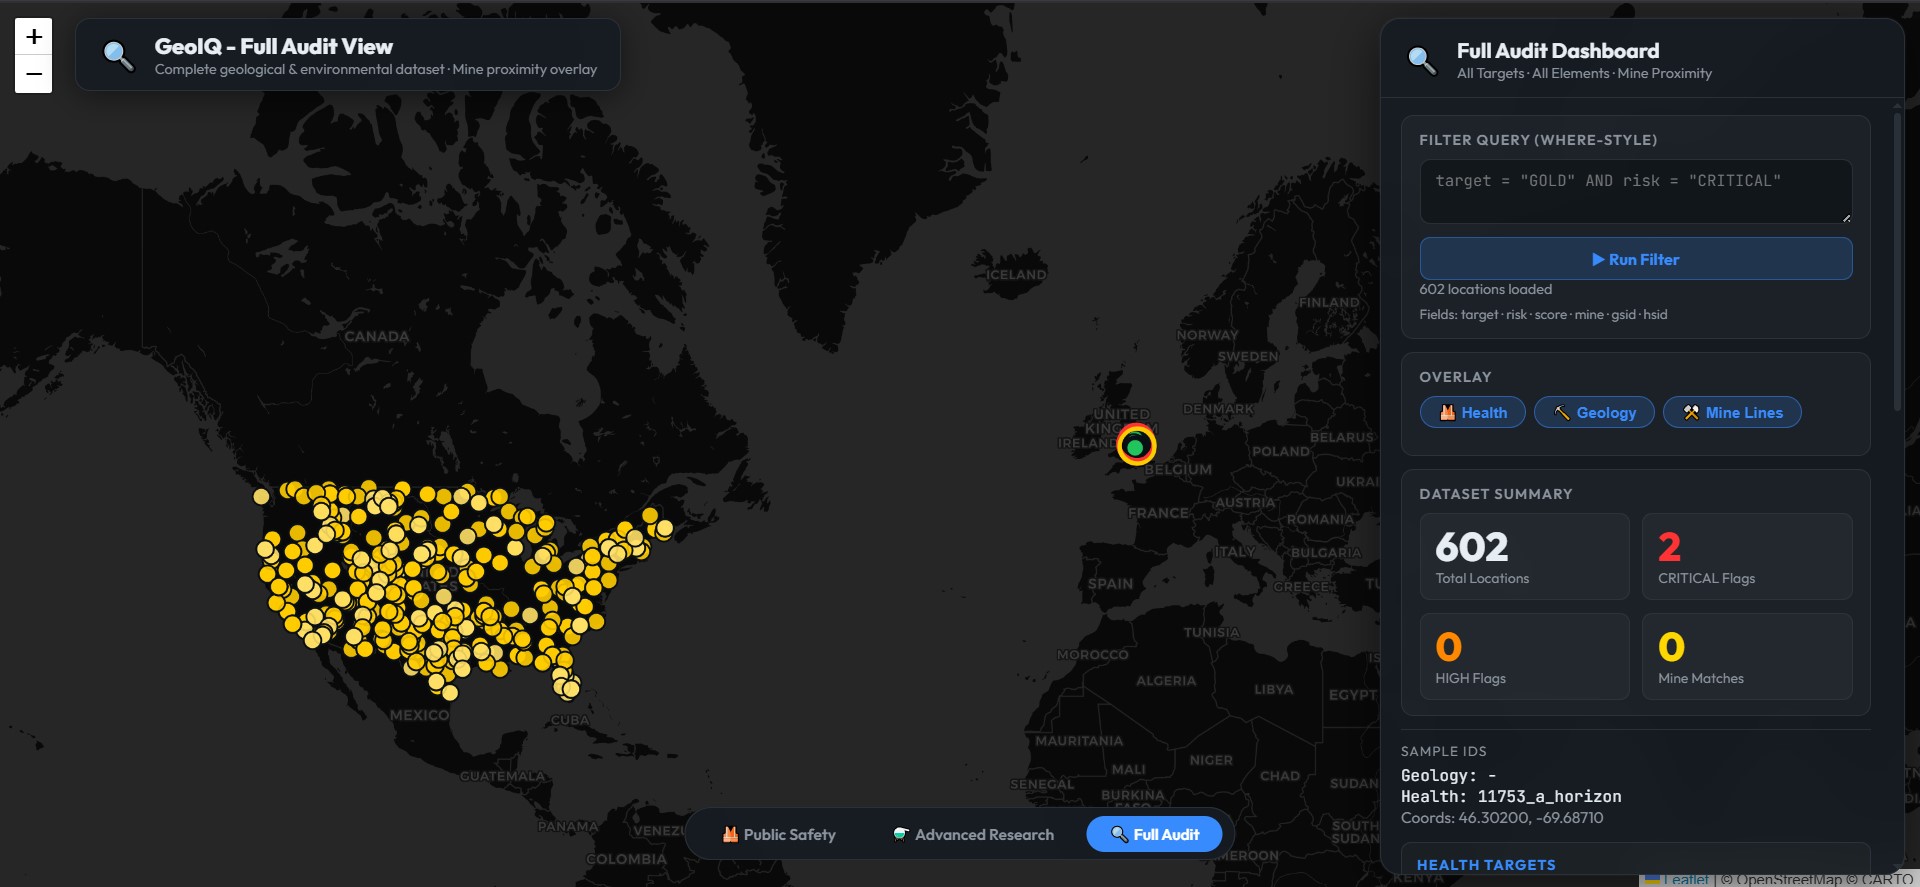
GeoIQ - Full Audit View Complete geological & environmental dataset · Mine proximity overlay
-
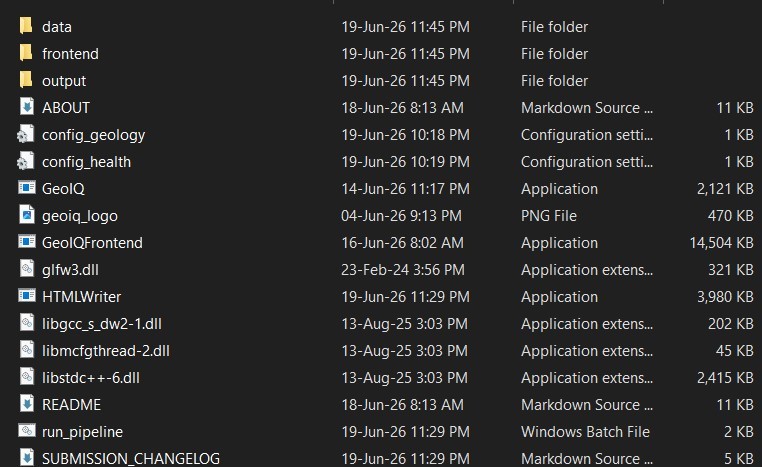
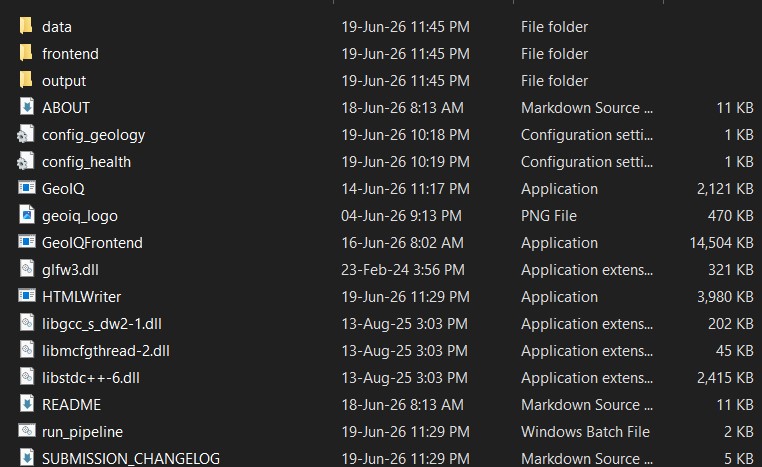
Folder View
-

GeoIQ.ALPHA-HEALTH logo


Inspiration
140 million people drink arsenic-contaminated groundwater. The WHO called the Bangladesh tube well crisis "the largest mass poisoning in history." The same geological formations that leach arsenic into drinking water also host critical minerals like copper, lithium, and gold. Mining companies collect rich geochemical surveys to find these minerals — but the data is almost never screened for public health hazards.
I grew up in Gopalganj, Bangladesh. Arsenic in groundwater is not an abstract problem here."In these communities, 'help is hard to find' because groundwater toxicity is invisible, and official data is locked away. Without data, communities rely on rumors—assuming water is safe just because it looks clear. GeoIQ was built for this track to act as a 'Rumor vs Reality' engine: replacing dangerous guesswork with verified, offline geochemical reality, and making life-saving health support obvious to the people who need it."
The question became: what if the same geochemical dataset, analyzed by the same engine, could serve two missions at once? Flag arsenic threats for communities that don't know their water is toxic. Map mineral potential for exploration teams trying to reduce wasteful drilling. One engine. Two outputs. No black boxes.
What It Does
GeoIQ is a C++17 geochemical intelligence engine with three access tiers:
Tier 1 — Public Safety: A community health officer opens an offline HTML dashboard. They see arsenic hazard alerts anchored to specific coordinates. They see WHO guideline comparisons. They see exactly which rules triggered the warning. They export a field report and dispatch a testing team. No Z-scores. No mineral targets. No raw data confusing the message.
Tier 2 — Advanced Research: A geologist sees the same geography but with full geochemical evidence: Z-scores, Cheng singularity indices (α), triggered rules, formula derivations, and multi-element anomaly classification across 10 targets including gold, copper, lithium, and zinc-lead.
Tier 3 — Full Audit: An auditor sees everything — geological targets, health assessments, and mine cross-references showing that a COPPER_PORPHYRY anomaly sits 0.33 km from an active copper mine. Verifiable. Traceable. Nothing hidden.
How We Built It
Backend Engine (GeoIQ.exe) — C++17, single binary, zero dependencies:
KD-Tree spatial indexing — Memory-stable 2D binary tree resolving neighborhood queries in
\( O(\log N) \)time across 14,000+ sample points. Grid search would freeze. KD-Tree completes in milliseconds.Inverse Distance Weighting (IDW) — Interpolates virtual grid compositions using:
$$ \hat{Z}(x) = \frac{\sum_{i=1}^{k} w_i Z(x_i)}{\sum_{i=1}^{k} w_i}, \quad w_i = d(x, x_i)^{-p} $$
Simple averaging smooths out contamination hot-spots. IDW preserves them.
- Cheng (2007) Power-Law Local Singularity — Isolates true geochemical anomalies from natural geogenic noise using scale-invariant regression:
$$ \log(C(r)) = (d - \alpha)\log(r) + c $$
Where \( \alpha < 2.0 \) signals anomalous enrichment and \( \alpha > 2.0 \) indicates background or depletion.
Multi-criteria Rule Engine — Expert geochemical logic classifying targets (AU-1 through AU-4 for gold, CU-1 for copper porphyry, AS-2/AS-3/AS-DEPTH for arsenic hazard). Each triggered rule is traceable. Each score shows its derivation:
\( score = \text{mean}([0.55, 0.30, 0.70]) \times \text{depth\_mod}(1.4) \times \text{confidence}(1.00) = 0.723 \).8-Sector Compass Dispersion Analysis — Scans neighboring samples in 8 compass directions, detects spatial gradients, and vectors back toward probable geological sources using exponential decay:
\( C(d) = C_0 e^{-\lambda d} \).
Frontend Generator (HTMLWriter.exe) — C++17, statically compiled:
- Pairs geology and health predictions within a 5 km Haversine radius
- Serializes data with tier-aware filtering — Tier 1 strips all mineral targets and Z-scores at the data level, not with CSS
- Generates three standalone, offline HTML dashboards using Leaflet.js with Canvas rendering
- Embeds official WHO toxicant thresholds for real-time popup validation
Challenges We Faced
The USGS dataset only had three elements (As, Fe, Mn). The engine could detect 10 mineral targets — but only if the input CSV had the right columns. The US dataset proved scale (14,571 samples, 542 anomalies). A 60-sample UK dataset with full element coverage proved multi-target capability. We ran both through the same pipeline.
Tier separation is easy to claim, hard to enforce. Hiding data with CSS isn't security — anyone can open browser dev tools. Our frontend serializer strips data at the JSON level. Tier 1 physically contains zero geological targets in its payload. Tier 2 strips mine cross-references. Tier 3 delivers everything. The separation is architectural, not cosmetic.
Explainability without clutter. Every Z-score carries its formula string — 42,711 evidence entries, every single one traceable. But a public health officer shouldn't need to know what a Z-score is. Tier 1 strips formulas and shows plain risk levels with WHO context. The transparency is there for the researcher. The simplicity is there for the community.
What We Learned
Dual-use AI is hard. The same copper anomaly that excites an exploration geologist could trigger dangerous illegal mining if published publicly. The same LOW arsenic reading that looks safe could cause complacency and stop routine water testing. Good architecture doesn't just flag risks in the data — it restricts who sees what, and it never says "SAFE" when it means "no anomaly detected."
Also: C++17 static compilation is unforgiving but worth it. A single .exe that runs on any Windows machine with no DLLs, no Python environment, no internet connection — that's what makes the tool usable in a remote exploration camp or a rural health outpost.
Built With
- c++17
- kd-tree
- leaflet.js
- mingw
- powershell
- sqlite


Log in or sign up for Devpost to join the conversation.