-
-

Landing Page
-

Dashboard
-

Map Feature
-

Compare Images
-

Visual Analysis
-

Difference Visualization
-

Email Alerts
-

Time Lapse
-

Interactive Animation Preview
-

Automated Monitoring
-

Analysis History
-
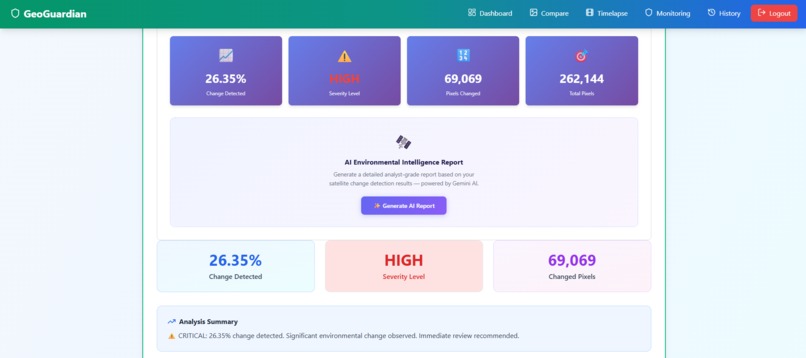
Generate AI Report Button
-
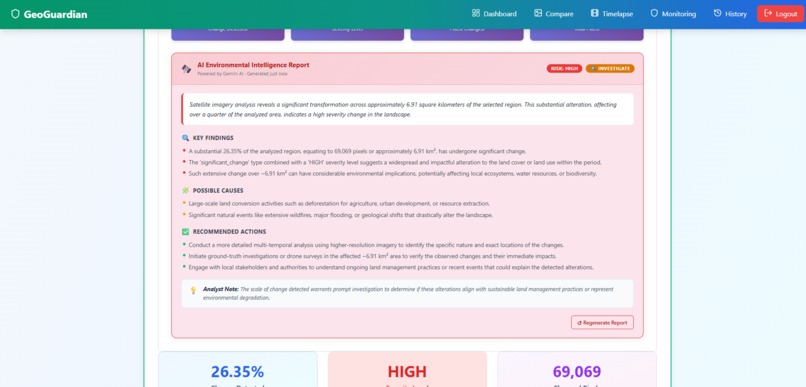
AI Environmental Intelligence Report


GeoGuardian - Democratizing Environmental Monitoring
Inspiration
Every year, millions of acres of forest are lost to deforestation. Wildfires devastate communities. Climate change accelerates. Meanwhile, commercial satellite monitoring services cost $5,000-$50,000 per month, making them inaccessible to NGOs, researchers, and communities who need them most.
I built GeoGuardian to democratize environmental monitoring - giving everyone access to professional-grade satellite analysis tools, completely free.
What It Does
GeoGuardian is an AI-powered environmental monitoring platform that provides:
- High-Resolution Satellite Imagery - 10m resolution Sentinel-2 data with automatic cloud masking
- AI Change Detection - Pixel-level analysis detecting deforestation, wildfires, floods, and urban expansion
- AI Environmental Intelligence Reports - Gemini-powered analyst-grade reports that translate raw satellite data into actionable insights, including key findings, possible causes, recommended actions, and urgency classification
- Time-Lapse Generation - Animated visualizations showing environmental changes over months
- Automated Monitoring - Schedule daily/weekly checks with instant email alerts for critical changes
- Interactive Maps - Visual region selection and coordinate conversion tools
How I Built It
Backend (Node.js + Express):
- Copernicus Data Space (Sentinel-2) API integration for professional satellite data
- Sharp library for image processing and change detection algorithms
- MongoDB + GridFS for efficient image storage
- Node-cron for automated scheduling
- Nodemailer for alert system
- Gemini AI API integration for generating environmental intelligence reports
Frontend (React):
- Interactive Leaflet maps for region selection
- Chart.js for data visualization
- Real-time progress tracking
- AI Report Card component delivering structured analyst-grade insights post-analysis
- Responsive design for mobile access
AI/Algorithms:
- Pixel-by-pixel RGB comparison using Euclidean distance
- Severity classification (low/medium/high) based on change percentage
- Automated change type identification
- Gemini 2.5 Flash for natural language environmental report generation from structured satellite data
What I Learned
- Satellite Data is Complex - Learned about coordinate systems, cloud masking, and data availability
- Performance Optimization - Handling large image buffers and real-time processing
- AI as an Interpreter - Discovered how effective LLMs are at translating dense technical data into human-readable intelligence reports
- Real-World Impact - Understanding NGO workflows and disaster response needs
- Scalability - Designing for thousands of monitored regions
Challenges I Faced
1. SSL Certificate Issues - Sentinel Hub API authentication errors required custom HTTPS agents
2. Windows Compilation - Canvas library failed on Windows, pivoted to Sharp for cross-platform support
3. GIF Generation - Initial approach using canvas failed, redesigned as interactive slideshow
4. Data Availability - Not all dates/locations have satellite coverage, implemented robust error handling
5. Change Detection Accuracy - Tuned threshold values (25-30 color difference) for optimal sensitivity
6. Satellite Data Provider Migration - Migrated from Sentinel Hub to Copernicus Data Space for a free, permanent data source, requiring authentication and endpoint changes while preserving the full existing pipeline
7. AI Report Reliability - Ensured Gemini API responses were safely parsed and that any failures fell back gracefully without disrupting the core analysis flow
Real-World Impact
For NGOs:
- Monitor protected forests 24/7
- Document illegal deforestation with evidence
- Save $60,000/year in satellite service costs
For Disaster Response:
- Early wildfire detection (potentially hours before ground reports)
- Flood extent mapping for rescue prioritization
- Earthquake damage assessment
For Researchers:
- Long-term climate change documentation
- Peer-reviewed publication material
- Free access to professional tools
Technical Achievements
- 10m resolution (25x better than NASA GIBS)
- Automated scheduling system handling unlimited regions
- Real-time change detection with under 30 second processing
- AI-generated environmental intelligence reports with risk classification and recommended actions
- Email alert system with professional HTML templates
- Time-lapse generation from multi-date imagery
- Interactive map-based region selection
- Complete user authentication and data persistence
What's Next
- Enhanced AI Monitoring Alerts - Include AI-generated report summaries directly in email notifications
- Mobile App - Native iOS/Android with push notifications
- Collaboration - Team sharing and annotation features
- API Access - Public API for third-party integrations
- Satellite Expansion - Add Landsat, Planet Labs, and MODIS data sources
Why GeoGuardian Matters
Climate change and environmental destruction are accelerating. The tools to monitor and respond exist but are locked behind paywalls. GeoGuardian levels the playing field - giving every environmental defender, researcher, and concerned citizen the same powerful tools that corporations and governments have.
This isn't just a hackathon project. This is infrastructure for environmental justice.
Built With
- api
- axios
- bcrypt
- chart.js
- express.js
- gridfs
- hub
- jwt
- leaflet.js
- mongodb
- node-cron
- node.js
- nodemailer
- react-chartjs-2
- react.js
- sentinel
- sharp


Log in or sign up for Devpost to join the conversation.