-
-
Dashboard
-
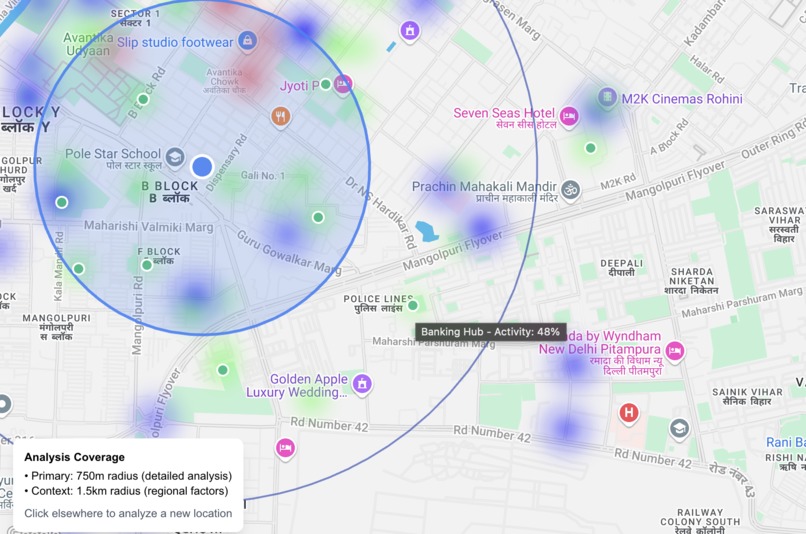
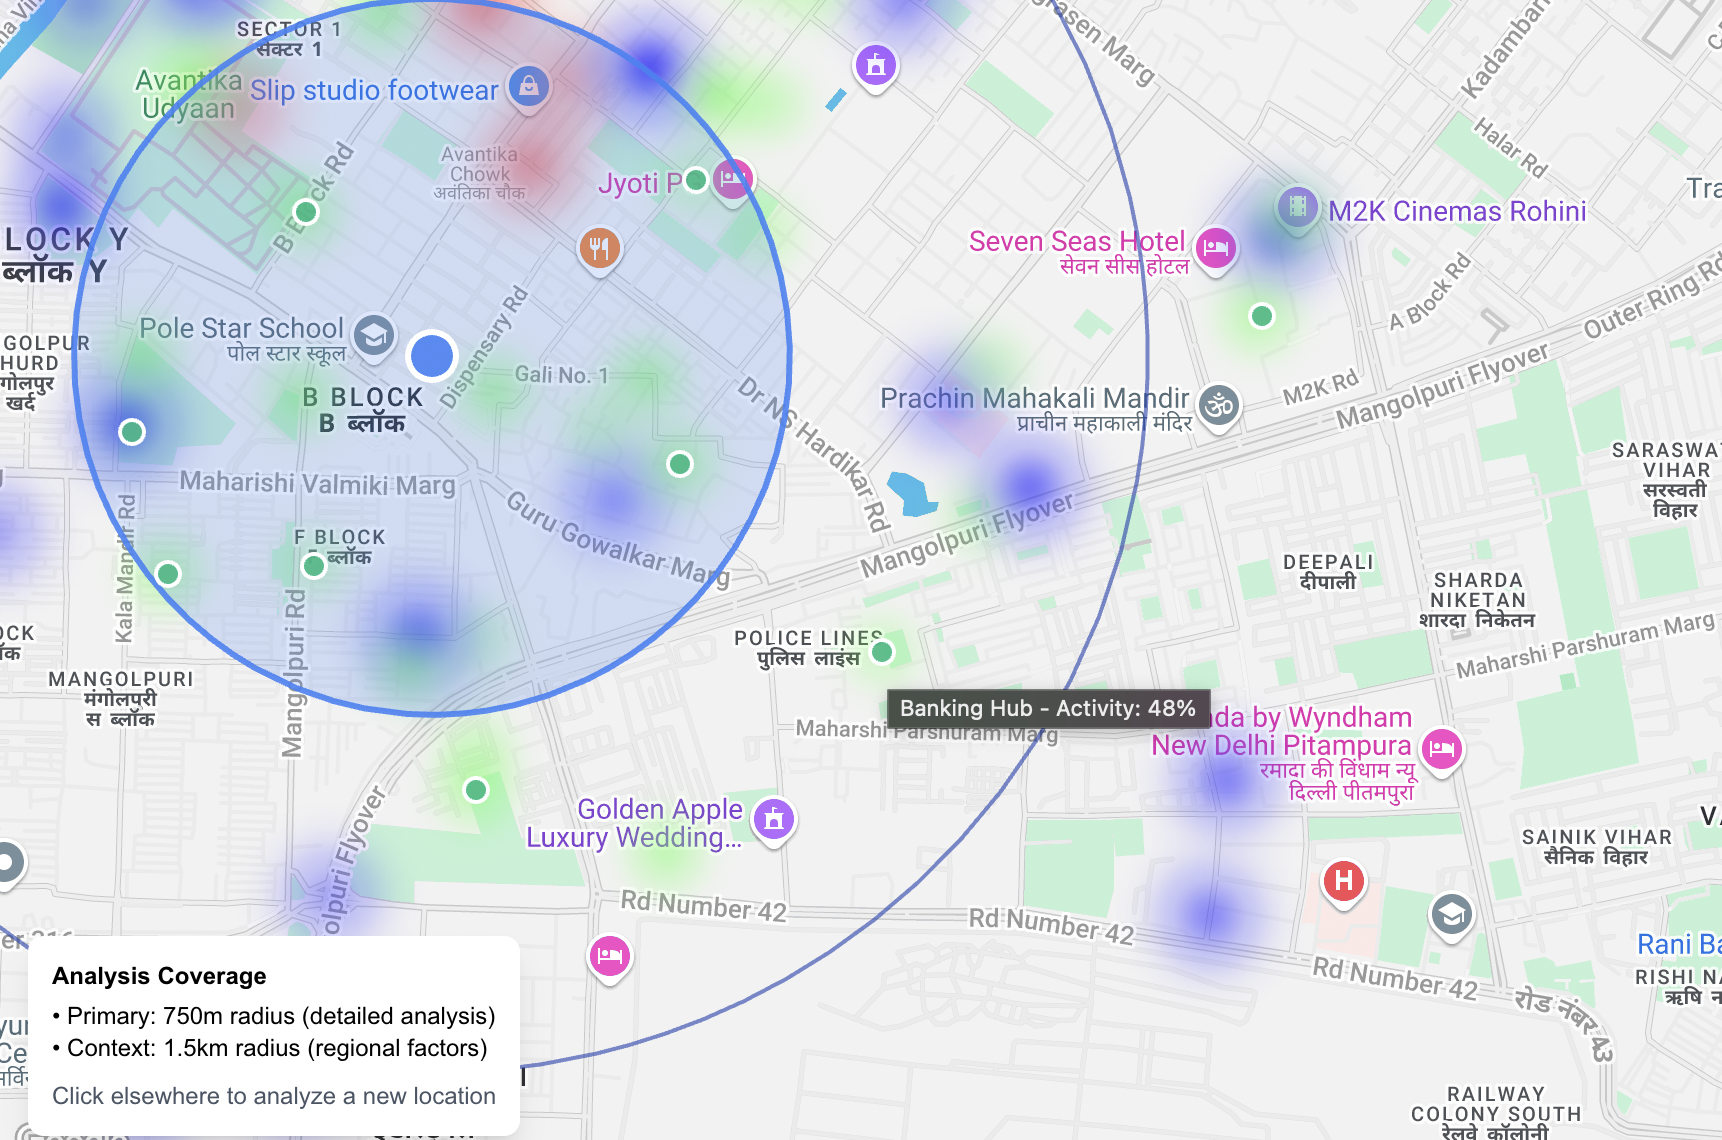
Marked a location for analysis
-
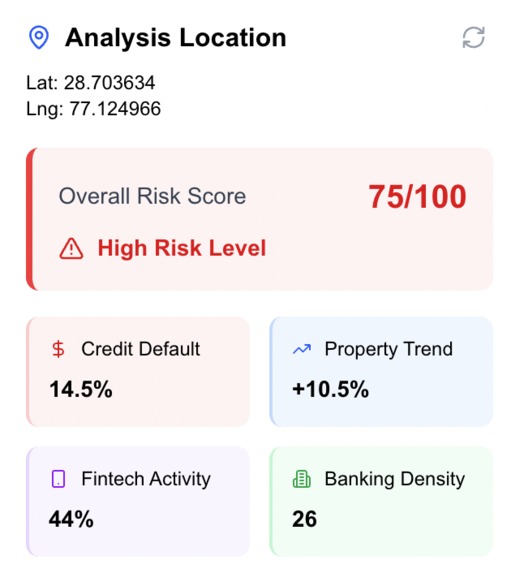
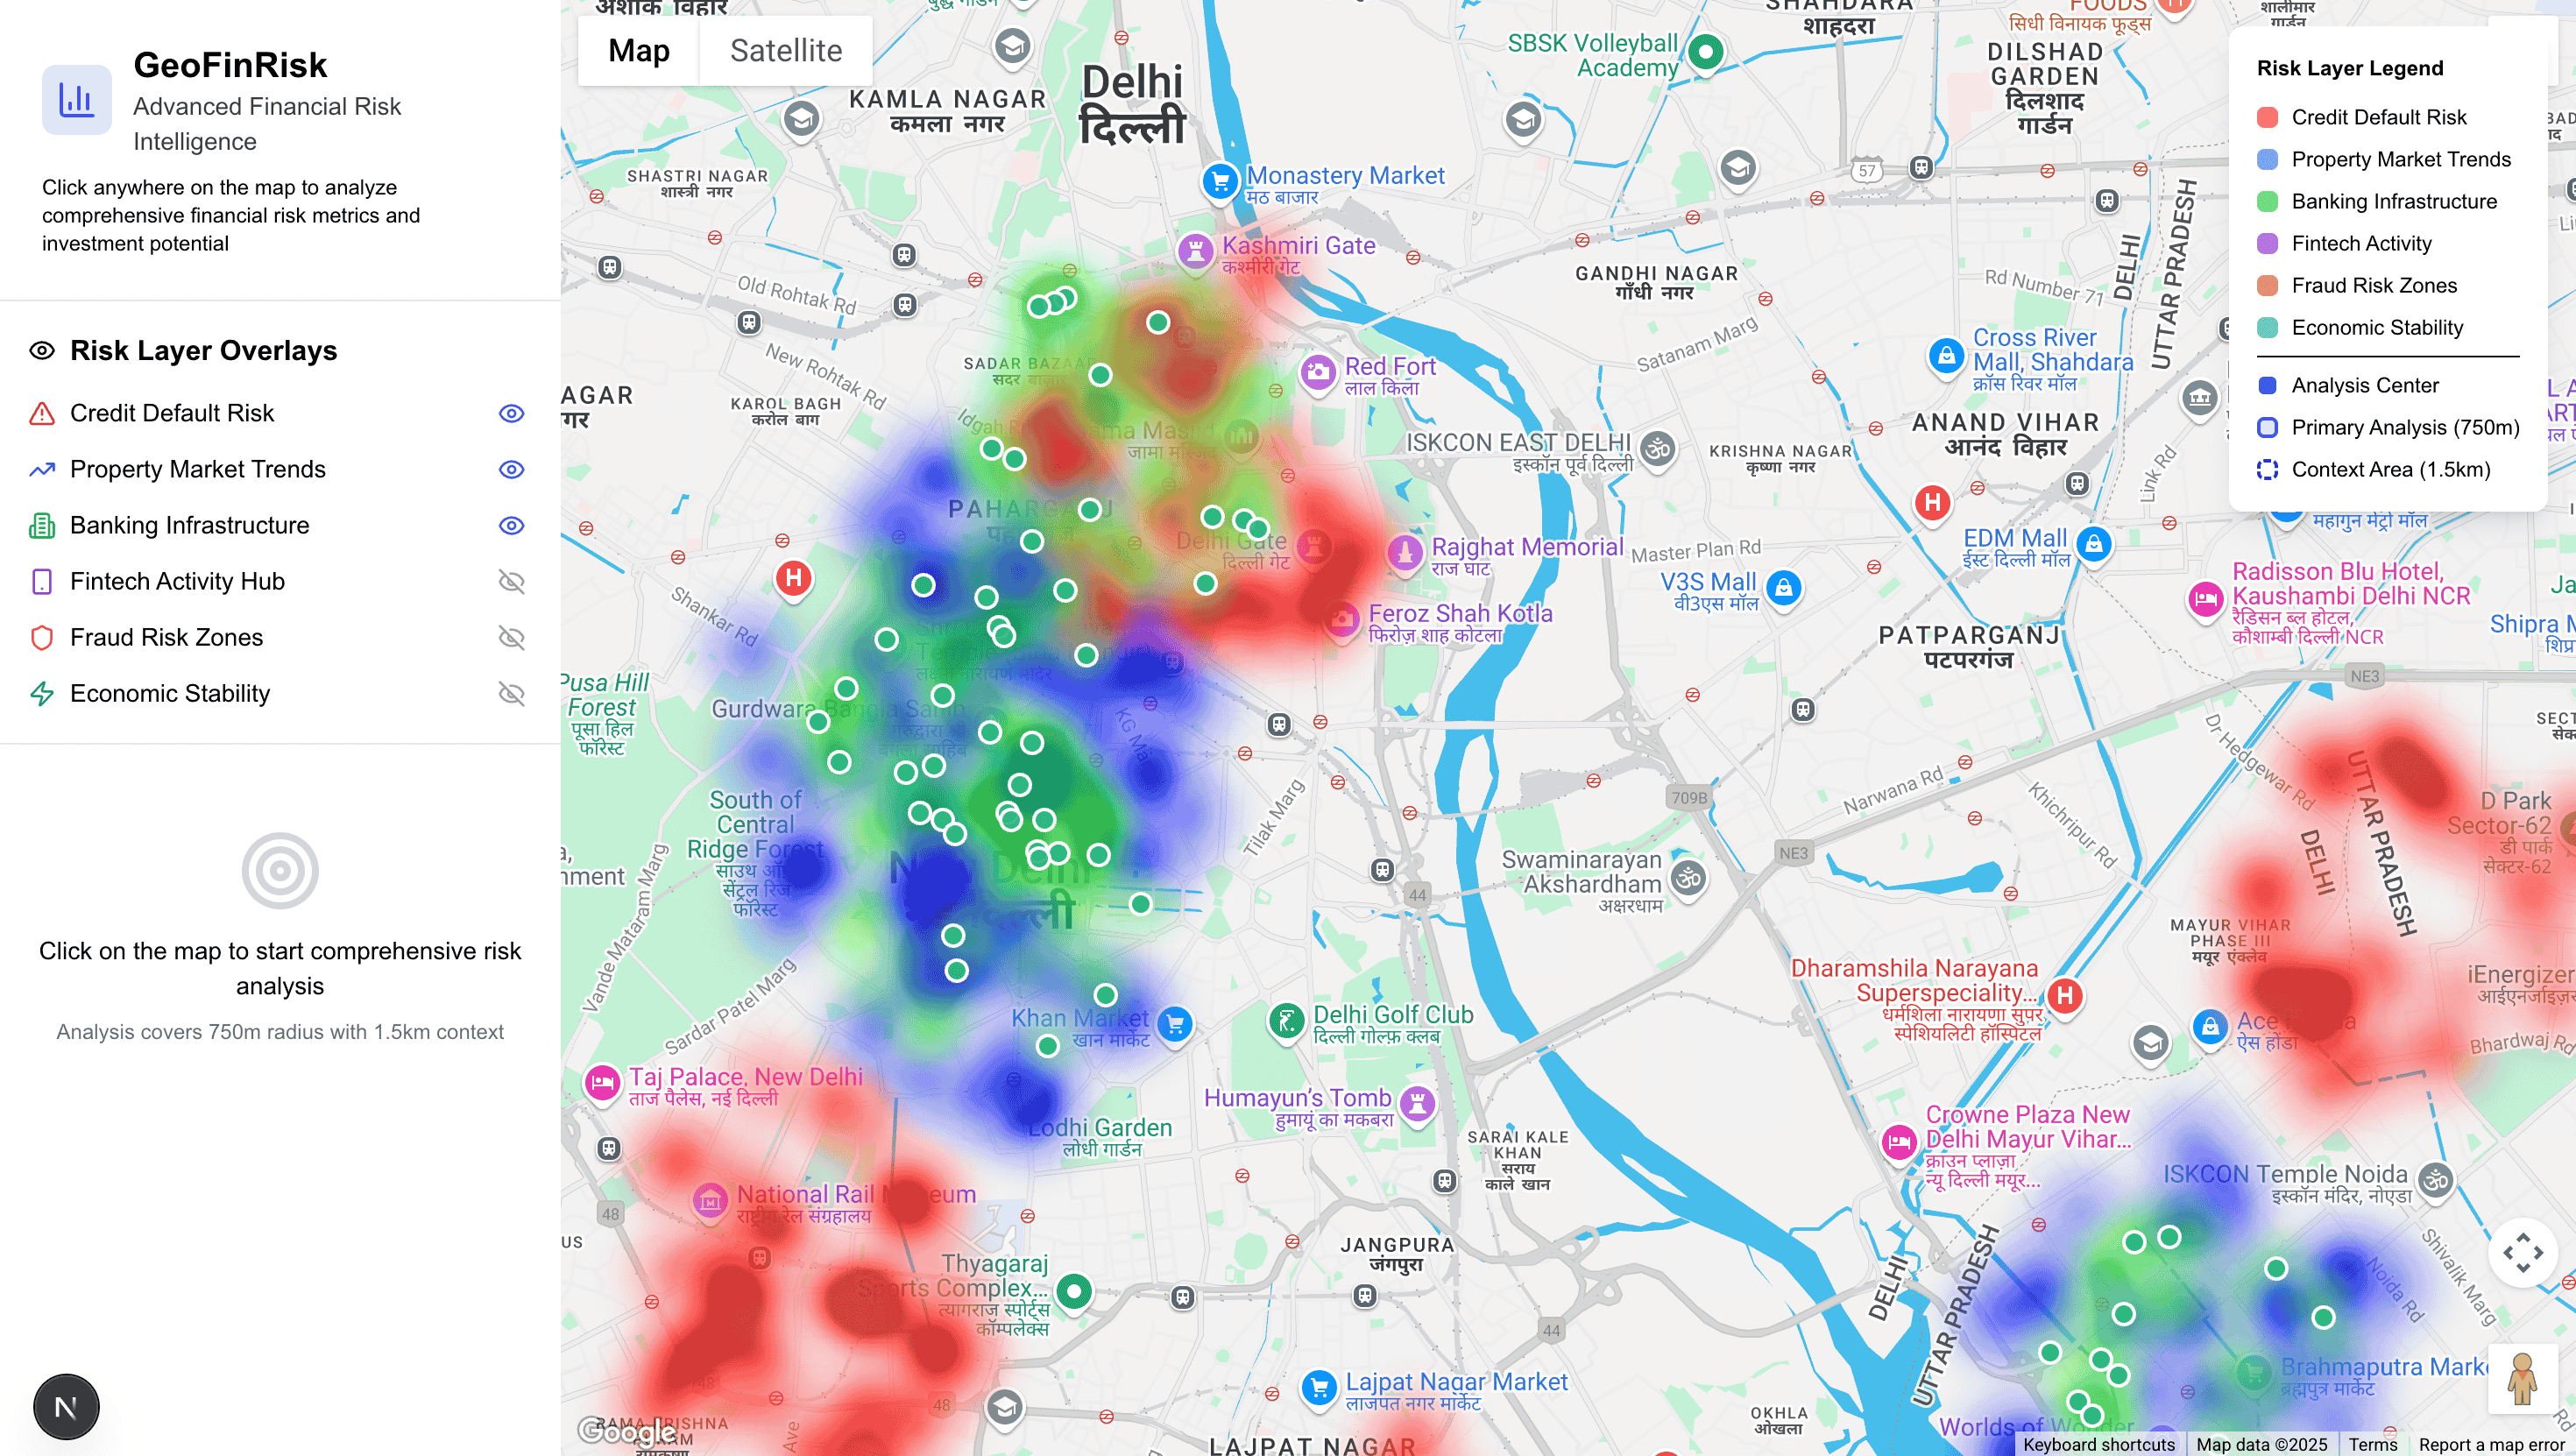
Analysis of a selected location
-
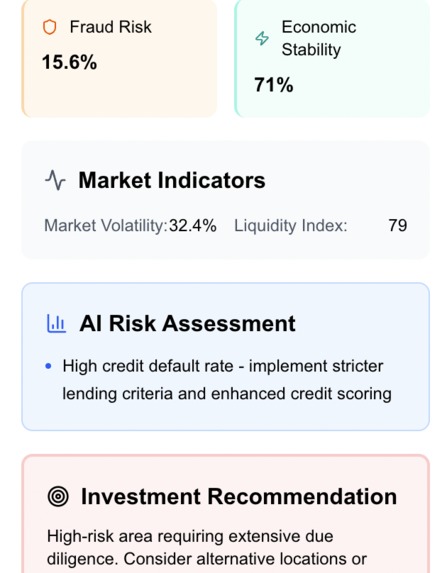
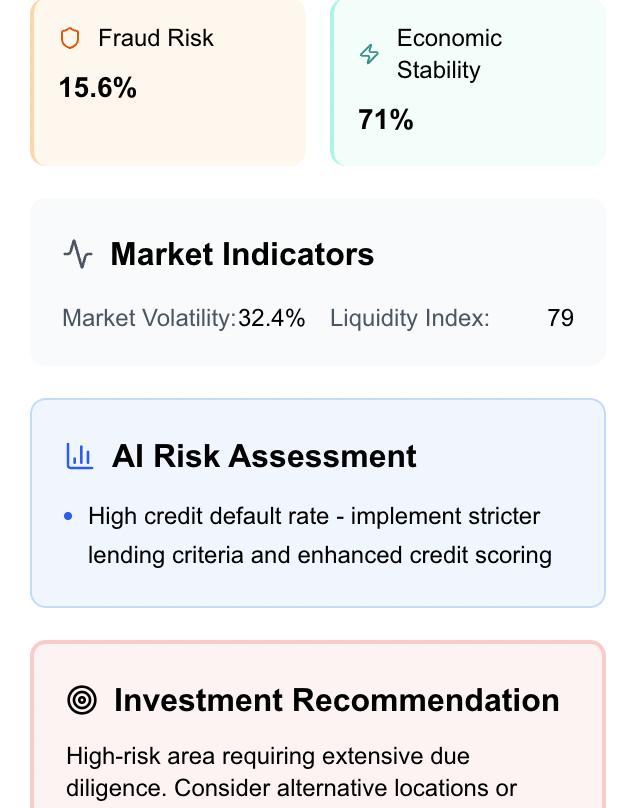
Analysis of a selected location pt2
-
The Heatmap metrics

Inspiration
I was always curious about how geography impacts finance. Cities are shaped by credit risk, fintech hubs, fraud clusters, and local economic health, but there’s no tool that visualizes it all in one place. So I decided to build something that actually makes sense a map that gives real-time financial risk insights just by dropping a pin. Simple idea, high-impact execution.
What it does
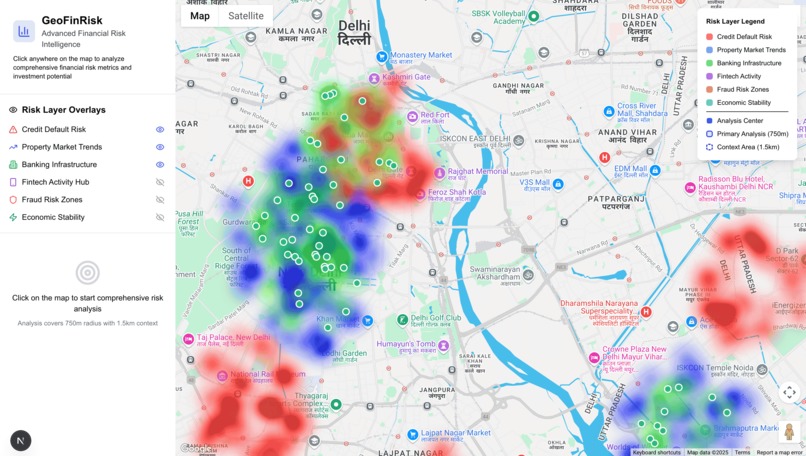
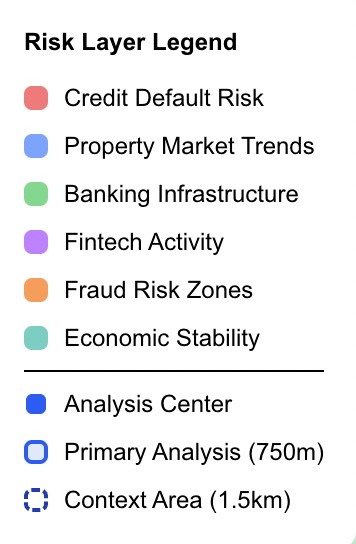
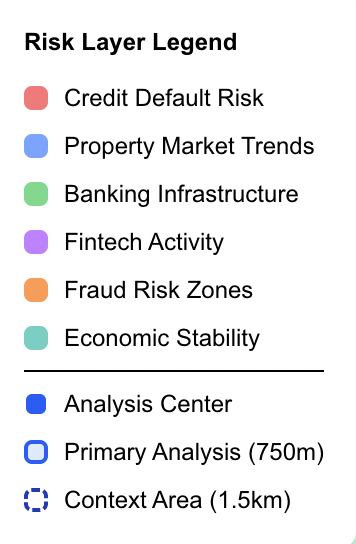
GeoFinRisk is a dynamic geospatial tool that lets you drop a pin anywhere on the map and instantly get a complete financial risk breakdown of that area. We’ve layered six financial risk heatmaps:
- Credit Default Risk
- Property Market Trends
- Banking Infrastructure
- Fintech Activity Hubs
- Fraud Risk Zones
- Economic Stability
The beautiful part? When you place a marker, it pulls a clean dashboard of all major metrics like:
- Overall Risk Score
- Credit Default %
- Property Trends
- Fintech Activity %
- Banking Density
- Fraud Risk %
- Economic Stability %
- Market Volatility and Liquidity
- AI-generated Risk Analysis
- Investment Recommendation
Basically, you get a full risk assessment with a single click.
How we built it
Frontend: React + Google Maps JavaScript SDK Maps & Visuals: Google Maps heatmap layers for each metric, fully custom styled Synthetic Data: Simulated geo-tagged financial datasets across Delhi region Core Logic: Dynamic marker drop → area scanned → risk metrics calculated → overlay shown with result card Styling: Tailwind CSS with smooth map container UI and risk legend sidebar
Note
We used synthetic static data for demo purposes but built it in a way that can be fully API-connected to live financial databases or satellite feeds later.
Challenges we ran into
- Mapping financial metrics spatially in a way that feels intuitive was tricky Google Maps SDK wasn’t built for custom financial overlays, so we had to hack our way through layering - - dynamic heatmaps without breaking UX
- Designing clean UI to present multi-dimensional data without clutter
Accomplishments that we're proud of
- The map looks sleek, the data feels powerful, and the entire experience is snappy.
- Successfully visualized risk in a way that’s actionable, not just pretty
- The marker drop → analysis → recommendation flow is tight and frictionless
- Got the entire working demo running with no backend, using only synthetic static data
What we learned
- Geo-financial data is a goldmine when visualized correctly
- Google Maps is still one of the most powerful dev tools when used creatively
- Minimalism and clarity in UI goes a long way when you're showing dense metrics
What's next for GeoFinRisk
- Add real-time financial datasets using APIs
- Expand to cover India-wide pin drops and global financial overlays
- Partner with fintechs, REITs, or NBFCs to embed this tool into their dashboards
- Add user-uploaded data, alerts, and historical risk tracking
Built With
- google-maps
- javascript
- next
- tailwindcss
- vercel

Log in or sign up for Devpost to join the conversation.