Inspiration
Inspired by a passion for data analytics, data visualization, and web development, I wanted to create a project that combined them into something meaningful.
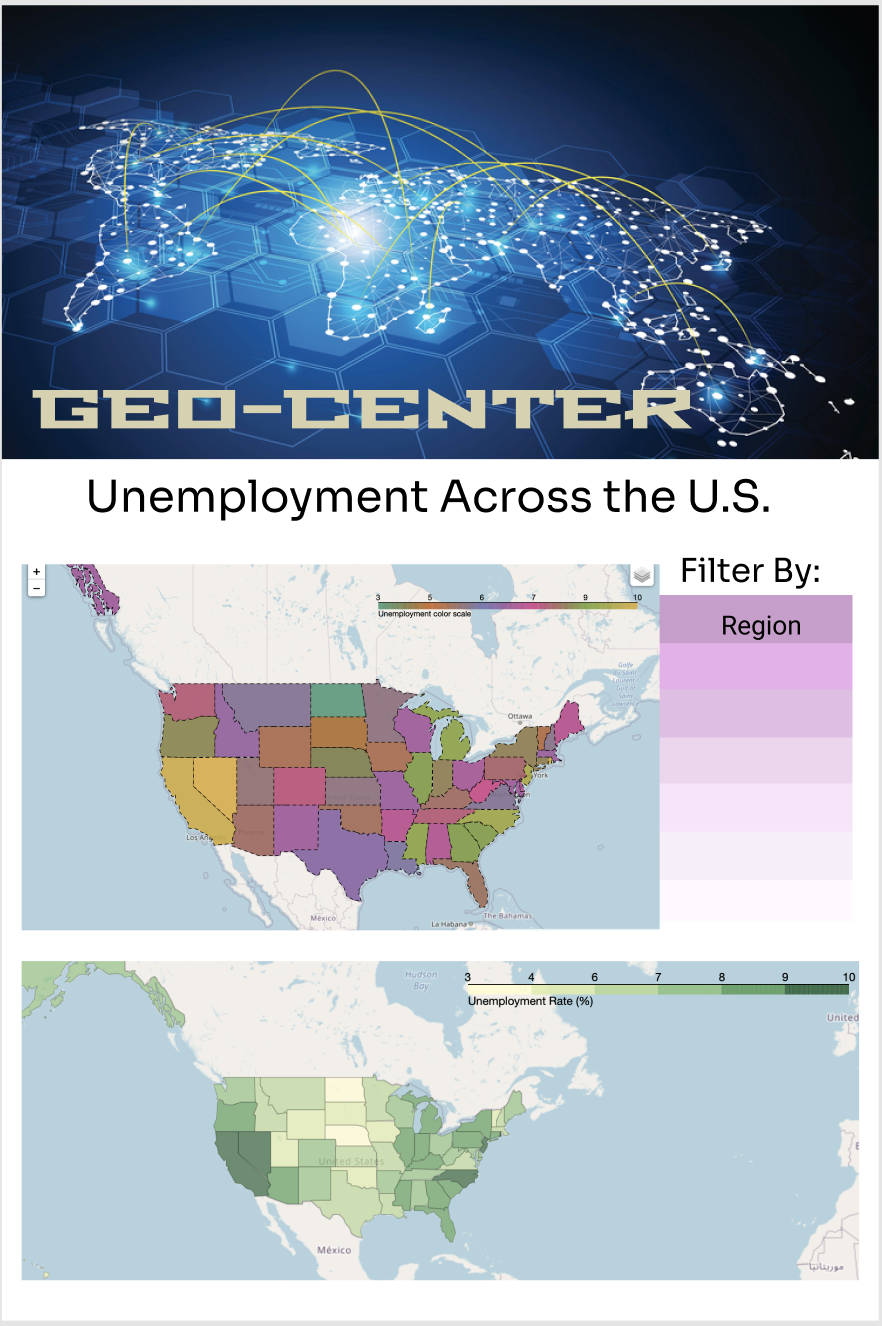
What it does
Users can view trends in the the relationship between geographical and socioeconomic data across different locations using our site. Currently, there is just a prototype of the site made using Figma, as more time was spent on design.
How we built it
Python, Figma, HTML, CSS
Challenges we ran into
Learning to work with different Python packages and getting familiar with how to use different tools and technologies
Accomplishments that we're proud of
Combining my interests in different field into a fun project
What we learned
How to incorporate interdisciplinary fields of tech

Log in or sign up for Devpost to join the conversation.