Inspiration
We chose this challenge because we’ve never worked with open data before, and we were excited to try it out. We got interested in electric vehicles (EVs) because more and more people are using them these days. This made us curious about their impact on the environment, especially on air quality and pollution.
What it does
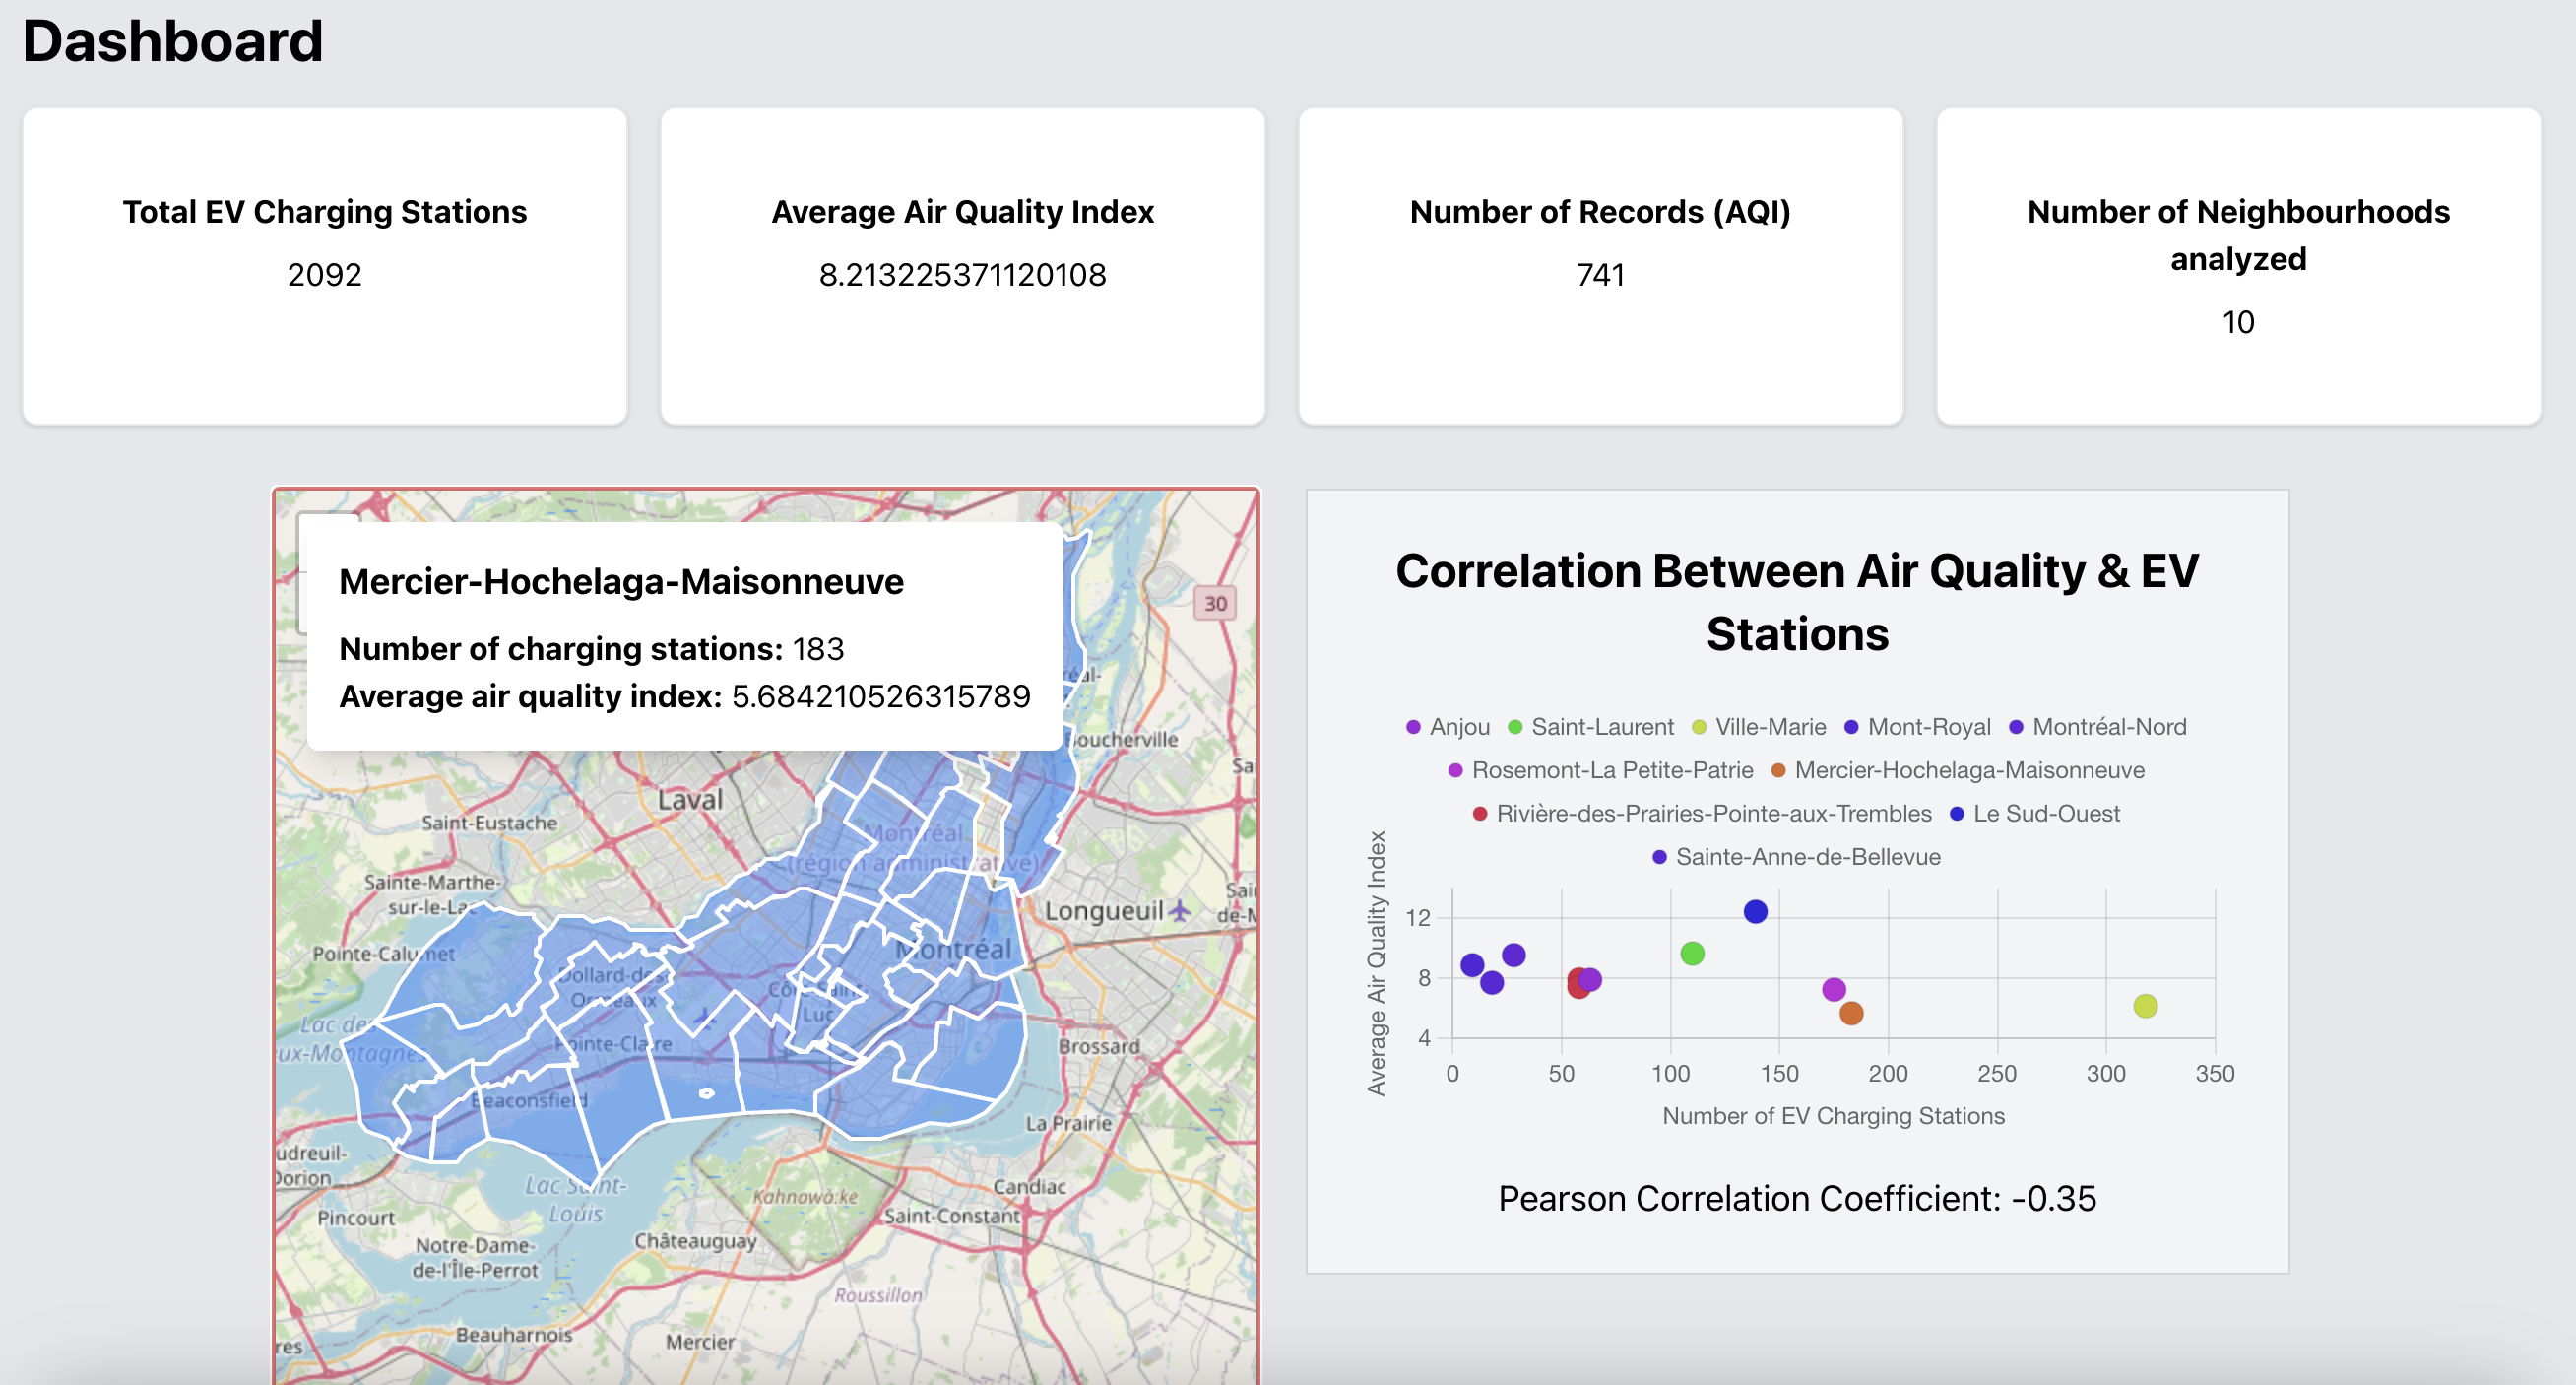
By combining real-time air quality data with information about EV charging stations, we want to see if there’s a connection between them and if EVs can help reduce pollution in cities. This project gives us the chance to explore open data while also tackling an important environmental issue.
How we built it
We started to break down the main problem and identify the specific topic that we wanted to focus on. After deciding which topic, we first retrieved data dynamically with real time updates from csv files on Données.montreal.ca then we proceeded to filter, analyze and manipulate them. For our back-end server, we used Flask framework with Python (along with Python libraries such as pandas, numpy, mathplot, geopandas) and for our front-end, we used Next.js and Tailwind Css for our website. We linked both sides using various API endpoints
Challenges we ran into
One of the challenges we ran into was retrieving the data from the database dynamically with real time update as well as linking our back-end data with our front-end. Debugging was also an important challenge especially when our code becomes too big and that is written by different teammates.
Accomplishments that we're proud of
One of the accomplishments that we're proud of is to be able to link dynamically our back-end server and front-end using API endpoints. Another accomplishment is to be able to analyze thoroughly multiple csv files (5 in total) containing 200 to 700 records and manipulate them efficiently.
What we learned
We learned how to structure the project efficiently in a group of 4, by starting to understand well the problem statement and then break down into small parts. This facilitates the work division later on. We also learned new Python libraries and how they could extract data easily and efficiently.
What's next for GeoAir
We plan to incorporate a 3D interactive map in this project as our next goal where users could navigate through this map in an immersive way while being able to see analyzed data per region. We also inspire to implement more environmental data in order to be able to draw more accurate conclusions.
Built With
- chatgpt
- donnees.montreal.ca
- flask
- javascript
- nextjs
- python
- tailwind


Log in or sign up for Devpost to join the conversation.