-

Brainstorming process
-

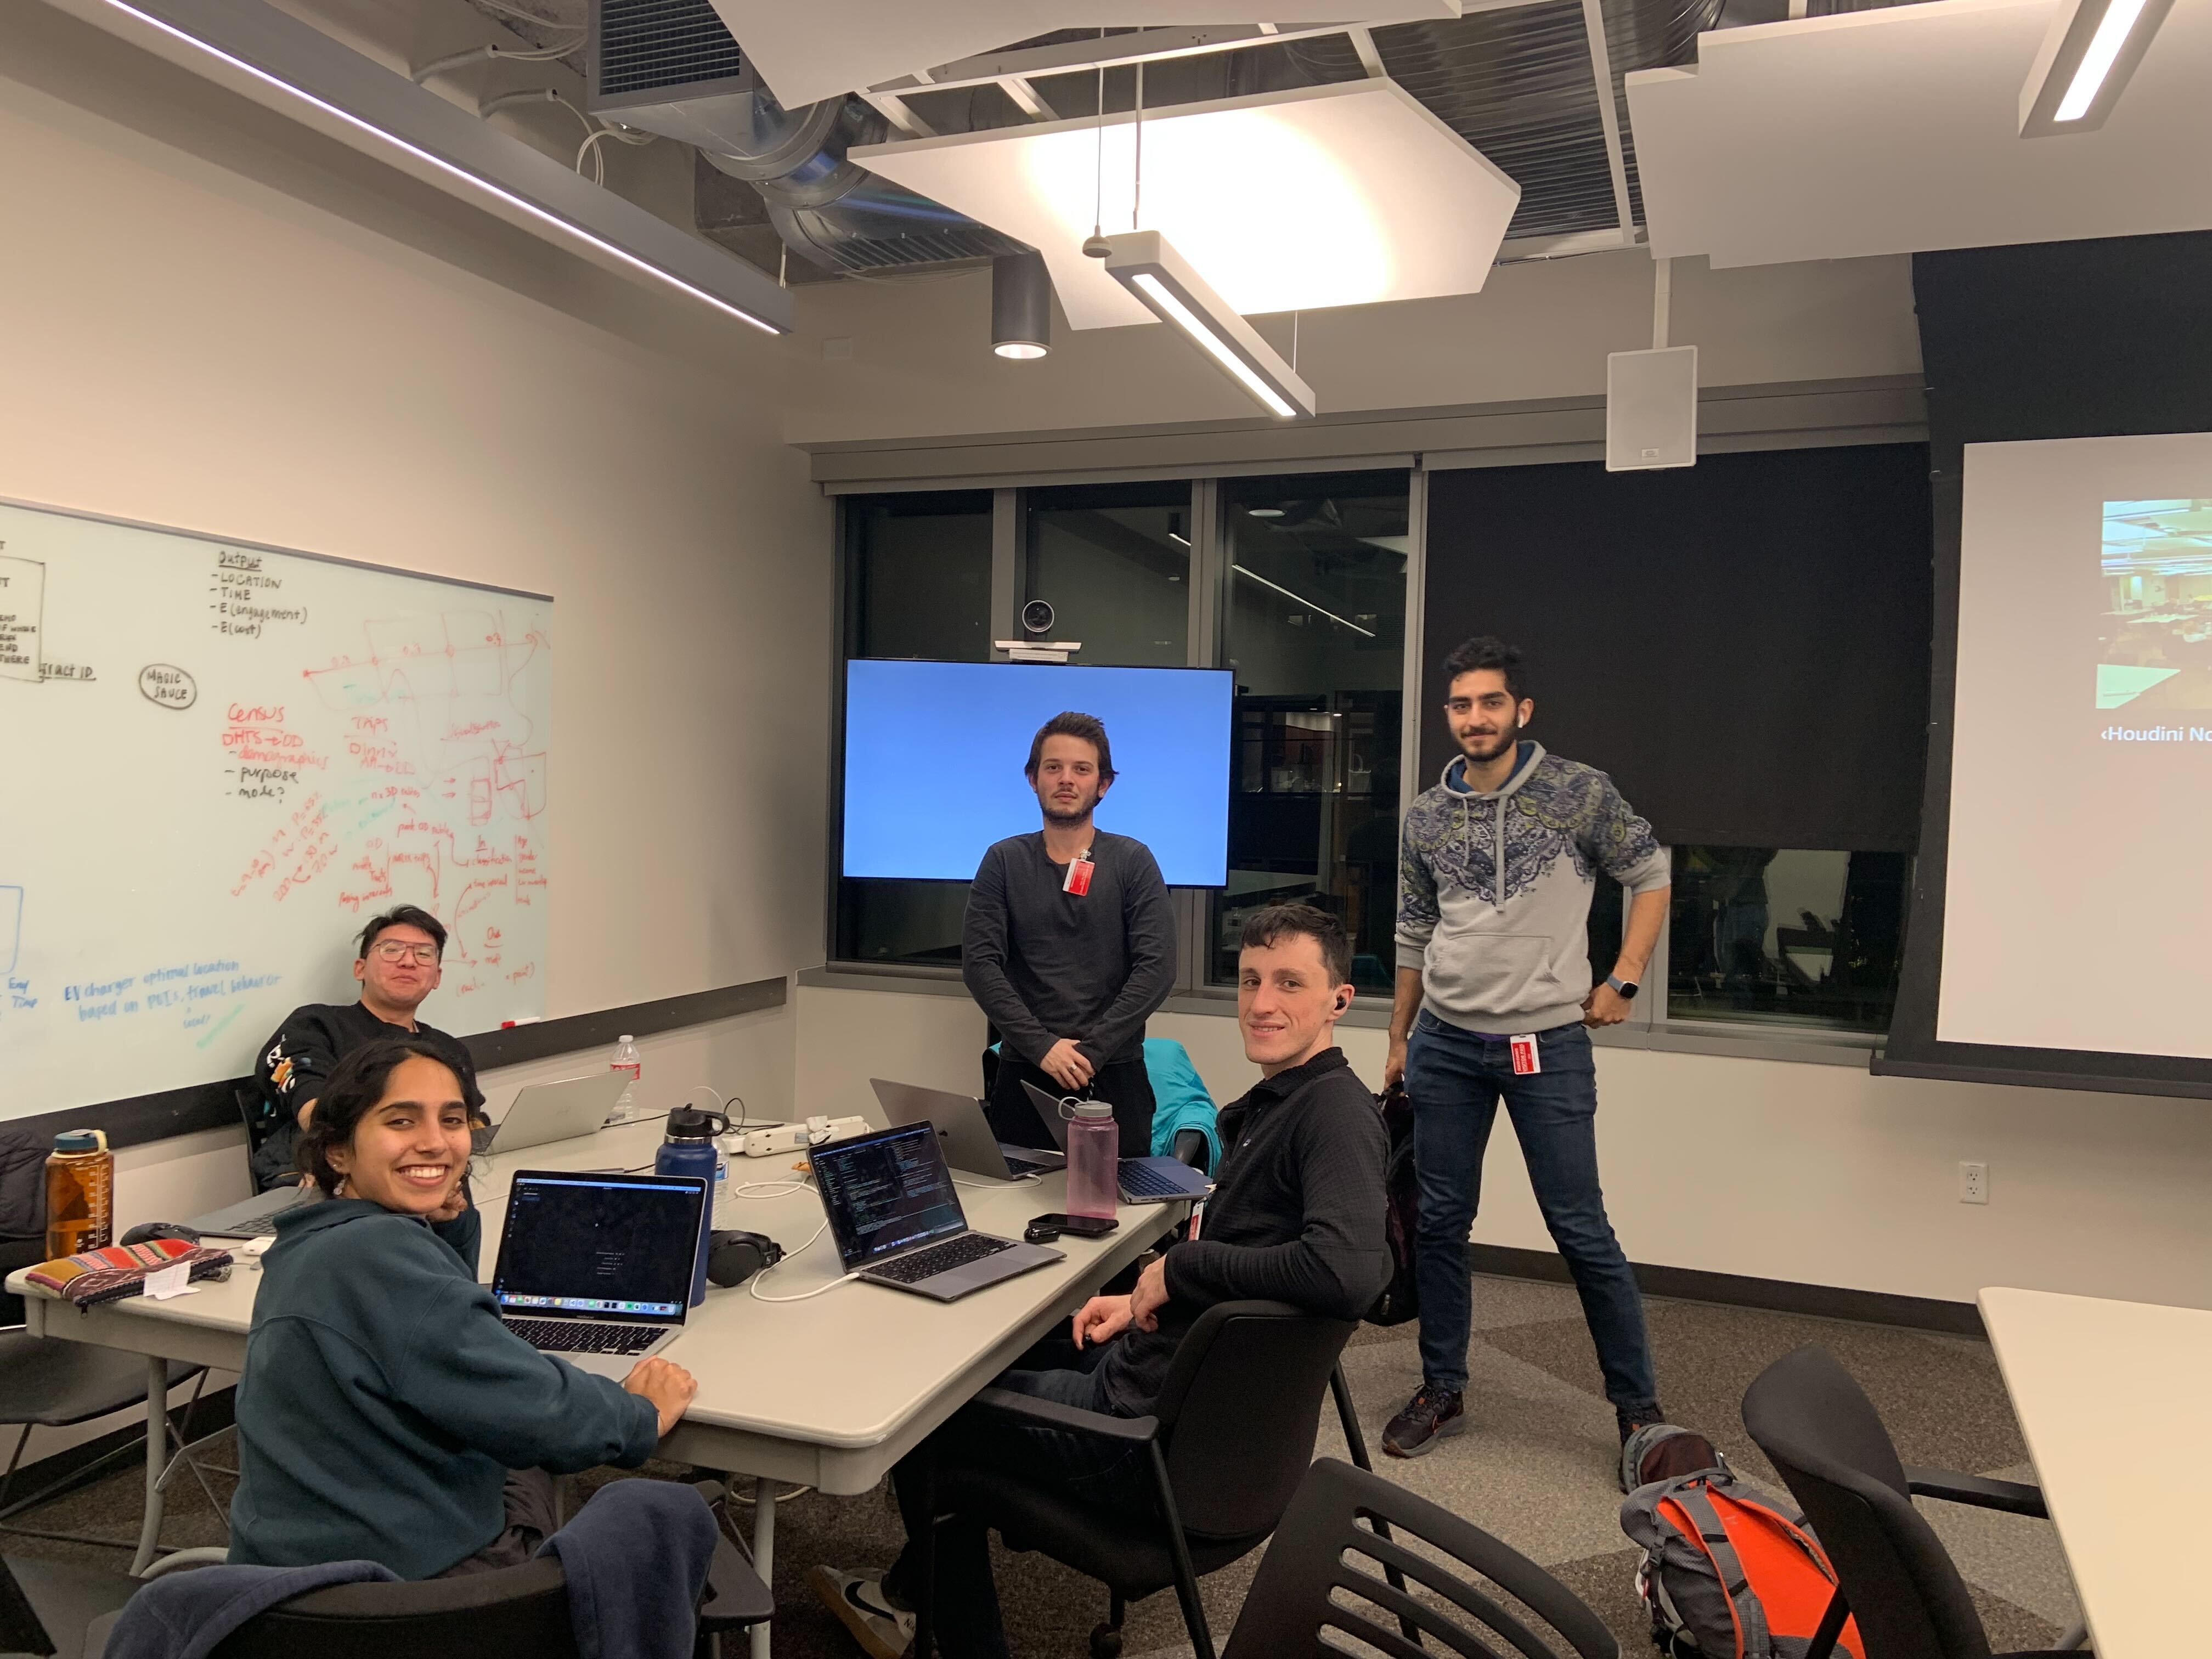
The team!
-

Hard at work...
-
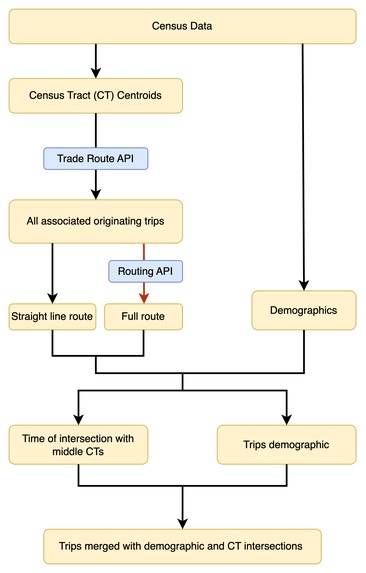
Workflow
-
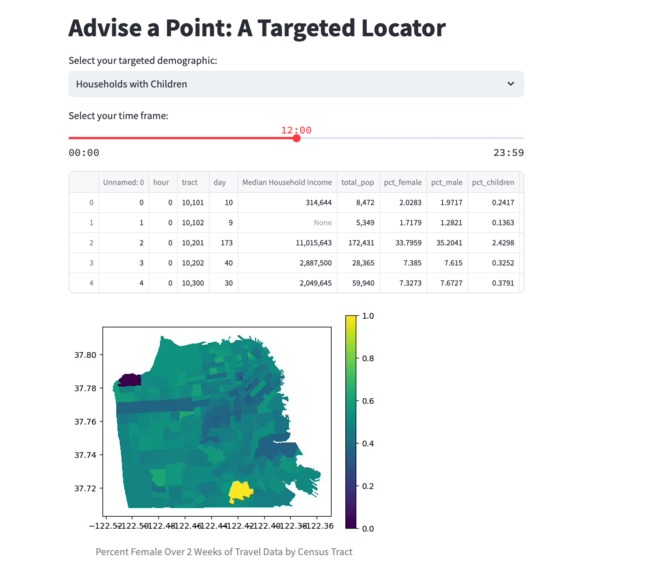
Sample dashboard
-
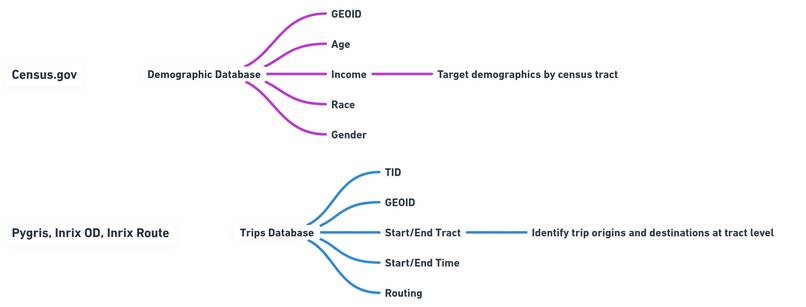
Methods


Motivation
INRIX has access to a unique set of trip origin-destination (OD) data that can be applied by their clients to understand where and why people travel. However, we notice the INRIX data lacks a sociodemographic dimension associated with trips– in other words, who are the people that are traveling? Demographic data provides an additional layer of information regarding travel-related behaviors of the trip makers. Understanding the human behavior of travel allows for many more insights to be derived from INRIX data. Our hack provides two approaches to using demographically-enriched OD datasets.
The first approach asks: given a time of day and target demographic group, where is the target group located? This approach may be particularly useful for location-based advertising. From a company’s perspective, they may want to target a certain market segment (i.e, a smoothie company may want to target health-conscious young adults whereas a fast food chain may target individuals with children). From enriched INRIX data, the company can see where their demographic is traveling, at what time of day, and obtain spatial clusters of high target demographic density.
The second approach asks: given a certain destination on a map, what demographics tend to travel to that point, and who are the people traveling there? This approach may be more useful in understanding usage patterns of existing infrastructure such as electric vehicle (EV) chargers. Knowledge of the users of EV chargers is of interest to network charging providers, and can provide additional insight into the type of EV chargers to place and if charger placement equitably serves the surrounding communities.
These two approaches with enriched INRIX data provide a greater depth of nuance in understanding behavior associated with OD flows.
How we built it
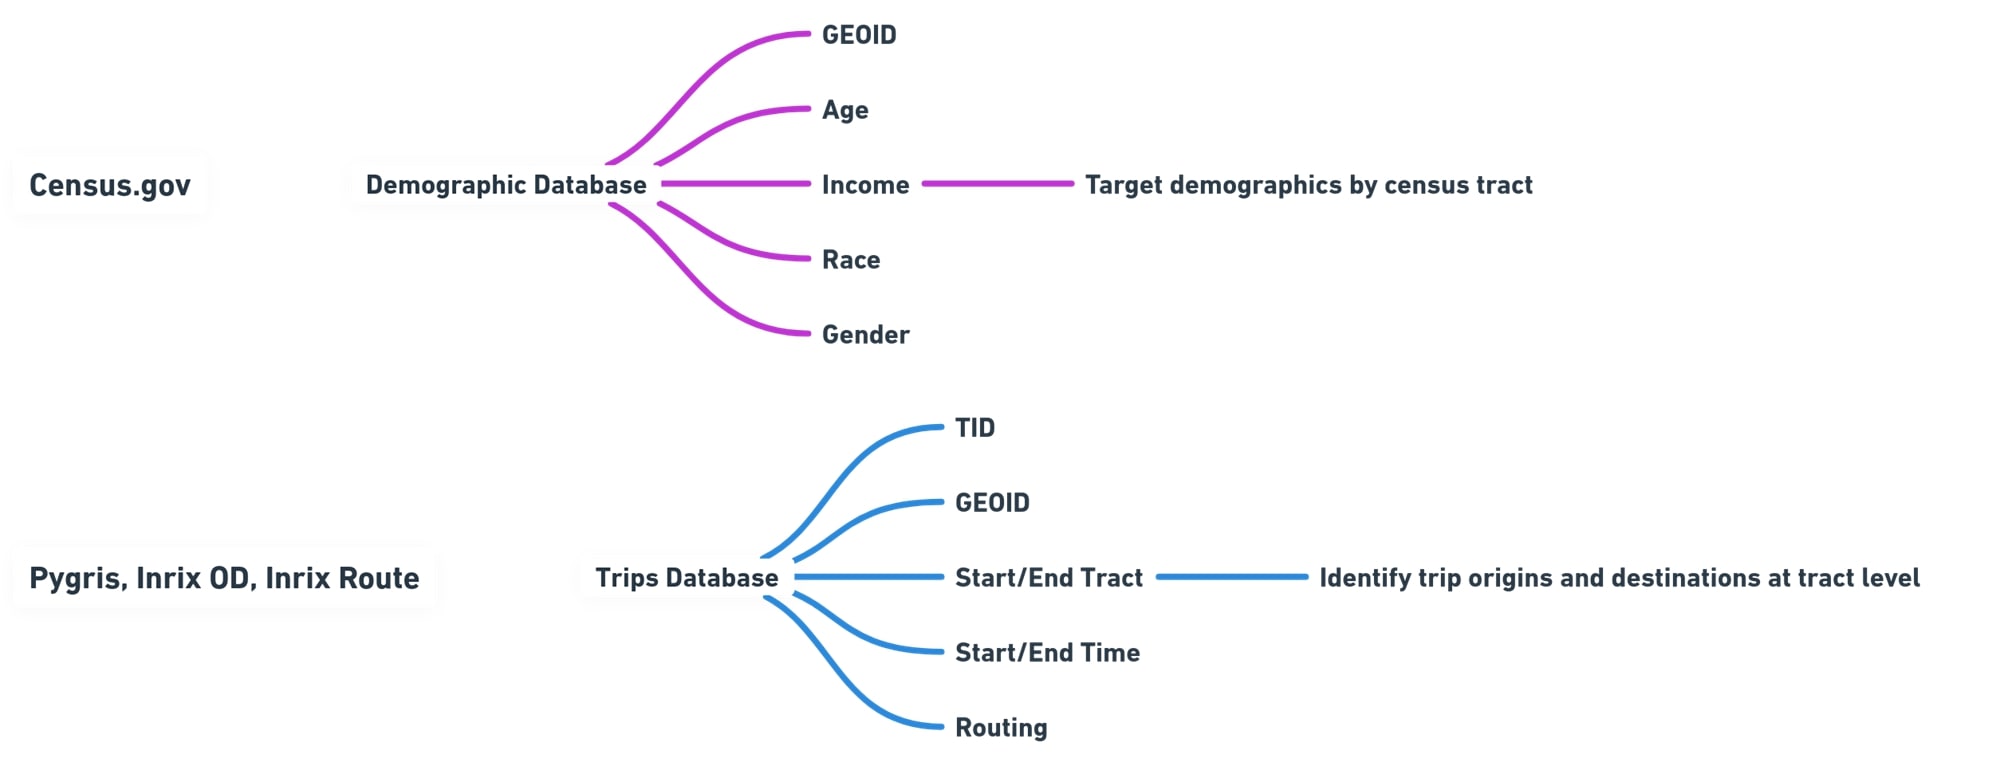
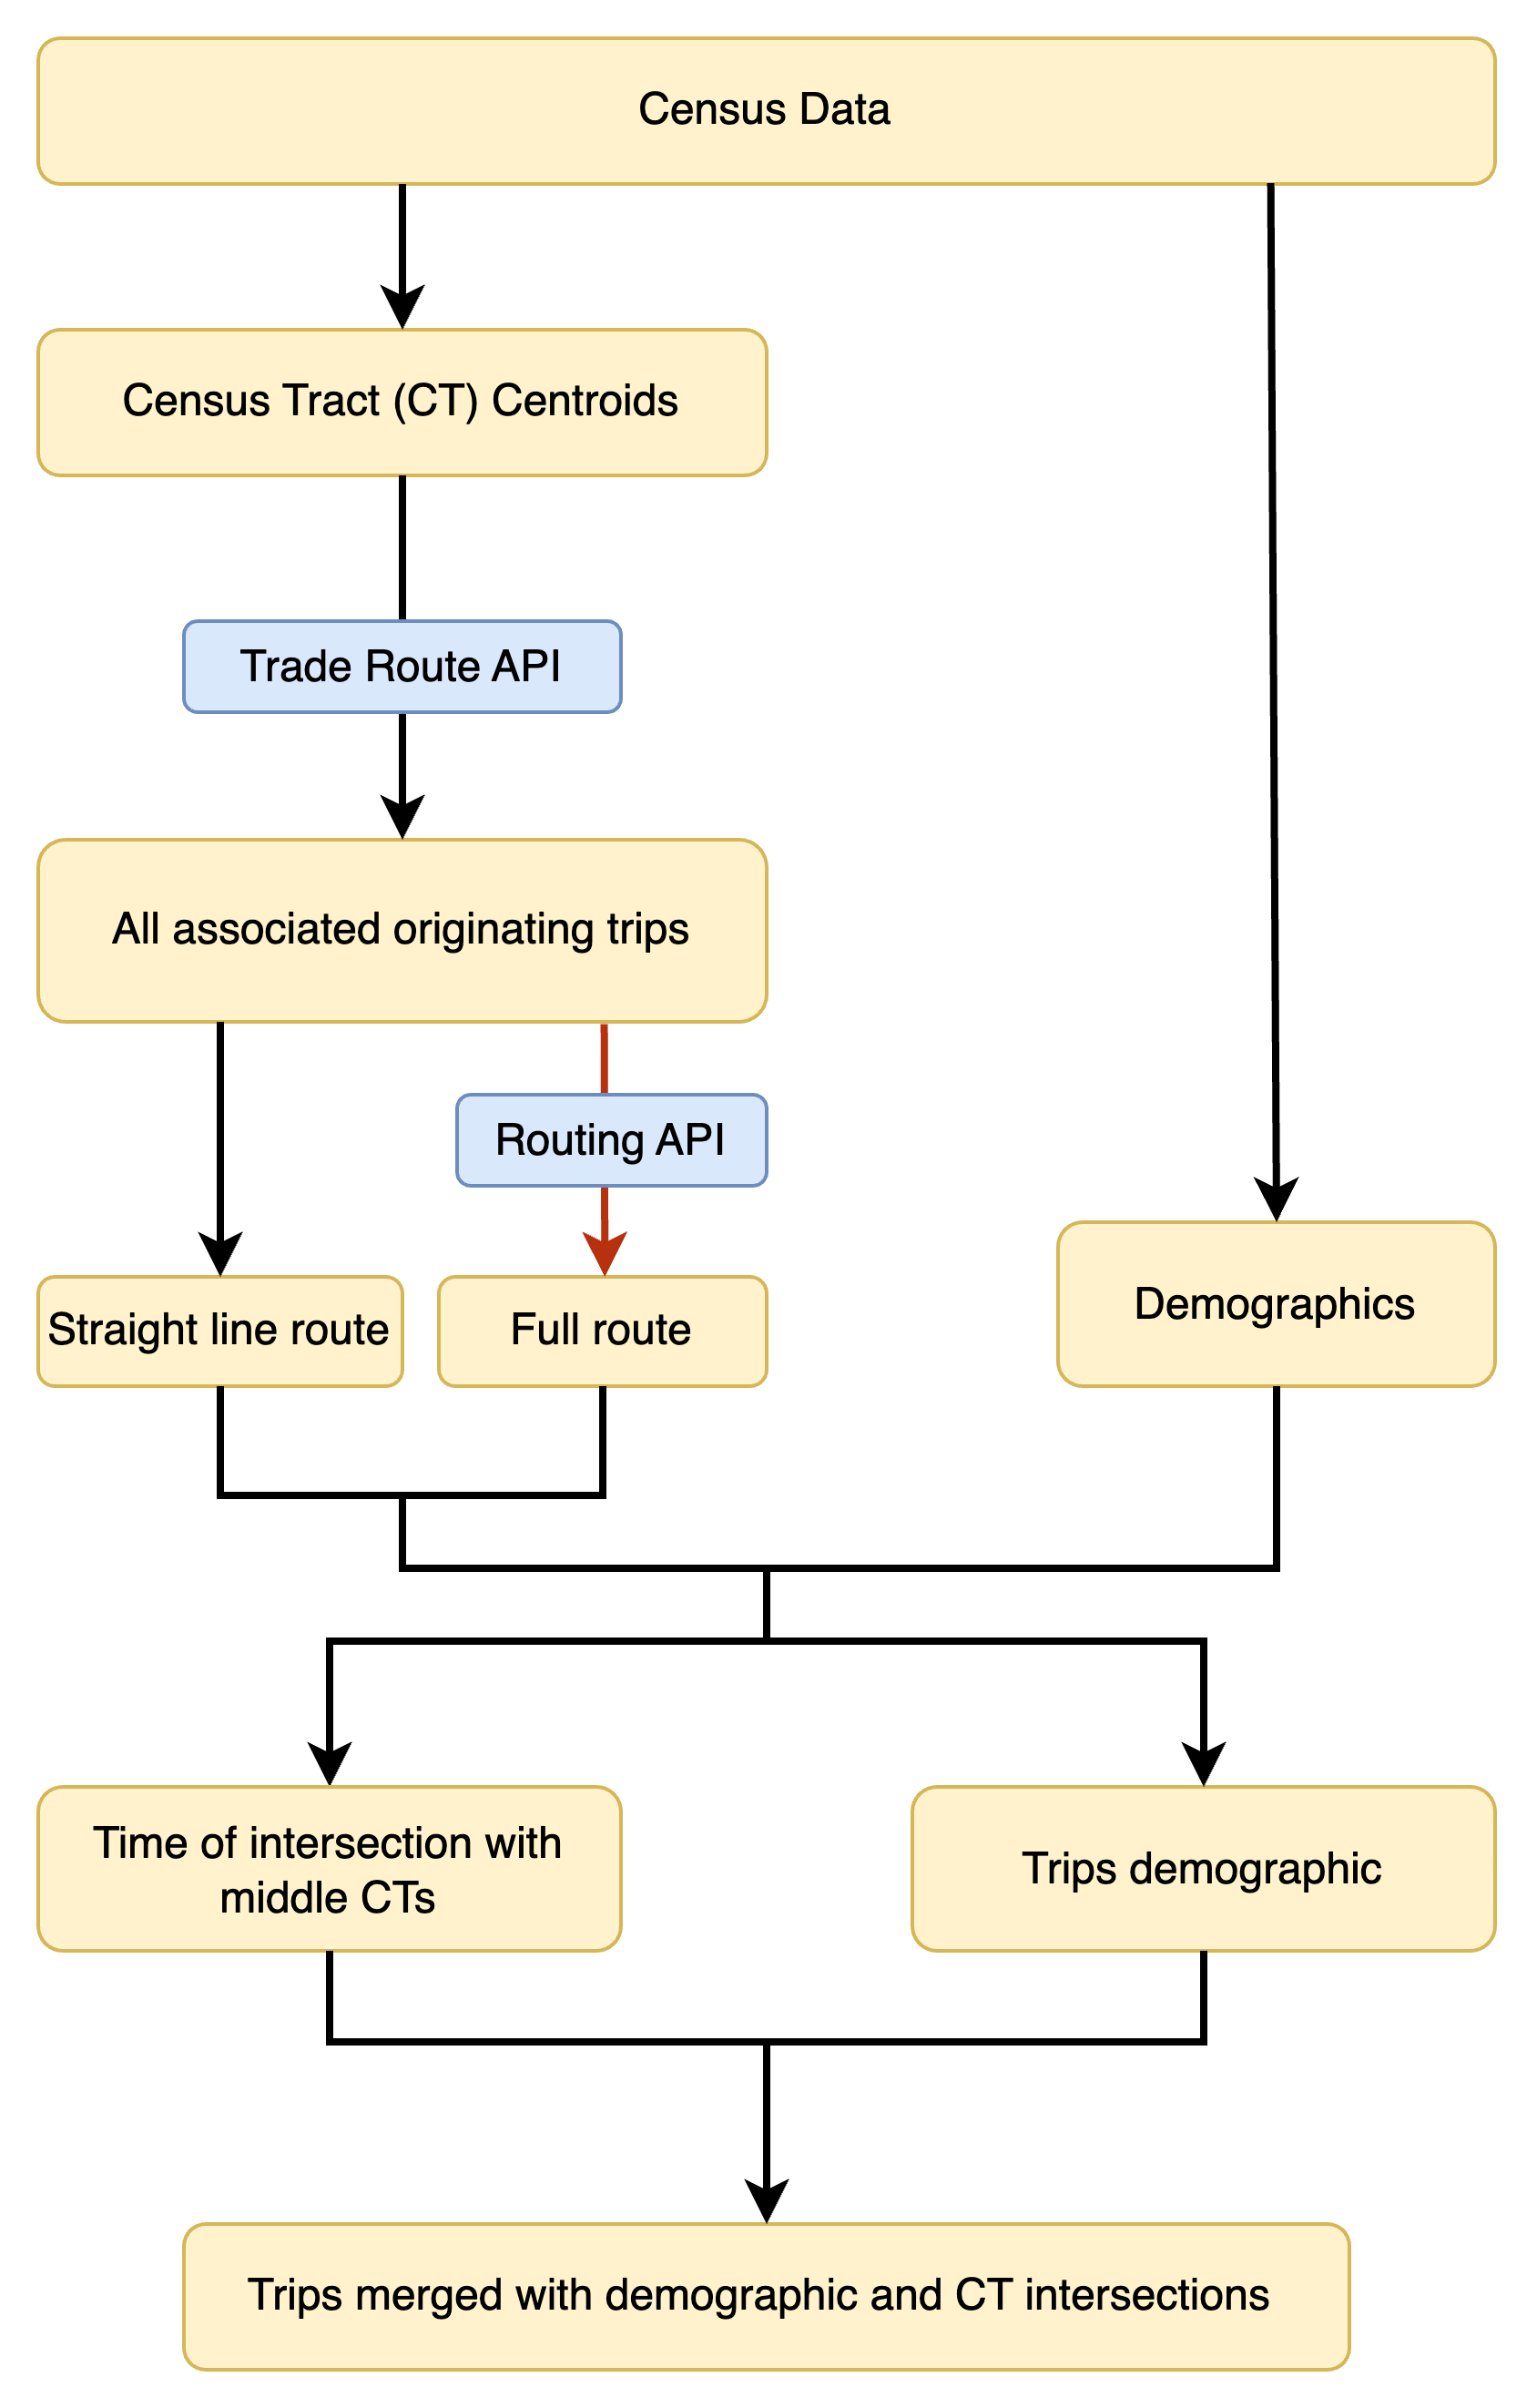
The first step in data enrichment involved pulling OD data via INRIX APIs. The INRIX Trade Area Trips API was used to gather OD flows for a given area or specific destination location. Collected data included time of day data, latitude/longitude of the trip origin and destination, and census tracts the trip passed through. The American Community Survey (ACS) API was used to gather demographic information about the origin census tract for each trip. Age, gender, income, and race were obtained from ACS. We assumed the demographic distributions of each census tract applied to the travelers who had trip origins in that census tract. Python and geopandas were used to map trip OD flows to specific census tracts at specific times. Trips were aggregated to understand the distribution of traveler traits during the query period.
To present the enriched datasets, we used a Streamlit framework to create a simple user interface for our analysis. The dashboard presents the two above mentioned use cases, both of which allow analysis of time of day, location, and demographics. The first use case allows users to slice by time of day and target demographics, and displays a map highlighting concentrated areas of the target demographics. The second use case allows users to select a specific location on a map, and provides information on where people traveled from and who the travelers are.
Challenges
We ran into several challenges during the hackathon. The first (and most challenging step) was creating a clear vision and organized workflow for the team. Our idea evolved over the course of the past day, and clear team communication was key to make sure we were all on the same page. We were all also new to version control/using git, so we had to learn how to merge branches and make sure work was distributed appropriately. Another challenge was aggregating temporal OD flow data to discrete spatial census tracts. We had to find a programmatic way to connect spatiotemporal changes and collect aggregate statistics. Additionally, the Streamlit dashboard was fairly slow in displaying the data from each query– we had to find a workaround to cache information to speed up the runtime of the visualizations.
Accomplishments
From the hackathon, we developed a dashboard that allows for potential customers to interact with aggregated and processed data. This output will be useful to present the different use cases of demographic-enriched OD data for INRIX. Additionally, our team did a lot of brainstorming and idea generation over the 24 hour period and found uses for the data outside the hack (like in our research applications!). We were also able to synthesize our knowledge among the team from different parts of the transportation system including travel behavior, sustainable transportation, transport networks, and urban planning.
What we learned
One big thing we learned was working with APIs. Our team hadn’t worked with INRIX APIs beforehand. Though it was a steep learning curve, we were able to leverage the data efficiently from INRIX. Several members of our team also had not worked with Streamlit before, so it was good practice in learning a new visualization tool. The hackathon was also good practice in project management, distributing work, and generating high-level visions for data. As transportation planners and engineers, we're typically focused on developing internal tools. This hack was good practice in making sure our code was readable and tools were useful for external stakeholders.
What's next for GeoAdvisor
There are a few assumptions we made during the data enrichment process. First, we assumed constant travel speeds along the ODs to calculate the time that trips passed through each census tract. In reality, time of trips is highly variable given roadway design and congestion, and can be further specified for more granular analysis. Another item for future work would be obtaining demographic OD flows. This data is often collected in travel survey data, where the census tract for each origin and destination is associated with the demographics of individuals making the trips and trip purposes. Currently, our work assumes that traveler demographics are reflective of the origin that they come from. However, these demographics should be linked to their home census tract; this O/D demographic information is not available in the San Francisco area (but is available in the Seattle area).
Built With
- american-community-survey
- python
- streamlit
- trade-area-trips


Log in or sign up for Devpost to join the conversation.