-
-
Statistics
-
Plotting
Inspiration
Working so cloesly together gave us the most inspiration if someone was stuck into a problem. The format of this Hackathon is perfectly fitted to tackle a specific problem in short time.
What it does
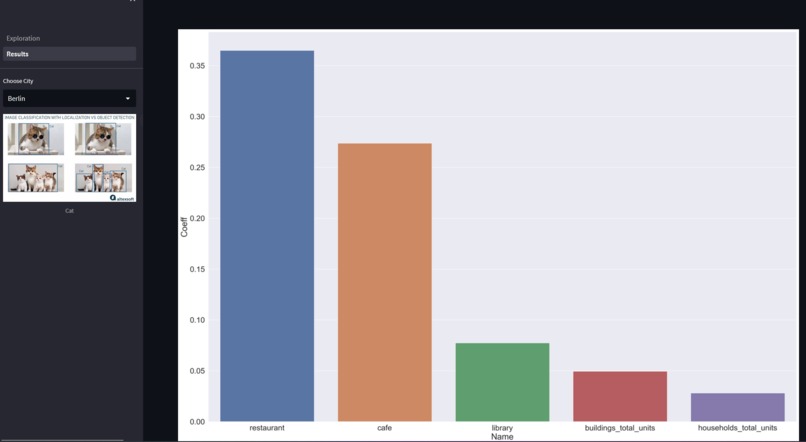
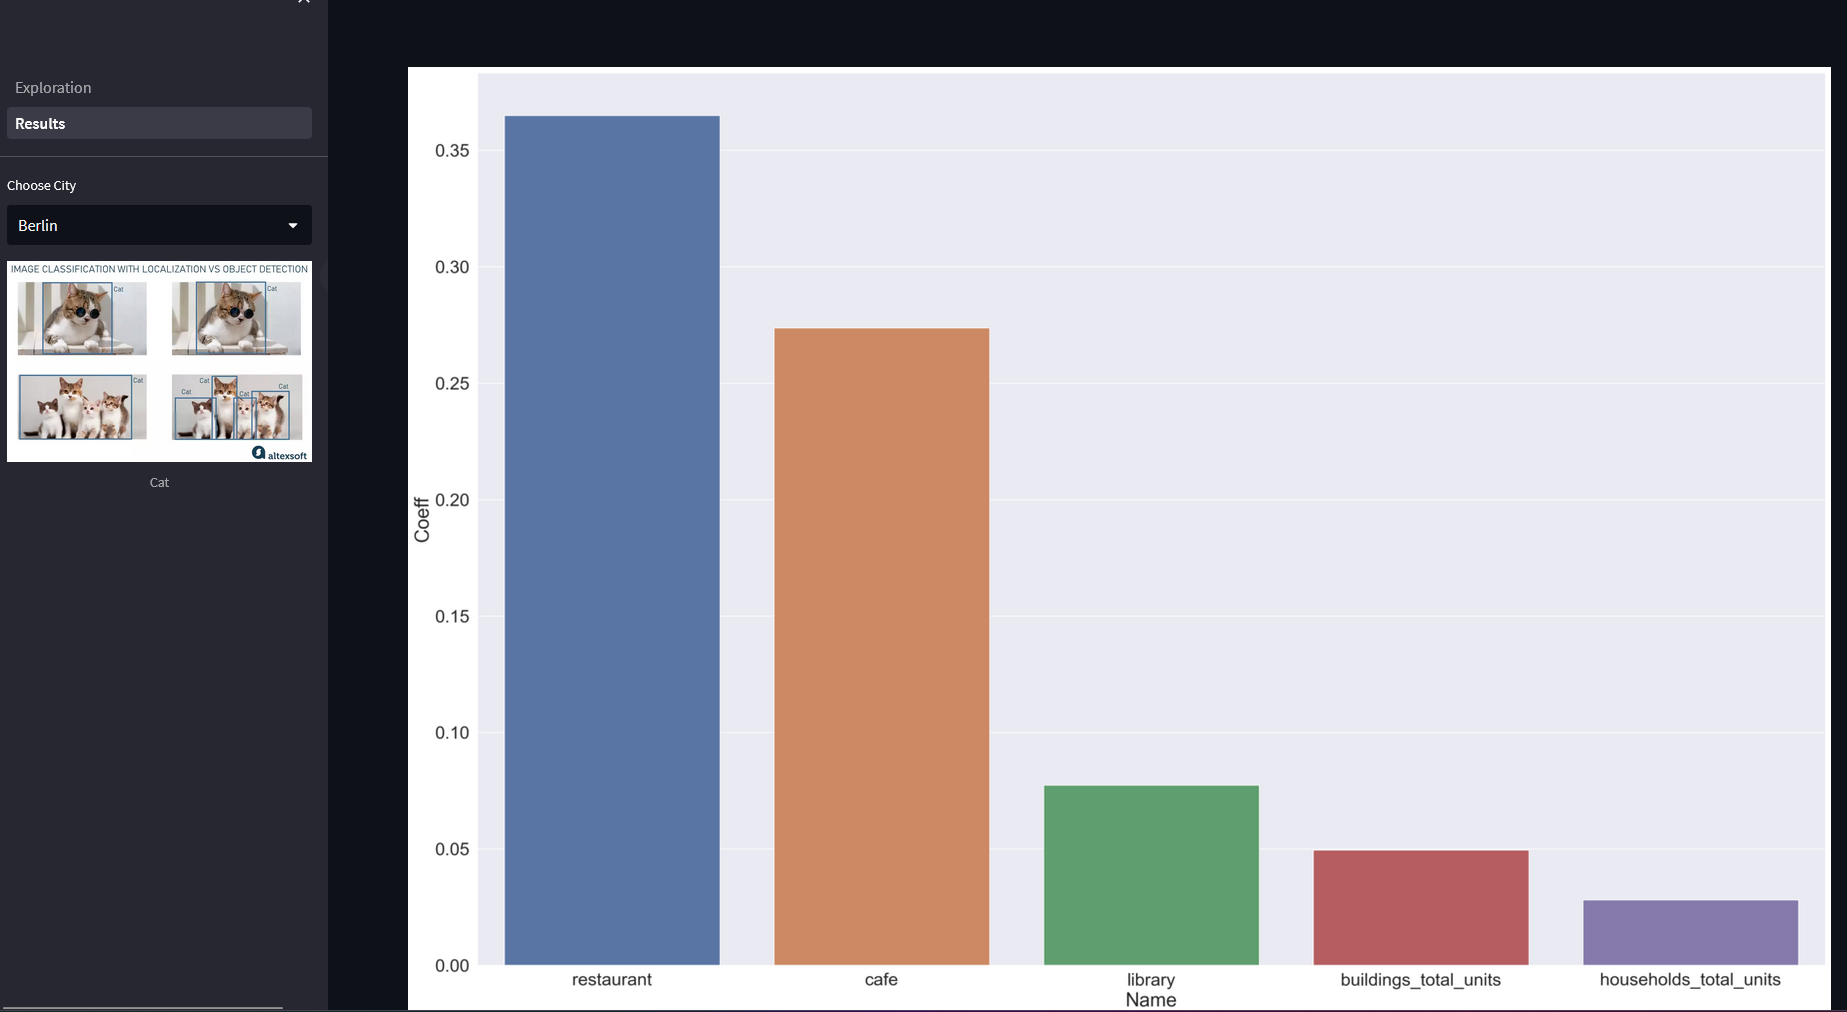
How we brought the features into production? With the extracted features we performed a Random Forest Regressor to identfy the most important factors that might drive the performance of the linear model most.
The calculated most important features are the independent variables for the linear model. The linear model for the city of Berlin has an R² of 0.678.
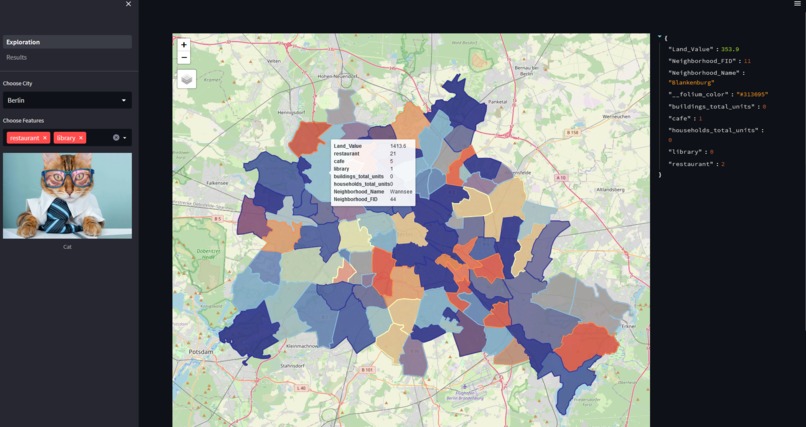
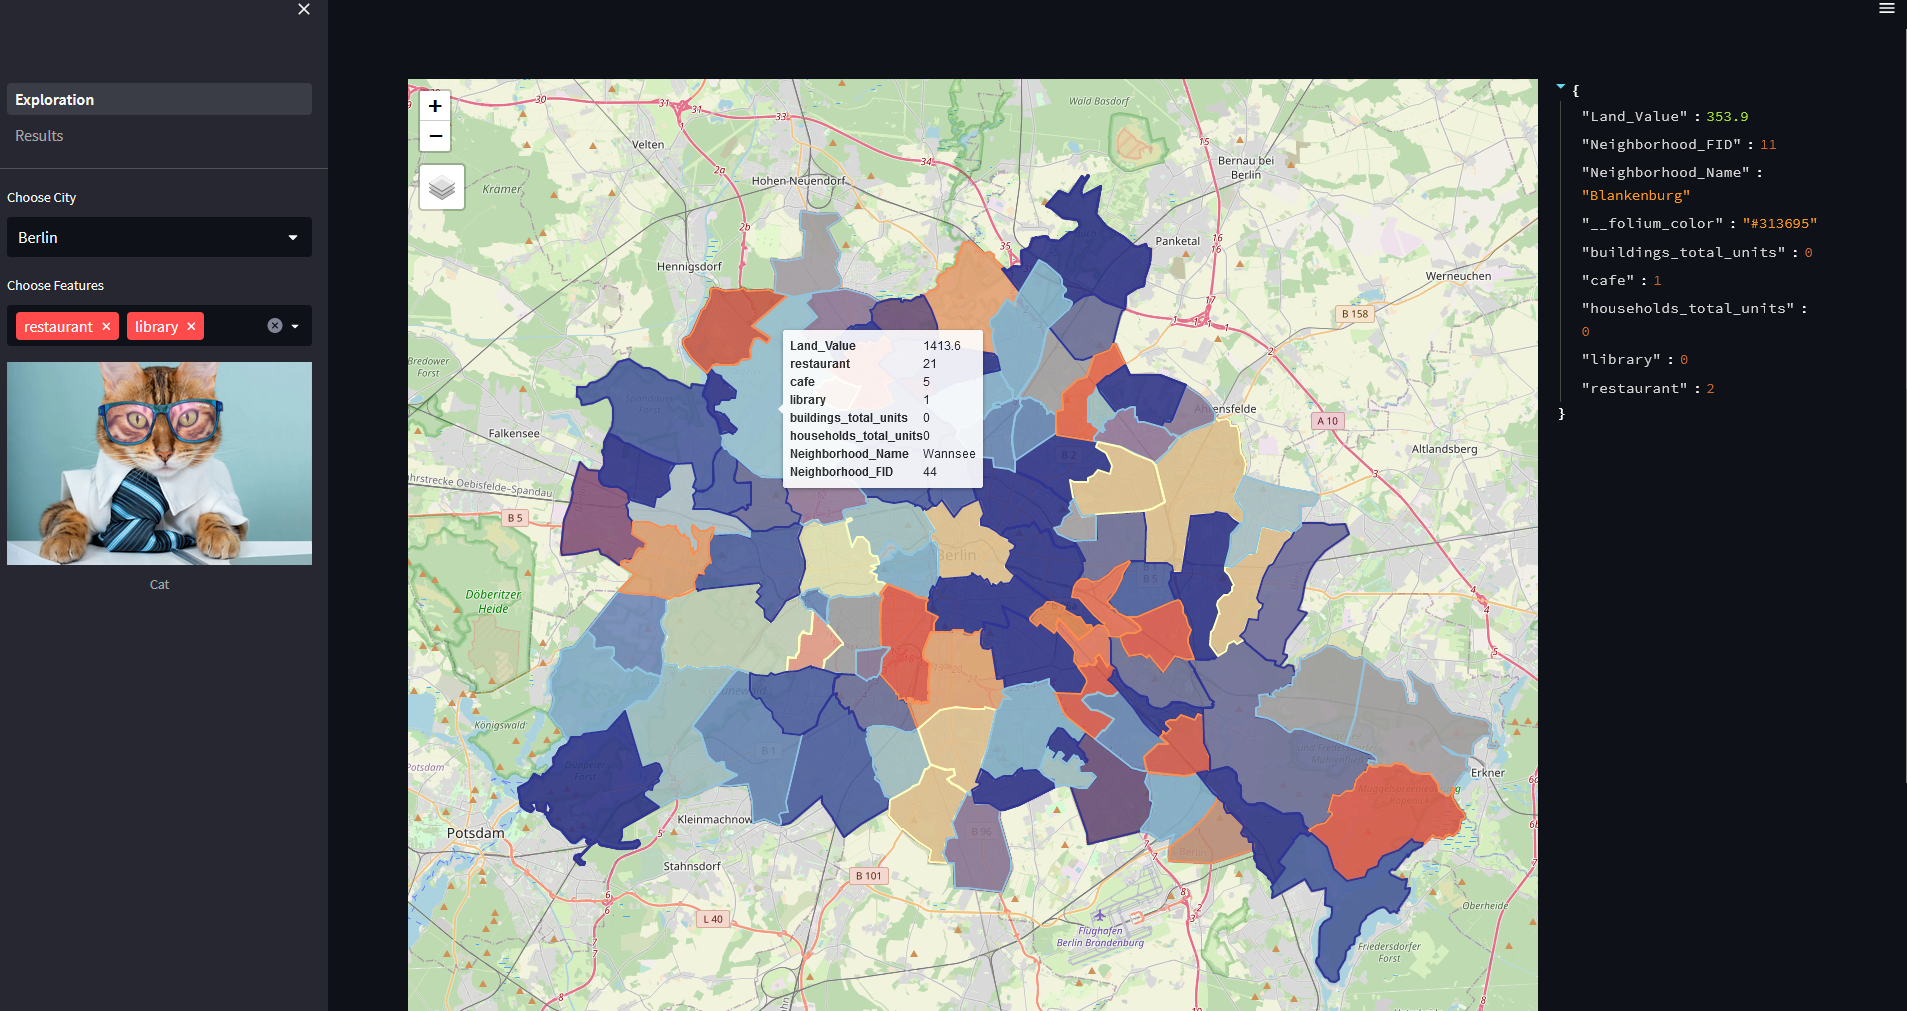
The results are presented in a Streamlit App that allow explorative geospatial data with included features for the cities of Berlin, Bremen, Dresden, Frankfurt and Cologne. Additionally it shows the overwhelming results from the Random Forest Regressor as Machine Learning tool as well as the results from the trained linear model.
How we built it
Census data We used census data at neighborhood level which is computed as the mean of the values at grid-level (). We implemented census as indicator for the socioeconomic status of the neighborhood which is again a good proxy for land prices. Since the census data set has a lot of features we run a Principal Component Analysis to reduce dimensionality. It reduces the number of features roughly by half per city.
Land Prices Within the Land Prices folder we splitted up the area types as additional features.
Open Street Map Data
Total distance of different edge types in each neighborhood: For each neighborhood we use the total length of different kinds of paths such as total length of roads, walking lanes, cycling lanes and others. We thought that this variable influences livability of the neighborhood and thereby the landprice (e.g. a lot of roads could negatively affect the price). We do this by feeding the polygons of each neighborhood into osmnx and getting the cumulative length of all the edges of a certain type (we use ['drive', 'bike', 'walk', 'drive_service', 'all', 'all_private']).
Total count of amenities in each neighborhood: For each neighborhood we use the count of different amenities (e.g. hospitals, restaurants). We thought that these variables are an indicator for populated and important regions with a higher demand for such services. We implemented this with osmnx where we get the count for all selected amenities in each neighborhood polygon. As amenities we used ["restaurant", "cafe", "school", "administration", "advertising", "archive", "bench", "ev charging", "financial advice", "gym", "hotel", "park", "library", "refugee housing", "student accommodation", "nursery", "preschool", "public building", "shop", "sport school", "hospital"].
Challenges we ran into
Handling geospatial data in general is not very easy, so we took a while to get familiar with it, especially in changing shapes, merging etc.
Accomplishments that we're proud of
We are proud of finally developed a fully working model with statistically robust results for the city of berlin and make it working in a atreamlit application.
What we learned
A lot about geospatial data in general, streamlit and that someone can reach a lot within short time with a super team.
What's next for Geo-paw-sitioning
No matter what's next, yes we can do it!!


Log in or sign up for Devpost to join the conversation.