Inspiration
Team USA athletes inspire millions, but the story of where they come from often goes untold. I wanted to celebrate every Olympian and Paralympian by mapping their hometowns and uncovering the geographic, climatic, and community factors that create athlete "hubs." This project honors not just medal winners, but every athlete who has represented the United States, while providing actionable insights for youth sports programs, state athletic committees, and community planners looking to invest in the next generation.
What it does
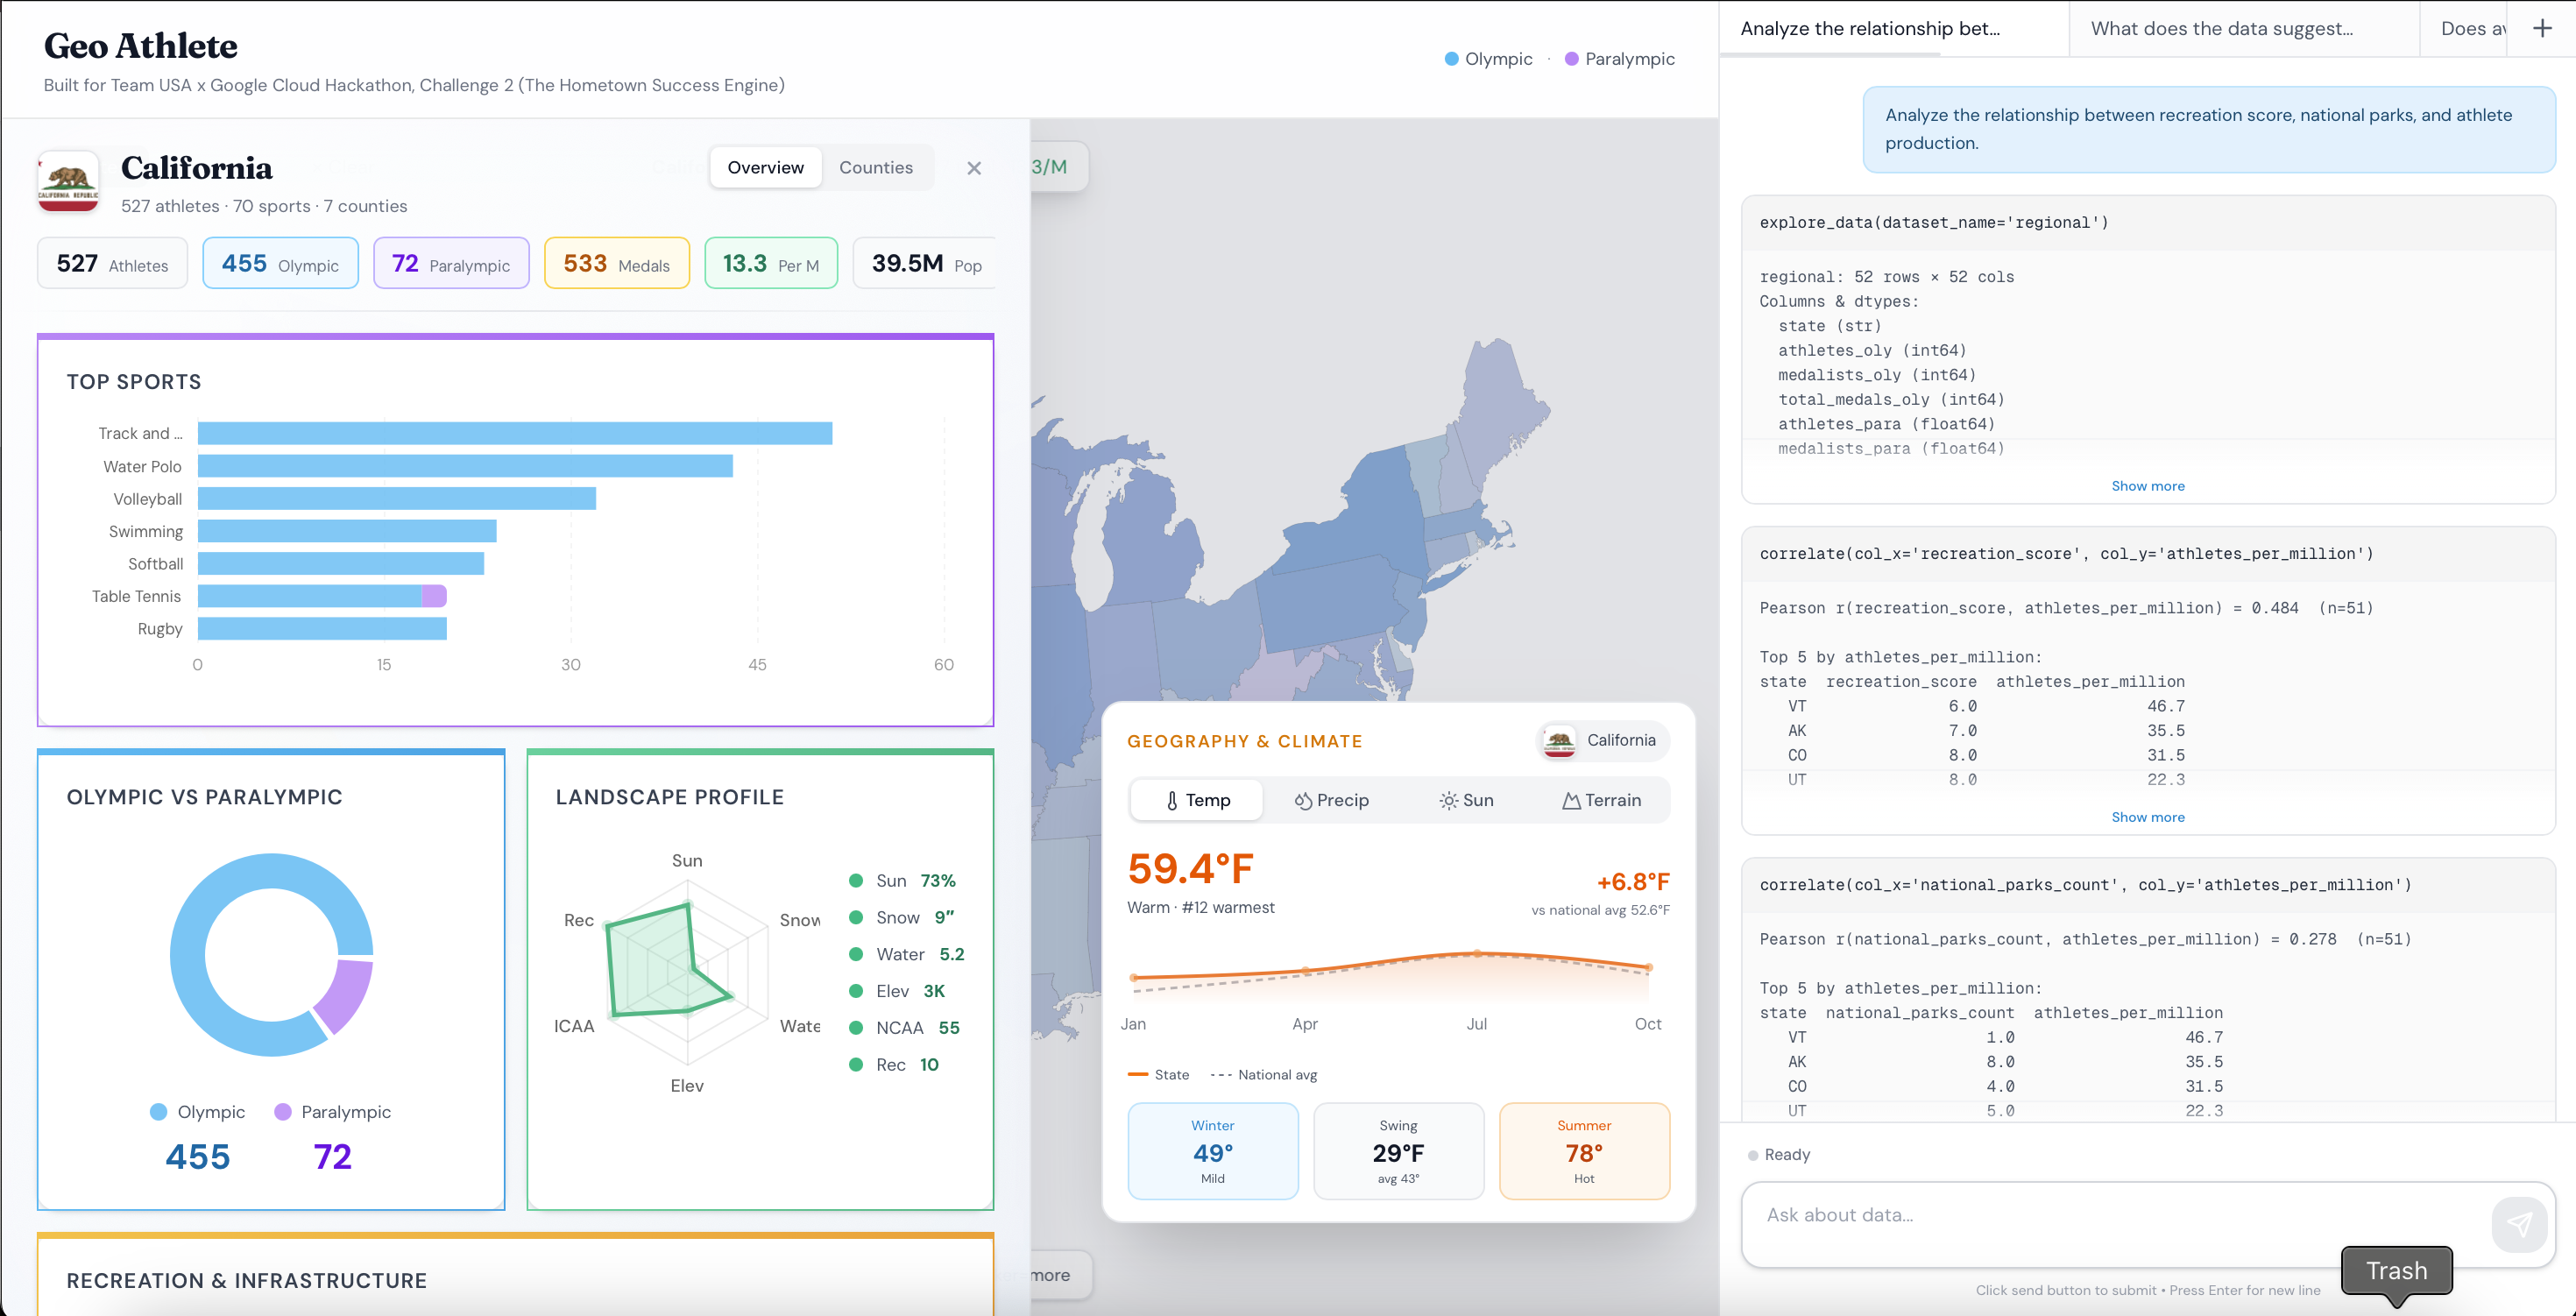
Geo Athlete is an interactive data visualization and AI analytics platform that transforms 18 public datasets into a comprehensive atlas of American athletic talent:
Core Features
- Interactive Geographic Explorer: Choropleth maps at state and county levels reveal athlete concentrations, with color intensity showing Olympic and Paralympic representation
- Gemini-Enabled Chat Assistant: Natural language queries powered by Google Gemini AI let users ask complex questions like "Which small states punch above their weight in producing athletes per capita?" or "Does snowfall correlate with winter sport success?"
- Multi-Dimensional Analysis: Correlate athlete production with:
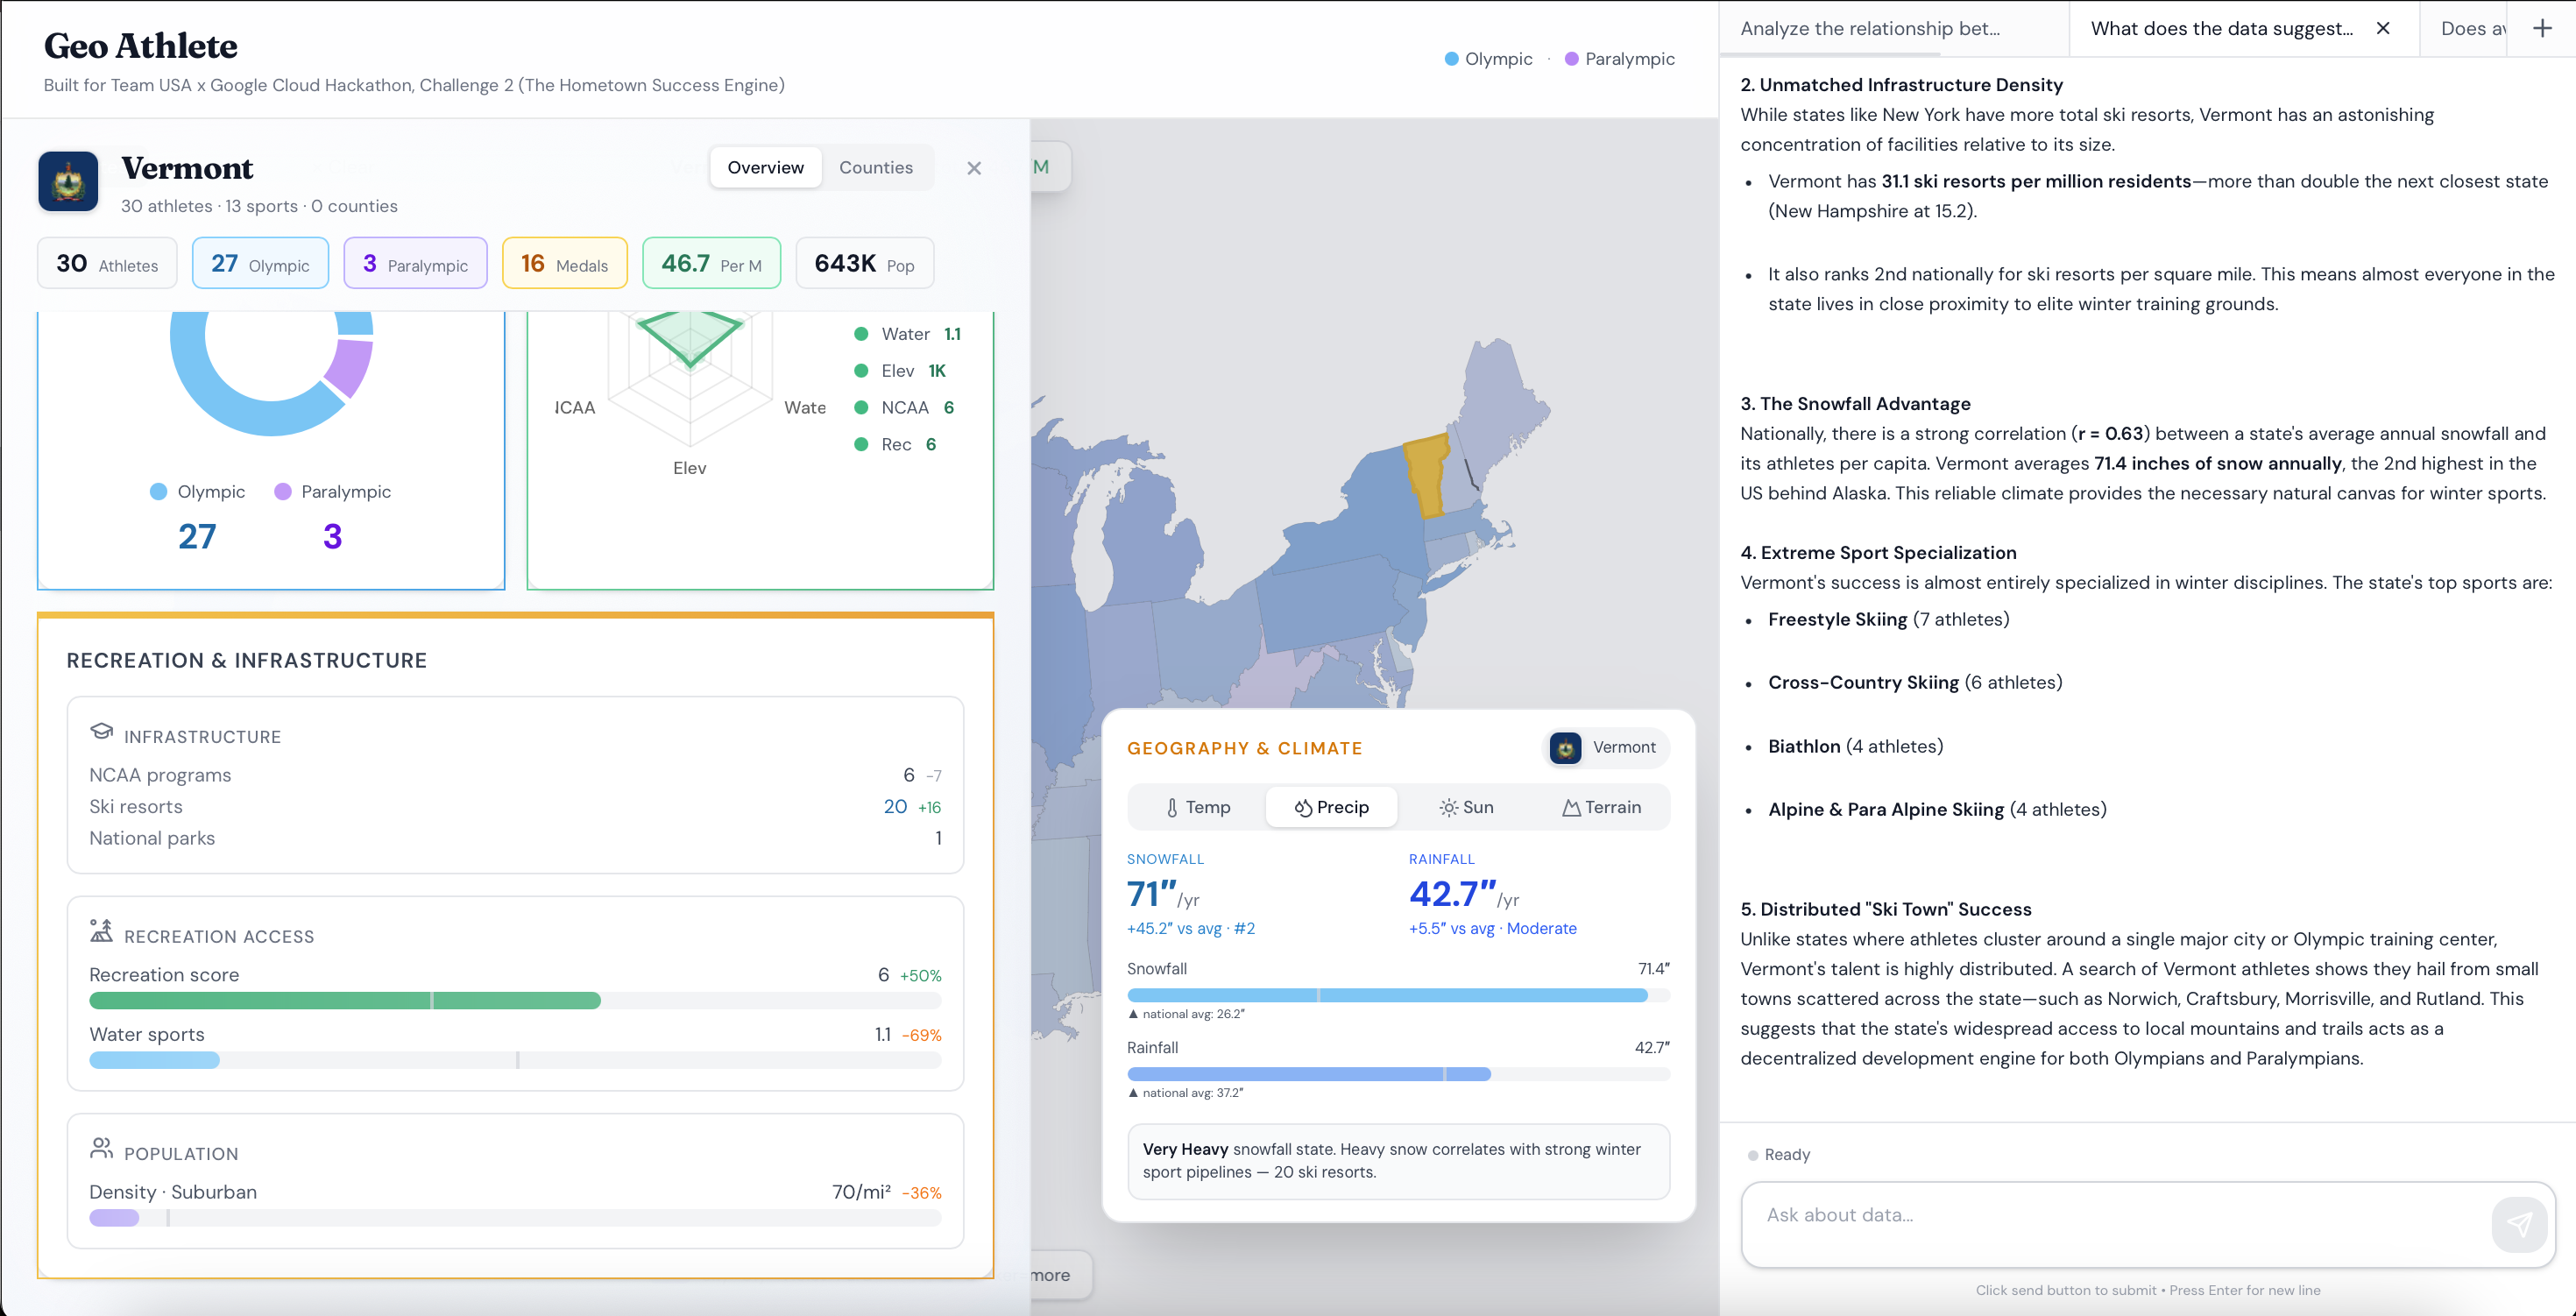
- Climate data (temperature, snowfall, sunshine)
- Geographic features (elevation, coastline, water bodies)
- Infrastructure (NCAA programs, ski resorts, recreation land)
- Demographics (population, income, urbanization)
- Paralympic Parity: Dedicated views ensuring Paralympic athletes receive equal visibility alongside their Olympic counterparts
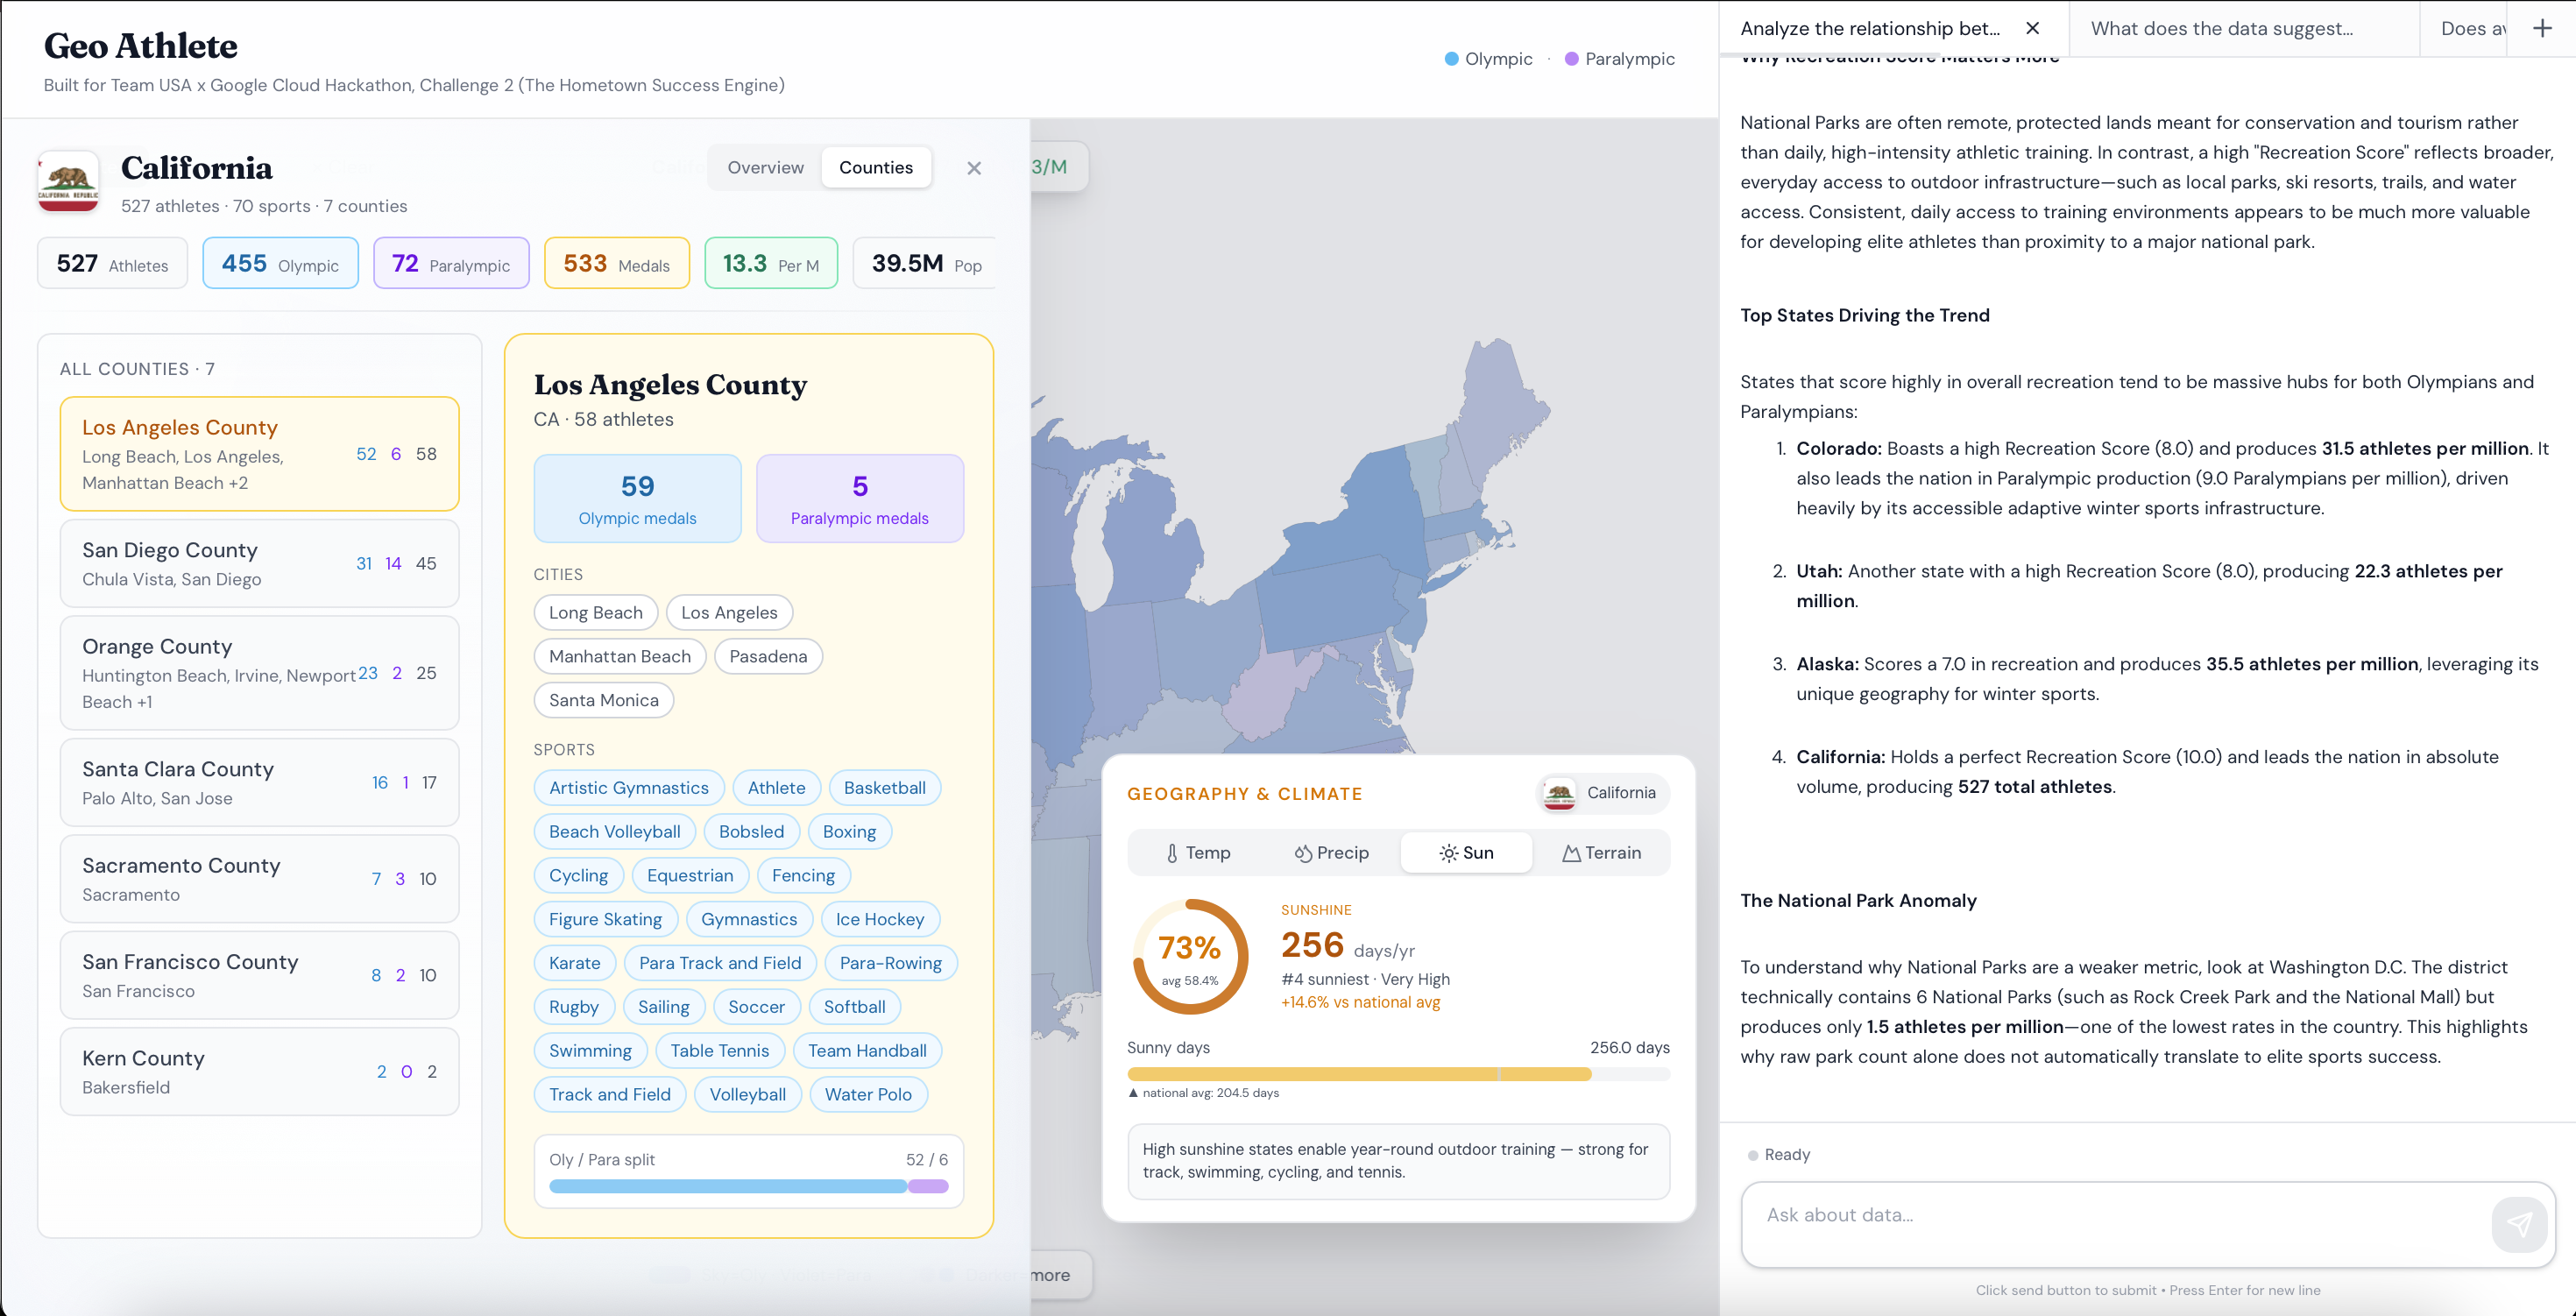
- County-Level Insights: Drill down to see specific cities and athletes from 3,143 counties
- Sport-Specific Breakdowns: Analyze which states dominate in swimming, track and field, ice hockey, wheelchair basketball, and 100+ other sports
Technical Innovation
My Gemini-enabled agent doesn't just answer questions—it executes Python code in real-time, performs statistical analysis, generates visualizations, and streams results back with full transparency. Users see the code, the output, and the reasoning behind every answer.
How I built it
Architecture
Frontend (Next.js + TypeScript)
    ↓ Queries
Backend (FastAPI + Python)
    ↓ AI Processing
LangGraph Agent (Google Gemini)
    ↓ Data Access
18 Data Sources → 5 Analytics Datasets
Data Sources
All 18 data sources are publicly available and fully reproducible. Each includes a download.py script and attribution documentation:
Athlete Data:
- Team USA Official Website — 8,526 athletes (Olympic + Paralympic) with hometowns, sports, and medal counts
- Paralympic Medal Matching — Cross-referenced Team USA data with Wikipedia medalist lists to derive career timelines
Demographics:
- US Census Bureau - State Population — 2020 Census state populations for per-capita analysis
- US Census Bureau - County Population — County-level populations (3,143 counties)
- US Census Bureau - Income — State median household income
- US Census Bureau - Land Area — State land area in square miles
- US Census Bureau - Urbanization — Urban vs rural population percentages
Climate:
- NOAA Climate Normals — 1991-2020 temperature and precipitation averages
- NOAA Snowfall — Average annual snowfall by state
- NOAA Sunshine — Percent possible sunshine by state
- NOAA Seasonal Temperature — Summer/winter temperature patterns
- NOAA Coastline — Coastline and shoreline miles per state
Geography:
- USGS Elevation — Mean elevation, highest/lowest points per state
- USGS National Hydrography — Major rivers, lakes, and water access
Infrastructure:
- NCAA Programs — NCAA Division I/II/III program counts by state
- Public Recreation Land — Federal land, state parks, national parks, ski resorts
Derived Data:
- County Climate Estimates — Weighted estimates from state-level NOAA data using population density
- City Altitude — Derived from USGS elevation data for hometown analysis
Every source is US Government public domain or publicly published reference data. Total dataset: 8,526 athletes across 3,143 counties in 51 states, merged into 5 optimized JSON files via a custom ETL pipeline (build_data.py).
Technologies
Frontend:
- Next.js 16 with React 19 and TypeScript
- react-simple-maps for SVG-based map rendering
- Recharts for climate/elevation visualizations
- Framer Motion for smooth transitions
- Tailwind CSS for responsive design
Backend & AI:
- FastAPI with Server-Sent Events (SSE) for real-time streaming
- Pandas / NumPy for data manipulation and statistical analysis
- LangGraph for agentic AI workflows with a ReAct loop
- LangChain for tool orchestration
- Google Gemini 3.1 Pro Preview (via Vertex AI) for natural language understanding, code generation, and multi-step reasoning
Cloud Infrastructure:
- Google Cloud Firestore — persists chat sessions and message history so conversations survive page reloads and can be resumed across tabs
- Google Cloud Run — both frontend and backend are containerized with Docker and deployed as fully managed Cloud Run services
- Google Artifact Registry — stores Docker images for CI/CD
- Vertex AI — hosts the Gemini model with service-account authentication
AI Agent Architecture
My custom Agent uses a ReAct (Reasoning + Acting) pattern:
- 13 specialized tools for querying athletes, geography, climate, sports, and infrastructure
- Streaming execution cells show Python code, outputs, and reasoning in real-time
- State management via LangGraph for multi-turn conversations
- Firestore persistence — every user query and assistant response is saved, enabling session history and tab switching
- Context-aware responses that reference specific states, counties, and athletes
My Findings
All insights below were extracted programmatically from the 18 merged datasets using the Gemini-powered agent. Every number is reproducible by running the same queries in the app.
Winter States Dominate Per-Capita Athlete Production
The top states by athletes per million residents are overwhelmingly cold-weather, high-elevation states:
| Rank | State | Athletes / Million | Climate | Snowfall |
|---|---|---|---|---|
| 1 | Vermont | 46.7 | Cold | Very Heavy |
| 2 | Alaska | 35.5 | Cold | Very Heavy |
| 3 | Colorado | 31.5 | Moderate | Very Heavy |
| 4 | Utah | 22.3 | Moderate | Heavy |
| 5 | Minnesota | 19.8 | Cold | Very Heavy |
There is a strong correlation (r = 0.63) between average annual snowfall and per-capita athlete production. Eight of the top ten states experience "Heavy" or "Very Heavy" snowfall and have "Cold" or "Severe" winters. Colorado and Utah sit at alpine elevations above 6,000 ft, and states like Vermont and Minnesota each have 20+ ski resorts, providing the training infrastructure to develop Winter Olympians and Paralympians at scale.
Urbanization Drives Volume, Not Efficiency
Urbanization correlates moderately with total athlete count (r = 0.44) but has virtually no relationship with athletes per capita (r = −0.05). Highly urban states like California produce more athletes in absolute terms simply because of population size, but the most efficient athlete-producing state, Vermont, is only 38.9% urban. Rural access to outdoor terrain and winter infrastructure appears to matter more than dense urban sports programs.
Income Matters, but Geography Matters More
Median household income shows a moderate positive correlation with per-capita athlete production (r = 0.40). Wealthier states can fund youth sports, equipment, and travel for competition. However, snowfall (r = 0.63) and elevation (r = 0.26) are stronger predictors, suggesting that natural geography still outweighs economic factors in determining where Olympic and Paralympic talent emerges.
Los Angeles County Is the #1 Athlete Hub
At the county level, Los Angeles County, CA leads the nation with 58 athletes (52 Olympians, 6 Paralympians) across sports including Artistic Gymnastics, Athletics, and Basketball. The combination of massive population, elite collegiate and professional training facilities, and year-round favorable weather creates an unmatched ecosystem.
Paralympic Representation Clusters in the Midwest
Paralympians make up 11.3% of the total 8,526 athletes. The states with the highest Paralympic-to-Olympic ratio are not coastal powerhouses but Midwestern and Southwest states: New Mexico (1.67:1), Oklahoma (0.89:1), Kansas (0.80:1), and Nebraska (0.75:1). This may reflect strong local adaptive sports programs and specialized rehabilitation/training centers in those regions.
The Top 5 Paralympic Sports
| Rank | Sport | Athletes |
|---|---|---|
| 1 | Para Track and Field | 128 |
| 2 | Para Swimming | 91 |
| 3 | Wheelchair Basketball | 60 |
| 4 | Para-Cycling | 57 |
| 5 | Para Alpine Skiing | 45 |
Coastal States Own the Water
Six of the top ten per-capita states have ocean coastlines or Great Lakes access (Hawaii, California, Massachusetts, Connecticut, Alaska, Minnesota). This geography feeds success in swimming, sailing, rowing, and surfing. Water sport access is a secondary but meaningful factor alongside snowfall and elevation.
Built With
- cloud-run
- fastapi
- firestore
- gemini
- next-js
- vertex-ai

Log in or sign up for Devpost to join the conversation.